Abstract
Purpose:
The superior radiation dose efficiency of a newly implemented differential phase contrast CT imaging method compared to the conventional absorption CT method is demonstrated.
Methods:
A differential phase contrast CT imaging method has recently been implemented using conventional x-ray sources with a grating interferometer consisting of three gratings. This approach offers the possibility of simultaneous reconstruction of both attenuation contrast and phase contrast images from a single acquisition. This enables a direct comparison of radiation dose efficiency of both types of reconstructed images under identical conditions. Radiation dose efficiency was studied by measuring the change in contrast-to-noise ratio (CNR) with different exposure levels. A physical phantom of 28.5 mm diameter was constructed and used for measurement of CNR in both the absorption and phase contrast CT images, which were reconstructed from the same data set.
Results:
For three of the four materials studied, at any given exposure level, the CNR of the differential phase contrast CT images was superior to that of the corresponding absorption contrast CT images. The most dramatic improvement was noted in the contrast between PMMA and water, where the CNR was improved by a factor of approximately 5.5 in the differential phase contrast CT images. Additionally, the CNR of phase contrast CT is empirically shown to have the same square root dependence on exposure, as is the case for absorption contrast CT.
Conclusions:
The differential phase contrast CT method provided higher CNR than conventional absorption CT at equivalent dose levels for most of the materials studied, and so may enable achievement of the same object visibility as conventional absorption CT methods at a lower exposure level.
Keywords: phase contrast, CT, CNR, dose
I. INTRODUCTION
Since Roentgen discovered x-rays in 1895, x-ray attenuation contrast has been the sole contrast mechanism used in medical imaging. However, due to the fundamental duality between particles and waves, researchers are keen on exploring new contrast mechanisms in x-ray imaging, with a special interest in using the wave nature of x-rays to conduct imaging experiments. When the wave nature is considered, one is reminded of the macroscopic phenomena observed in visible light: Reflection and refraction at the interface of two different media, as well as diffraction and interference. To describe these phenomena, a medium is often considered as homogeneous subregions with sharp boundaries, with each subregion having its own macroscopic refractive index , which can be written as1
| (1) |
where is the refractive index decrement, which describes the x-ray phase shift, and the imaginary part is responsible for x-ray attenuation. The refractive index is a dimensionless quantity and its imaginary part is related to the conventional linear attenuation coefficient as follows:
| (2) |
where is the wavelength of the x ray. The decrement in the x-ray refractive index and the imaginary part are given as
| (3) |
| (4) |
where is the electron density, is the classical radius of the electron, is the atomic number, and and are the product of the number density and photoelectric and Compton scattering cross sections, respectively.
It is well-known that x-ray beam intensity is attenuated according to the Beer–Lambert law
| (5) |
where and are exiting and entrance x-ray beam intensities, respectively. Therefore, by measuring the beam intensity change at many different view angles, one can reconstruct the local attenuation distribution using an appropriate image reconstruction algorithm.2
When x-rays and matter interact in the wave sense, due to differences in phase shift across the x-ray wave front as it traverses the object, the x-ray propagation direction will change after interacting with the imaging object. The change in propagation direction is measured by the refraction angle. The refraction angle is related to the decrement in the refractive index as following:
| (6) |
where is the x-ray path along the wave propagation direction, which is being aligned along the direction without loss of generality. Therefore, after measurement of the local refraction angles from many different view angles around the object, the local distribution of the decrement can be reconstructed using appropriate image reconstruction algorithms.3–5
In recent years, two different methods have been explored to measure the refraction angles: One method is diffraction enhanced imaging6–12 which uses Bragg diffraction principles to selectively measure beam intensity at each given refraction angle direction. The method was initially developed for synchrotron beam lines and has also been implemented using heavily filtered polychromatic x-ray beams from a conventional x-ray tube.10,13 The second method uses the Talbot–Lau interferometer with three gratings14–16 and a conventional x-ray tube. The required spatial coherence of the beam is achieved by splitting the x-ray beams into many different beamlets using one of the three gratings. The spatial coherence of each beamlet is sufficient for using the Talbot–Lau effect to measure the refraction angles. This is the imaging method used in this paper.
Because differential phase contrast CT imaging can be implemented using conventional x-ray tubes, it holds great potential for applications in medical imaging. Recent work has shown the ability of differential phase contrast imaging to provide quantitative and accurate imaging of a liquid contrast phantom.17 The simultaneous availability of both phase contrast and absorption contrast images was shown to improve object detectability.
In this paper, we aim to address the radiation dose efficiency problem: Given a fixed x-ray exposure, what contrast-to-noise ratio (CNR) can be generated for each contrast mechanism? In particular, at a given exposure level, does phase contrast CT have superior CNR to absorption contrast CT? In general, it would be difficult to make a fair comparison between the two different contrast mechanisms since the data acquisition conditions are different. However, in differential phase contrast CT data acquisitions, both phase and absorption CT images can be reconstructed from the same data set, allowing beam attenuation and refraction information to be obtained simultaneously. This allows study of the dependence of CNR with changes in exposure for both phase contrast and absorption contrast under identical conditions. Contrast-to-noise ratio has been widely studied in regards to medical imaging techniques and is a useful metric for determining the visibility of an imaging object according to the well-established Rose criterion.18
II. METHODS AND MATERIALS
II.A. Data acquisition system and phantom
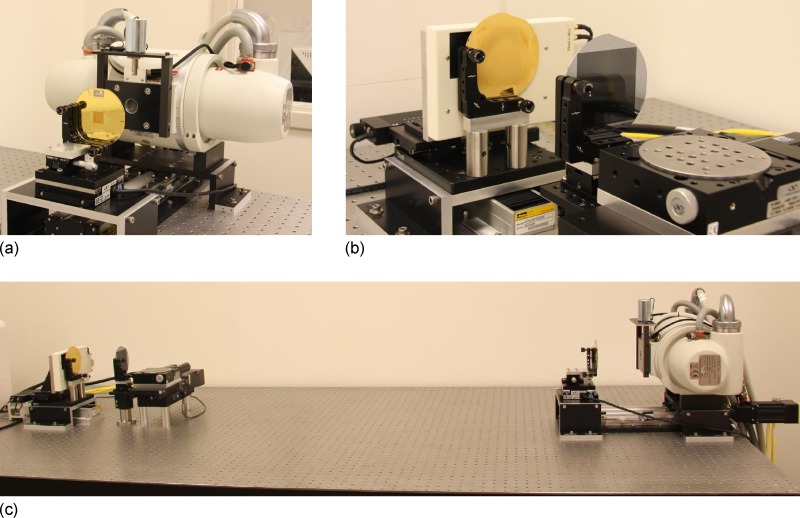
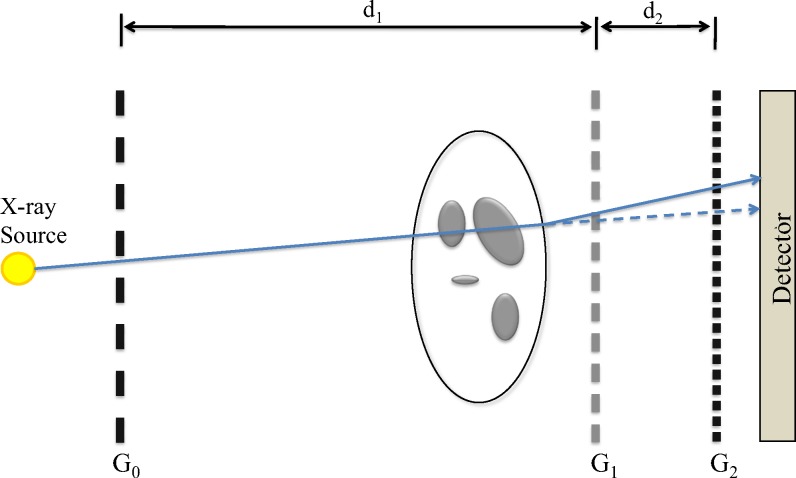
All data for the results presented in this work were collected from an experimental differential phase contrast imaging system constructed at the University of Wisconsin-Madison and shown in Fig. 1. The experimental data acquisition system is schematically shown in Fig. 2. The system uses the previously reported grating interferometer method19,20 to obtain the differential phase shift in x-rays as they propagate through a sample of interest.
FIG. 1.
Photographs of the grating interferometer x-ray system. The x-ray tube and the grating are shown in (a), while (b) shows the detector and gratings. The bottom photo, (c), shows the total arrangement of the system.
FIG. 2.
System design, showing relative grating and object placement, intergrating distances and , and source and detector location.
The system subcomponents used in the experimental setup include x-ray gratings, a rotating-anode x-ray tube, a flat-panel x-ray detector, and a rotating motion stage to enable tomographic acquisitions. The grating portion of the setup is comprised of three linear gratings fabricated using standard techniques described in literature.21 The gratings were designed to operate at a mean beam energy of 25 keV. The first grating, labeled , is an absorption grating, fabricated on silicon and electroplated with gold. It divides the x-ray beam exiting from the tube into an array of line sources with increased spatial coherence. This removes the dependence on small focal spot size to generate spatial coherence, thereby allowing the use of x-ray tubes with focal spot sizes exceeding . A previously reported work has been based on stationary-anode x-ray tubes, while in this work, a standard rotating-anode medical x-ray tube has been used. Rotating-anode tubes are capable of dramatically increased peak output power when compared to stationary-anode sources. However, rotor vibration and limitations in positional stability of the focal spot are potential limitations when used with an interferometer setup, as relative position changes of as little as 10 nm between components can cause measurable errors. The second grating, , is a phase grating, fabricated using a wet-etch procedure in Si. is designed to introduce a differential phase shift with a 50% duty cycle at the mean energy of the x-ray beam. The final grating, , is an absorption grating, fabricated the same way as , but with the additional step of electroplating gold along the walls of the grating. This grating acts as an analyzer so that the replicated fringe pattern from is converted to an intensity distribution at the detector. The pitch of is set to match the resulting fringe pattern from at the first fractional Talbot distance , which occurs with a spatial period of . This pattern is too small to be resolved directly, and so in order to measure phase changes induced by the presence of an object, a phase stepping approach is used to measure the differential phase on a per pixel basis.19 In this work, eight phase steps were used, sampled over the period. The average fringe visibility for the gratings was 0.16. The arrangement of the gratings, x-ray tube, and detector is shown in Fig. 2. The specifications for each grating are summarized in Table I, with the various system dimensions in Table II.
TABLE I.
Grating specifications.
| Grating | |||
|---|---|---|---|
| Pitch | 37 | 8 | 4.5 |
| Duty cycle (%) | 40.5 | 50 | 50 |
| Depth | 60 | 40 | 30 |
| Size | |||
TABLE II.
Setup distances.
| Distance(cm) | |
|---|---|
| 148.6 | |
| 18.1 | |
| Source to isocenter | 156.1 |
| Source to detector | 188.2 |
The x-ray tube used is a Varian G1582 (Palo Alto, CA) with 0.3 and 1.0 mm nominal focal spot sizes. The high voltage generator used is a CPI Indico 100 (Georgetown, Ontario, Canada). The detector is a Rad-icon Shad-o-Box 2048 (Sunnyvale, CA), with across a array. A cross section of the contrast phantom used is shown in Fig. 3. The polytetrafluoroethylene (PTFE), polymethyl methacrylate (PMMA), and polyoxymethylene (POM) rods are all 4.76 mm in diameter, while the air-filled tube has an inner diameter of 6.60 mm and wall thickness of 0.80 mm. The phantom chamber has an inner diameter of 25.4 mm and wall thickness of 1.55 mm. The phantom chamber was filled with water.
FIG. 3.
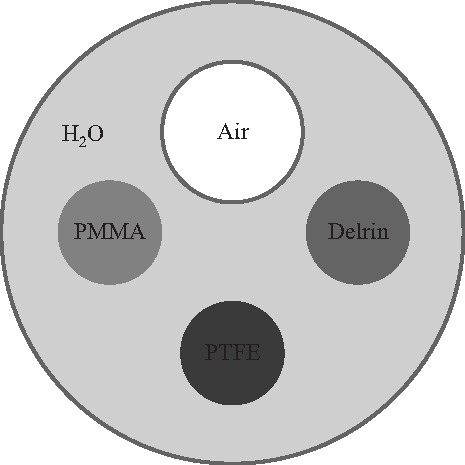
Three plastic rods and one air-filled plastic tube were placed in a water-filled plastic cylinder to evaluate CNR. Delrin is a trade name for POM.
For the CT acquisition, 360 projections were taken at 1° increments with eight phase steps per projection. Each projection had an exposure time of 40 s. Continuous tube currents of 2, 5, 10, and 20 mA were used to study the dependence of CNR with changes in exposure. For all scans, the tube potential was set to 40 kVp. For each current setting, the total exposure was measured with a Radcal 10X9-6 ionization chamber attached to a Radcal 9095 m, and is reported in Sec. III.
In order to reconstruct the projection data, the pixels are binned for an effective pixel size of . As a result of the cone beam geometry of the imaging system, the attenuation image and the phase contrast image are both reconstructed by FDK-type reconstruction algorithms.22 However, the reconstruction of the attenuation image is done by directly applying the FDK algorithm commonly used in attenuation CT, whereas the phase contrast image is reconstructed by extending a fan beam reconstruction algorithm for differential phase contrast CT to the 3-D case.5 The reconstructed image matrix is , with a voxel size of . The resulting images show two different quantities, with the absorption image showing the usual linear attenuation, while the phase contrast image shows the decrement of the real part of the refractive index.
II.B. Contrast-to-noise measurement
CNR was measured inside regions of interest within each of the four materials for both phase contrast and absorption contrast reconstructions at four exposure levels, to collect a total of 32 measurements. The CNR was defined as where and are the mean signal values measured from an ROI located in the insert object and water, respectively, and and are the measured noise values from the same regions.23 Noise values were calculated by first subtracting two image volumes reconstructed from two identical scans. The variance of the noise-only volume was divided by two to form an estimate of noise within a single image volume. This avoids incorporation of streaking or other reconstruction artifacts from influencing the noise measurement. The CNR measurements from 20 adjacent slices over a 1.6 mm range were averaged and the standard deviation of the 20 measurements was used as an error estimate.
III. RESULTS AND DISCUSSION
The exposure measurements for the projection data collection showed that the total exposure per projection was 45, 113, 227, and 460 mR for a 40 s projection integration time with tube currents of 2, 5, 10, and 20 mA, respectively.
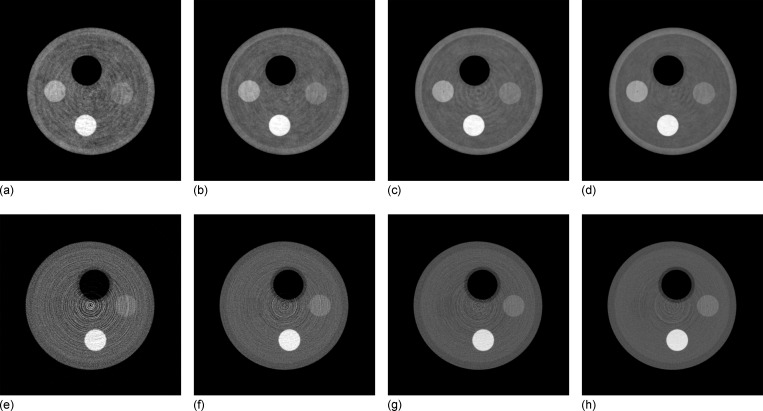
The projection data from all four scans were reconstructed with both absorption and phase contrast image reconstruction techniques. Representative slices from each volume are shown in Fig. 4. Signal data for each material, along with noise measurements, are presented in Tables III and IV. Note that the signal level for each material is nearly constant, while the noise decreases with exposure, as expected. The results of the CNR measurements are shown in Fig. 5. Although the reconstructions of both the absorption and differential phase contrast CT images use the same data set, it should be noted that the final grating causes a reduction in measured signal by a factor of 2, which would not normally exist in a standard absorption CT system. This results in an effective doubling of the required dose to the object to achieve absorption images equivalent to those acquired on a standard absorption imaging system without gratings. Therefore, for a fair comparison between the methods, the CNR of the phase contrast image must be greater than the absorption contrast image by at least a factor of , assuming a quantum-limited system, in order for the phase contrast image to be considered more dose efficient. For all materials measured except PTFE, the CNR of differential phase contrast CT was superior to absorption contrast CT by more than a factor of , while for PTFE the results were nearly equivalent. The differences between the two contrast mechanisms was most pronounced in the lowest contrast measurement, the PMMA/water combination. In this case, the measured CNR was higher in the phase contrast images by a factor of 7.8 compared to the absorption contrast CT images. After accounting for the signal loss due to the grating, the phase contrast result still outperformed absorption imaging by a factor of 5.5. Phase contrast imaging is sensitive to differences only in electron density, while absorption contrast due to photoelectric interactions is a function of both electron density and atomic number. Therefore, the CNR provided by either contrast mechanism will be dependent on the elemental composition of the material. Thus, two materials with very similar electron densities but differing atomic number would be expected to be better differentiated with absorption imaging than with phase contrast imaging.
FIG. 4.
[(a)–(d)] Differential phase contrast reconstructions and [(e)–(h)] absorption contrast reconstructions. The total exposure per projection is 45, 113, 227, and 460 mR for the first, second, third, and fourth column, respectively. The differential phase images are displayed over and the absorption images are displayed over , with a voxel size of .
TABLE III.
Measured linear attenuation coefficients for each phantom material.
| Exposure(mR/proj) | PMMA | POM | PTFE | Air | |
|---|---|---|---|---|---|
| 45 | |||||
| 113 | |||||
| 227 | |||||
| 460 |
TABLE IV.
Measured refractive index decrement for each phantom material.
| Exposure(mR/proj) | PMMA | POM | PTFE | Air | |
|---|---|---|---|---|---|
| 45 | |||||
| 113 | |||||
| 227 | |||||
| 460 |
FIG. 5.
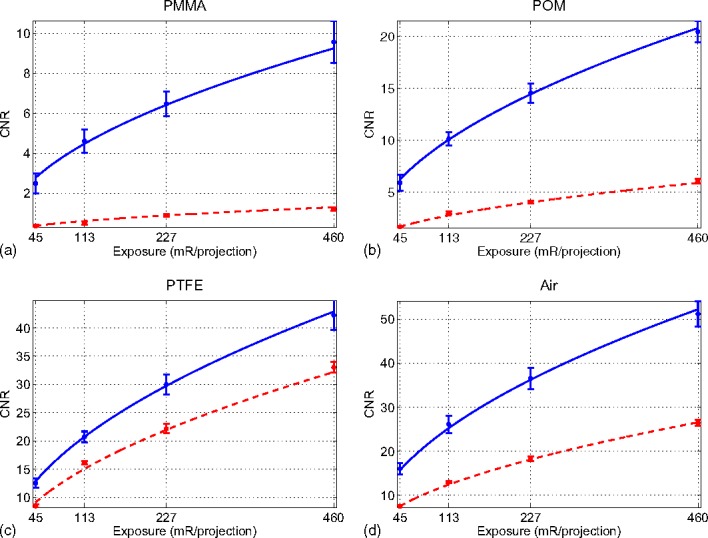
Measured CNR values for differential phase contrast and absorption contrast. Fits based on the measurements are shown as for phase contrast (solid line) and for absorption contrast (dashed lines).
The data for the measured CNR of each material was normalized and combined for each contrast mechanism. The two resulting curves were then fit to a power function of the form to determine the relationship between CNR and exposure. The calculated power was for phase contrast imaging and for absorption contrast imaging, which is consistent with the well-known square root law in conventional absorption CT. The above experimental results also indicate that the same square root law is valid in differential phase contrast CT. These relationships are shown in Fig. 5 as solid blue lines for phase contrast and dashed red lines for absorption contrast.
For a given image object and x-ray spectrum, radiation dose is directly proportional to the exposure. Thus, the above empirical functional relationship also dictates the following functional relationship between image noise variance and radiation dose :
| (7) |
where for differential phase contrast CT and for absorption contrast CT. These results indicate that both differential phase contrast and absorption contrast CT have the same dose-noise variance relationship. Additionally, as shown in our experimental results, this functional relationship is independent of image object composition, as would be expected.
In these preliminary results, no attempt was made to minimize radiation exposure, but reductions should be possible by additional filtration to remove low energy components of the beam which do not have sufficient energy to pass through the final two gratings, and therefore do not contribute to image formation. Additional reductions in exposure would be possible with increases in tube potential and suitably redesigned x-ray gratings; however, the dominance of Compton scatter as a source of attenuation at higher energies will ultimately limit improvements with increasing energy.
IV. CONCLUSION
The CNR for both differential phase contrast and absorption contrast CT for a tube potential of 40 kVp was measured over a range of exposure levels using a 28.5 mm phantom with multiple plastic inserts. The results showed that the phase contrast CT reconstruction has higher CNR than absorption imaging at equal exposure level for the PMMA, POM, and air inserts. Considering the CNR penalty incurred by the use of the grating in the absorption image, the absorption contrast mechanism is equally dose efficient for visualization of the PTFE insert. However, both contrast mechanisms produce sufficiently large CNRs ( at higher exposures), indicating that both contrast mechanisms would allow easy visualization of the object. The change in CNR with varying exposure is empirically shown to display the same square root relation that is displayed in standard absorption contrast CT measurements. The ability to simultaneously acquire phase contrast and absorption contrast images means that phase contrast imaging could be used alongside absorption-based imaging in order to both enhance detectability and provide additional information.
The successful use of a conventional rotating-anode x-ray tube, which has the possibility of introducing problems due to vibration and focal spot position instability in a sensitive interferometric technique such as that used here, demonstrates the potential for the use of such a system in a commercial or clinical setting, and would allow for the use of high-output x-ray tubes to reduce acquisition times.
The present system has spatial resolution and field of view specifications that are similar to many micro CT scanners, and it could be adapted for such studies while potentially providing dose savings over conventional absorption-based methods. If reconfigured to operate at lower spatial resolution and lower exposure levels, it could also be adapted to dedicated breast CT applications, potentially providing equivalent or better soft tissue contrast at lower radiation dose.
Further optimization of the x-ray interferometer gratings would allow for exposure to be reduced. Specifically, improvements in the grating fabrication and grating design would allow for a factor of 2 increase in fringe visibility (which is related to grating efficiency) at the detector. Fringe visibility exceeding 0.30 has been previously reported for similar system setups.24 Due to the inverse square relationship between noise variance and grating efficiency, this translates to a decrease in exposure by a factor of 4 while maintaining the CNR result shown here. Additionally, changes in beam filtration and increases in energy noted previously may help to further reduce exposure requirements.
REFERENCES
- 1.Als-Nielsen J. and McMorrow D., Elements of Modern X-ray Physics (Wiley, New York, 2001). [Google Scholar]
- 2.Kak A. C. and Slaney M., Principles of Computerized Tomographic Imaging (IEEE Press, NY, 1988). [Google Scholar]
- 3.Qi Z. and Chen G.-H., “A local region of interest image reconstruction via filtered backprojection for fan-beam differential phase-contrast computed tomography,” Phys. Med. Biol. 52, N417–N423 (2007). 10.1088/0031-9155/52/18/N03 [DOI] [PubMed] [Google Scholar]
- 4.Chen G.-H. and Qi Z., “Image reconstruction for fan-beam differential phase contrast computed tomography,” Phys. Med. Biol. 53, 1015–1025 (2008). 10.1088/0031-9155/53/4/013 [DOI] [PMC free article] [PubMed] [Google Scholar]
- 5.Qi Z. and Chen G.-H., “Direct fan-beam reconstruction algorithm via filtered backprojection for differential phase-contrast computed tomography,” X-ray Opt. and Instr. 2008, 835172 (2008). [Google Scholar]
- 6.Chapman D., Thomlinson W., Johnston R. E., Washburn D., Pisano E., Gmur N., Zhong Z., Menk R., Arfelli F., and Sayers D., “Diffraction enhanced x-ray imaging,” Phys. Med. Biol. 42, 2015–2025 (1997). 10.1088/0031-9155/42/11/001 [DOI] [PubMed] [Google Scholar]
- 7.Davis T. J., Gao D., Gureyev T. E., Stevenson A. W., and Wilkins S. W., “Phase-contrast imaging of weakly absorbing materials using hard X-rays,” Nature 373, 595–598 (1995). 10.1038/373595a0 [DOI] [Google Scholar]
- 8.Dilmanian F. A., Zhong Z., Ren B., Wu X. Y., Chapman L. D., Orion I., and Thomlinson W. C., “Computed tomography of x-ray index of refraction using the diffraction enhanced imaging method,” Phys. Med. Biol. 45, 933–946 (2000). 10.1088/0031-9155/45/4/309 [DOI] [PubMed] [Google Scholar]
- 9.Ingal V. N. and Beliaevskaya E. A., “X-ray plane-wave topography observation of the phase contrast from a non-crystalline object,” J. Phys. D: Appl. Phys. 28, 2314–2317 (1995). 10.1088/0022-3727/28/11/012 [DOI] [Google Scholar]
- 10.Parham C., Zhong Z., Connor D. M., Chapman L. D., and Pisano E. D., “Design and implementation of a compact low-dose diffraction enhanced medical imaging system,” Acad. Radiol. 16, 911–917 (2009). 10.1016/j.acra.2009.02.007 [DOI] [PubMed] [Google Scholar]
- 11.Zhu P., Wang J., Yuan Q., Huang W., Shu H., Gao B., Hu T., and Wu Z., “Computed tomography algorithm based on diffraction-enhanced imaging setup,” Appl. Phys. Lett. 87, 264101 (2005). 10.1063/1.2155117 [DOI] [Google Scholar]
- 12.Huang Z., Kang K., Zhu P., Huang W., Yuan Q., and Wang J., “Strategy of extraction methods and reconstruction algorithms in computed tomography,” Phys. Med. Biol. 52, 1–12 (2007). 10.1088/0031-9155/52/1/001 [DOI] [PubMed] [Google Scholar]
- 13.Ingal V., Beliaevskaya E., Brianskaya A., and Merkurieva R., “Phase mammography—A new technique for breast investigation,” Phys. Med. Biol. 43, 2555–2567 (1998). 10.1088/0031-9155/43/9/009 [DOI] [PubMed] [Google Scholar]
- 14.Pfeiffer F., Weitkamp T., Bunk O., and David C., “Phase retrieval and differential phase-contrast imaging with low-brilliance X-ray sources,” Nat. Phys. 2, 258–61 (2006). 10.1038/nphys265 [DOI] [Google Scholar]
- 15.Pfeiffer F., Kottler C., Bunk O., and David C., “Hard x-ray phase tomography with low-brilliance sources,” Phys. Rev. Lett. 98, 108105 (2007). 10.1103/PhysRevLett.98.108105 [DOI] [PubMed] [Google Scholar]
- 16.Pfeiffer F., Bech M., Bunk O., Kraft P., Eikenberry E. F., Brönnimann C., Grünzweig C., and David C., “Hard-X-ray dark-field imaging using a grating interferometer,” Nat. Mater. 7, 134–137 (2008). 10.1038/nmat2096 [DOI] [PubMed] [Google Scholar]
- 17.Herzen J., Donath T., Pfeiffer F., Bunk O., Padeste C., Beckmann F., Schreyer A., and David C., “Quantitative phase-contrast tomography of a liquid phantom using a conventional x-ray tube source,” Opt. Express 17, 10010–10018 (2009). 10.1364/OE.17.010010 [DOI] [PubMed] [Google Scholar]
- 18.Rose A., “The sensitivity performance of the human eye on an absolute scale,” J. Opt. Soc. Am. 38, 196–208 (1948). 10.1364/JOSA.38.000196 [DOI] [PubMed] [Google Scholar]
- 19.Weitkamp T., Diaz A., David C., Pfeiffer F., Stampanoni M., Cloetens P., and Zeigler E., “X-ray phase imaging with a grating interferometer,” Opt. Express 13, 6296–6304 (2005). 10.1364/OPEX.13.006296 [DOI] [PubMed] [Google Scholar]
- 20.Weitkamp T., David C., Kottler C., Bunk O., and Pfeiffer F., “Tomography with grating interferometers at low-brilliance sources,” Proc. SPIE 6318, 63180S (2006). 10.1117/12.683851 [DOI] [Google Scholar]
- 21.David C., Bruder J., Rohbeck T., Grünzweig C., Kottler C., Diaz A., Bunk O., and Pfeiffer F., “Fabrication of diffraction gratings for hard X-ray phase contrast imaging,” Microelectron. Eng. 84, 1172–1177 (2007). 10.1016/j.mee.2007.01.151 [DOI] [Google Scholar]
- 22.Feldkamp L. A., Davis L. C., and Kress J. W., “Practical cone-beam algorithm,” J. Opt. Soc. Am. A 1, 612–619 (1984). 10.1364/JOSAA.1.000612 [DOI] [Google Scholar]
- 23.Siewerdsen J., Daly M., Bakhtiar B., Moseley D., Richard S., Keller H., and Jaffray D., “A simple, direct method for x-ray scatter estimation and correction in digital radiography and cone-beam CT,” Med. Phys. 33, 187–197 (2006). 10.1118/1.2148916 [DOI] [PubMed] [Google Scholar]
- 24.Kottler C., Pfeiffer F., Bunk O., Grünzweig C., and David C., “Grating interferometer based scanning setup for hard x-ray phase contrast imaging,” Rev. Sci. Instrum. 78, 043710 (2007). 10.1063/1.2723064 [DOI] [PubMed] [Google Scholar]


