Abstract
The authors present and evaluate concepts for image reconstruction in dual source CT (DSCT). They describe both standard spiral (helical) DSCT image reconstruction and electrocardiogram (ECG)-synchronized image reconstruction. For a compact mechanical design of the DSCT, one detector (A) can cover the full scan field of view, while the other detector (B) has to be restricted to a smaller, central field of view. The authors develop an algorithm for scan data completion, extrapolating truncated data of detector (B) by using data of detector (A). They propose a unified framework for convolution and simultaneous 3D backprojection of both (A) and (B) data, with similar treatment of standard spiral, ECG-gated spiral, and sequential (axial) scan data. In ECG-synchronized image reconstruction, a flexible scan data range per measurement system can be used to trade off temporal resolution for reduced image noise. Both data extrapolation and image reconstruction are evaluated by means of computer simulated data of anthropomorphic phantoms, by phantom measurements and patient studies. The authors show that a consistent filter direction along the spiral tangent on both detectors is essential to reduce cone-beam artifacts, requiring truncation of the extrapolated (B) data after convolution in standard spiral scans. Reconstructions of an anthropomorphic thorax phantom demonstrate good image quality and dose accumulation as theoretically expected for simultaneous 3D backprojection of the filtered (A) data and the truncated filtered (B) data into the same 3D image volume. In ECG-gated spiral modes, spiral slice sensitivity profiles (SSPs) show only minor dependence on the patient’s heart rate if the spiral pitch is properly adapted. Measurements with a thin gold plate phantom result in effective slice widths (full width at half maximum of the SSP) of for the nominal slice and for the nominal slice. The visually determined through-plane ( axis) spatial resolution in a bar pattern phantom is for the nominal slice and for the nominal slice, again almost independent of the patient’s heart rate. The authors verify the theoretically expected temporal resolution of at gantry rotation time by blur free images of a moving coronary artery phantom with rest phase and demonstrate image noise reduction as predicted for increased reconstruction data ranges per measurement system. Finally, they show that the smoothness of the transition between image stacks acquired in different cardiac cycles can be efficiently controlled with the proposed approach for ECG-synchronized image reconstruction.
Keywords: dual source CT, multidetector row CT, CT image reconstruction, CT image quality evaluation, cardiac CT
I. INTRODUCTION
The first after the broad introduction of multidetector row CT (MDCT) into clinical practice were characterized by a race for more slices. 4-, 8-, 16-, 32-, and 64-slice CT systems were introduced in rapid succession.1–5 Using 64-slice CT scanners, the whole body can be examined with isotropic submillimeter resolution in very short scan times. Today, alternative system concepts are being considered that have the potential to solve remaining limitations of conventional MDCT scanners, such as insufficient temporal resolution for electrocardiogram (ECG)-controlled cardiac imaging.
Motion artifacts due to inadequate temporal resolution are a challenge for ECG-triggered and ECG-gated examinations of the heart and the coronary arteries even with the latest generation of MDCT. Further improved temporal resolution of less than at all heart rates is desirable to eliminate the need for heart rate control by administration ofbetablockers, which have contraindications and slow down the clinical workflow. Increased gantry rotation speed rather than multisegment reconstruction appears preferable for robust clinical performance.6,7 An alternative to further increased gantry rotation speed in conventional third generation MDCT systems is a scanner concept with multiple x-ray tubes and detectors.8,9
A recently introduced dual-source CT (DSCT) scanner (SOMATOM Definition, Siemens Healthcare, Forchheim, Germany) is equipped with two x-ray tubes and two corresponding detectors that are mounted onto the rotating gantry with an angular offset of 90°. The key benefit of DSCT for cardiac scanning is improved temporal resolution. A scanner of this type provides temporal resolution equivalent to a quarter of the gantry rotation time ( at rotation time) in a sufficiently centered scan field of view (SFOV), independent of the patient’s heart rate.10 Both acquisition systems can also be simultaneously operated in a standard spiral (helical) or sequential acquisition mode, in this way utilizing the power reserves of two x-ray tubes for long scan ranges and obese patients. Additionally, both x-ray tubes can be operated at different kV and mA settings, enabling the acquisition of dual energy data that can provide additional functional information.11–15
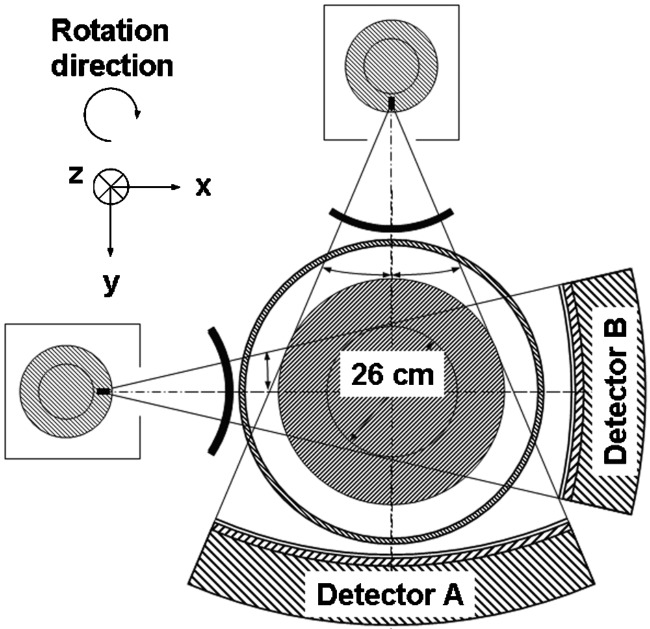
Despite their potential clinical benefits, DSCT systems have to cope with a number of challenges. One major challenge for image reconstruction is data truncation: for a compact gantry design, one detector (A) covers the entire SFOV ( in diameter), while the other detector (B) is restricted to a smaller, central field of view ( in diameter), see Fig. 1. As a consequence, the projection data of detector (B) are truncated if the scanned object extends beyond the central field of view, and the data will have to be extrapolated. Another challenge is cross-scattered radiation, i.e., scattered radiation from x-ray tube (B) detected in detector (A) and vice versa. Cross-scattered radiation can produce artifacts and degrade the contrast-to-noise ratio of the images, and it requires adequate correction.
FIG. 1.
Technical realization of a DSCT system (SOMATOM Definition, Siemens Healthcare, Forchheim, Germany). One detector (A) covers the entire scan field of view with a diameter of , while the other detector (B) is restricted to a smaller, central field of view.
In this article we present and evaluate concepts for data extrapolation and image reconstruction in DSCT. We develop an approach for scan data completion, extrapolating truncated data of detector (B) by using data of detector (A). We describe both standard spiral (helical) DSCT image reconstruction and ECG-synchronized image reconstruction that allows for visualization of the cardiothoracic anatomy in preselected phases of the patient’s cardiac cycle. We evaluate both data extrapolation and image reconstruction by means of computer simulated data of anthropomorphic phantoms, by phantom measurements and patient studies.
II. MATERIALS AND METHODS
II.A. Image reconstruction for dual source CT
II.A.1. System geometry
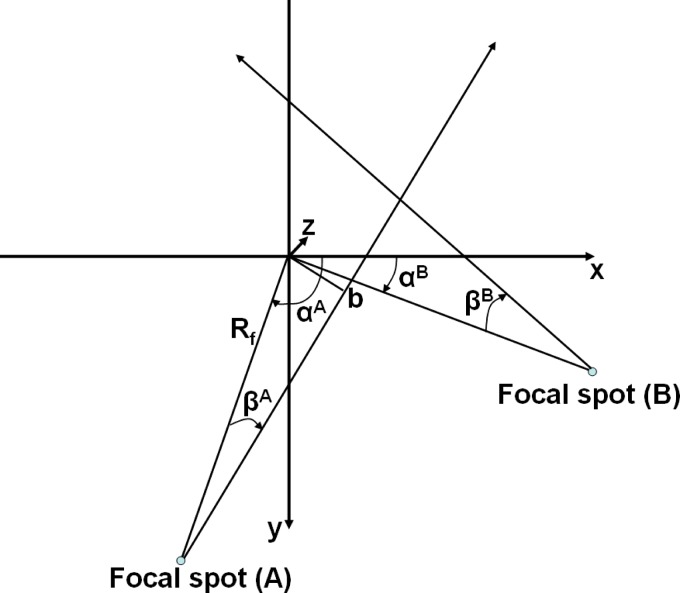
Both multirow detectors (A) and (B) form cylindrical surfaces with radius . is the focus-isocenter distance, is the detector-isocenter distance. The system geometry is shown in Fig. 2. The focus of both x-ray tubes moves along a spiral (helical) path with radius . The path of x-ray tube (A), corresponding to detector (A), is given by
| (1) |
Consequently, the path of x-ray tube (B) is given by
| (2) |
is the projection angle, i.e., the angle between a straight line from the focal spot to the origin and the axis. Due to the mechanical assembly of both measurement systems,
| (3) |
is the table feed per rotation. is the slice thickness of each of the simultaneously acquired slices of detectors (A) and (B), measured at the isocenter, and is the spiral (helical) pitch.
FIG. 2.
System geometry of a DSCT system. The axis points into the paper plane and from the patient table into the gantry.
Each individual measurement ray is characterized by its detector (A) or (B), its projection angle , its fan angle within a projection and by its slice index , with . Another set of variables characterizing the rays in parallel geometry is , , and . is the azimuthal angle and denotes the distance of a ray from the isocenter. Two simple equations relate the two sets of variables, namely
| (4) |
The logarithmic attenuation values, i.e., the line integrals of the object’s attenuation coefficient along the measured rays are denoted by either or . We additionally introduce the relative -position of a slice on the detector, given by
| (5) |
with . In this notation, measured rays are denoted by either or .
The evaluated DSCT-scanner (SOMATOM Definition, Siemens Healthcare, Forchheim, Germany) acquires fan-beam projections characterized by discrete projection angles and fan angles . The focus-isocenter distance is . is the number of detector channels of detectors (A) and (B), respectively, with and . In order not to overload the following equations with details of the discretization (which is similar to4,5), we use continuous notation with
| (6) |
is the full fan angle of detectors (A) and (B), respectively.
Prior to image reconstruction the undergo a model-based correction for cross-scattered radiation. This correction will be described in a separate article.
The evaluated DSCT scanner uses the -flying focal spot technique for both measurement systems.5 Two subsequent readings with slices and collimated slice width are combined to one projection with slices and a sampling distance of at the isocenter. This way, each detector acquires overlapping slices per projection, each with slice width . Parallel rebinning of cone-beam projection data with -flying focal spot was reported in Ref. 5 and will not be repeated here.
The position of slice of a cone-beam projection in parallel geometry relative to the isocenter of the detector depends on [see Eq. (4)] and is given by
| (7) |
Parallel projections consist of rays belonging to different projection angles and thus in the spiral (helical) mode to different positions of the x-ray source.
II.A.2. Extrapolation of truncated spiral (helical) data
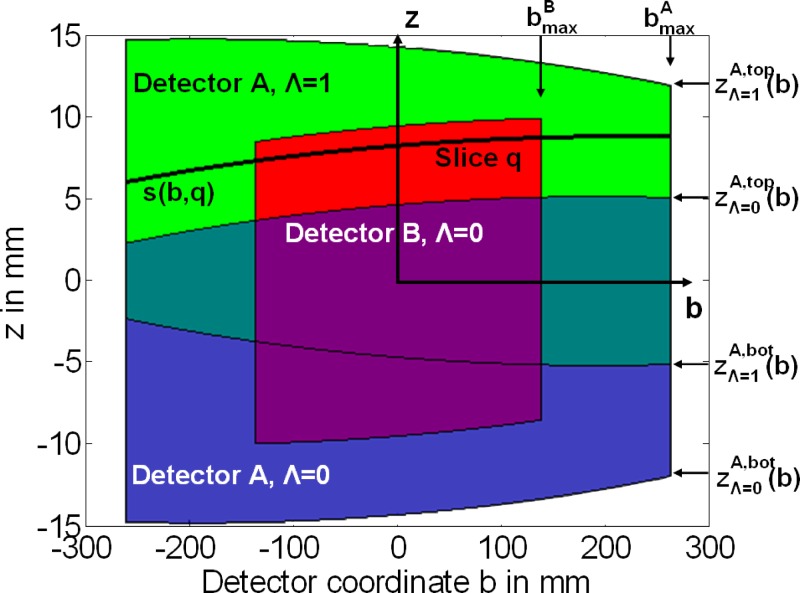
While detector (A) covers the full field of view (radius ), detector (B) only covers a smaller, central field of view (radius ). As a consequence, the projection data of detector (B) are potentially truncated and will have to be extrapolated before reconstruction to avoid truncation artifacts in the images. We use data acquired with detector (A) to extrapolate the truncated projections of detector (B). The extrapolation is done in parallel geometry. Due to the mechanical assembly of the DSCT system, the corresponding (A) data used to extrapolate (B) data at a certain projection angle are acquired either a quarter rotation earlier (same half turn of the spiral, ), or a quarter rotation later (next half turn of the spiral, ), see Fig. 3.
FIG. 3.
Data completion of truncated (B) data in parallel geometry. The -axis corresponds to the patient axis. A slice on detector (B) is indicated. (A) data measured at the same view angle are used to extrapolate the (B) projections in the direction. If no (A) data from the current half turn of the spiral are available, as in this case, (A) data from the adjacent half turn are used.
At any parallel projection angle , top edge and bottom edge of detector (A) for relative to the center position of detector (B) are given by [see Eq. (7)],
| (8) |
accounts for a potential displacement of detector (A) relative to detector (B) due to mechanical tolerances that can be measured in the system adjustment procedure. Note that at the same angular position detector (A) has a offset of relative to detector (B). For (next half turn of the spiral) we obtain
| (9) |
Equation (9) is obtained from Eq. (7) by replacing each ray at by its complementary ray at . Detector (A) has a offset of relative to detector (B).
Each slice of detector (B) is extended to the full field of view of detector (A). The -dependent position of slice on detector (B) is given by Eq. (7) (see also Fig. 3).
By inserting into Eq. (7) this -dependent position can be extended to the full size of detector (A). As a first step, a “virtual slice” on detector (A) that corresponds to this position is calculated
| (10) |
is not necessarily an integer number. The projection data corresponding to the virtual slice are obtained by a linear interpolation between adjacent detector rows of detector (A). The interpolated are used to extend beyond the limits of the small SFOV of detector (B).
If , data from detector (A) acquired in the same half turn of the spiral are used for extrapolation. Otherwise, data measured in the next half turn of the spiral are used. In the example shown in Fig. 3, for the indicated slice . To obtain a smooth transition between the data from detector (A) and the measured data from detector (B) at the boundaries, a smooth transition function is used in the extrapolation step
| (11) |
We use the following weighting function of length ,
| (12) |
II.A.3. Spiral (helical) image reconstruction
After data completion, a 3D filtered backprojection reconstruction of the Feldkamp type16,17 is applied to the data.
(a) Convolution. In the convolution step both spiral (helical) datasets (A) and (B) are independently filtered along the row direction with a standard (e.g., Shepp–Logan) kernel , as described in Ref. 17 for the single source case. We obtain for the filtered projection data :
| (13) |
Recently, it was shown that the choice of the proper direction along which the data should be filtered is of critical importance for the image quality achieved with 3D filtered backprojection17. Filtering of the data in the direction of the spiral tangent—or as an approximation filtering of the data in the direction after rebinning to parallel geometry—can markedly reduce artifacts and improve image quality. While the correct filter direction is obtained in the full SFOV for the data of detector (A), the situation is more problematic for detector (B) due to the required data extrapolation. If data from a different half turn of the spiral are used for extrapolation, the direction of the spiral tangent is different, and a consistent filter direction across the entire detector cannot be obtained (see Fig. 3). The filter direction in the small SFOV and the filter direction outside differ more the higher the spiral pitch is, and the number of rows that have to be completed with data increases with increasing pitch (see Fig. 3). Furthermore, the (A) rays have other cone angles than the corresponding (B) rays, which may lead to additional cone-beam artifacts in the vicinity of -inhomogeneous high-contrast objects outside the central SFOV covered by detector (B). A way out of this dilemma is to truncate the extrapolated (B) data again at the boundaries of the small SFOV after convolution and to backproject only the truncated (B) data.
(b) 3D backprojection. In the proposed spiral (helical) DSCT reconstruction, both the filtered data of detector (A) and of detector (B) are simultaneously backprojected into the same 3D image volume.
For each voxel in this volume and for each projection angle , the following sum over all half turns of the spiral that illuminate this voxel is calculated:
| (14) |
and denote the detector coordinates17 of the rays originating from x-ray source (A) and x-ray source (B), respectively, which hit voxel :
| (15) |
with
| (16) |
Note that are relative detector coordinates with , see Eq. (5). is a smooth detector weighting function that assigns less weight to the outer detector rows with larger cone-angle to reduce cone-beam artifacts, for details see Ref. 17. is given by
| (17) |
Weight , which is only applied to (B) data, depends on the parallel coordinate and truncates the projection data after convolution
| (18) |
This way, measured (B) data only are backprojected both inside and outside the small SFOV. Hence, detector (B) produces no complete CT image outside the small SFOV, but its rays at a certain projection angle are averaged with the corresponding rays from detector (A) to accumulate as much radiation dose as possible. Equation (15) implies some kind of interpolation (typically bilinear) on the detector grid.
The normalization sum for voxel is given by
| (19) |
Finally, the voxel values are calculated by summing over ,
| (20) |
Arbitrarily oriented 2D images with the final image slice width are obtained by using standard interpolation techniques for multiplanar reformation of the 3D image volume , see Ref. 4.
(c) Reconstruction of dual energy data. In a dual energy acquisition mode the two x-ray tubes (A) and (B) are operated at different tube voltages.10 As a consequence, the filtered data of detector (A) and of detector (B) can no longer be backprojected into the same 3D image volume, since they represent different attenuation values of the object, but have to be backprojected into separate 3D image volumes
| (21) |
The (B) image has to be restricted to the small SFOV with radius , since it is incomplete outside as a consequence of the weight function .
II.A.4. ECG-gated spiral (helical) image reconstruction
With retrospective ECG-gating, the heart volume is covered by a spiral (helical) scan. The patient’s ECG is recorded simultaneously to allow for a retrospective selection of the spiral (helical) data segments used for image reconstruction. To optimize temporal resolution, only scan data acquired in a predefined phase of the patient’s cardiac cycle (e.g., the mid to end diastolic phase) are used.18–20 The minimum data interval for reconstruction of an individual image, providing best possible temporal resolution, is (a halfscan sinogram) in parallel geometry. Due to the angular offset between both measurement systems, this halfscan sinogram can be obtained by appending two quarter scan sinograms that are simultaneously acquired by the two measurement systems in the same relative phase of the patient’s cardiac cycle and at the same anatomical level. This way, a temporal resolution of a quarter of the gantry rotation time (e.g., for gantry rotation time) is achieved for voxels close to the isocenter of the scanner. The temporal resolution is not constant, but depends on the position of the voxel within the SFOV and on the start angles of the data segments used for image reconstruction relative to this voxel. Temporal resolution may degrade for voxels away from the isocenter, but it may also improve. Details for a single source scanner are given in Ref. 33 and may be applied correspondingly to the dual source case.
We describe temporal rebinning and image reconstruction for ECG-gated single-segment reconstruction with DSCT data. An extension to multisegment reconstruction, in which each quarter scan segment is divided into smaller segments from different cardiac cycles of the patient, is straight forward, e.g., by using the methods described in Ref. 20 but beyond the scope of this article.
(a) Temporal rebinning and data selection. For both measurement systems (A) and (B), data intervals of length
| (22) |
in predefined phases of the patient’s cardiac cycle are used for image reconstruction. is the reconstruction data interval. is an additional data interval for smooth transition weighting of (A) and (B) data to avoid streak artifacts from data inconsistencies at the edges of the reconstruction data interval.
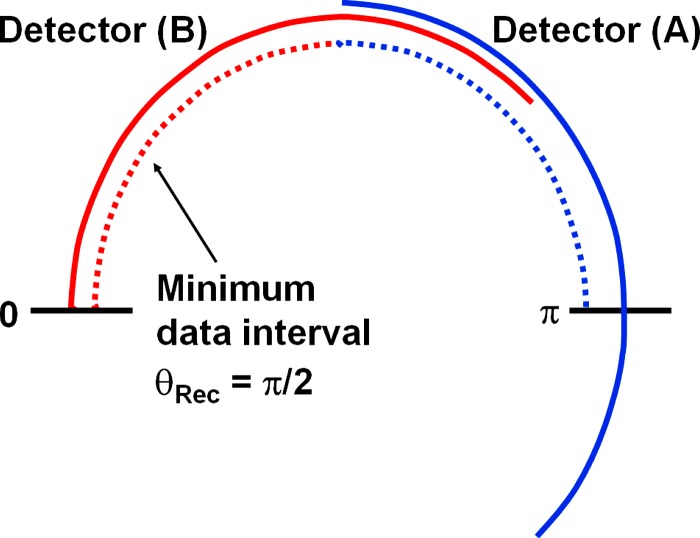
Due to the mechanical assembly, the minimum data interval providing best possible temporal resolution of a quarter of the gantry rotation time is in parallel geometry. However, a larger data range per measurement system can be used to accumulate radiation dose for obese patients, in this way trading off temporal resolution for reduced image noise, see Fig. 4. In this mode the overlapping data ranges of measurement systems (A) and (B) have to be adequately weighted in the 3D backprojection step.
FIG. 4.
Schematic illustration of data segments in parallel geometry used for ECG-synchronized DSCT image reconstruction. Due to the mechanical assembly, the minimum data interval per measurement system is in parallel geometry (indicated by dashed lines). The data interval for each measurement system can be increased (indicated by solid lines) to trade-off temporal resolution for dose accumulation in order to reduce the image noise for obese patients.
Assuming that both ECG-recording and scan data acquisition start at time , we obtain
| (23) |
is the gantry rotation time. In this notation, the positions of the focal spots of systems (A) and (B) are given by [see also Eq. (1)],
| (24) |
We assume that image reconstruction in the cardiac cycle uses a data interval that starts at time
| (25) |
(e.g., middiastole). is the time of the onset of R-wave in the patient’s ECG. is either a fixed temporal shift (e.g., reconstruction at after each R-wave) or a certain fraction of the patient’s cardiac cycle
| (26) |
(e.g., reconstruction at 60% of the patient’s RR-interval). The focus positions at are given by inserting into Eq. (24). and are the start angles (in parallel geometry) of the data segments of measurement systems (A) and (B) used for image reconstruction in cardiac cycle . As a consequence of the parallel rebinning [Eq. (4)], different fan beam projection angles acquired at different times contribute to each parallel projection . We determine the timestamps assigned to and in the iso-center of the scanner , where , see Eq. (4). Inserting into Eq. (23) we obtain
| (27) |
(b) Convolution and 3D backprojection. Once the data segments
| (28) |
are defined for all cardiac cycles , volume images are reconstructed from the respective data ranges of measurement systems (A) and (B). Note that each measurement systems typically contributes less than a halfscan sinogram to each voxel.
The convolution operation is identical to the standard spiral (helical) case, see Sec. II A 3.
For each voxel and for each projection angle , the following sum over all half turns of the spiral that illuminate this voxel is calculated:
| (29) |
Each projection angle belongs to a cardiac cycle which determines the choice of and and satisfies and , respectively. The angular weighting functions and ensure a smooth transition of the projection data of systems (A) and (B) in the combined volume image
| (30) |
Figure 5 shows , with , for [minimum data interval for best possible temporal resolution, no redundancy of (A) and (B) data] and for . Because [Eq. (27)], both data subsegments (A) and (B) add to a full half scan sinogram .
FIG. 5.
Angular weighting functions for both measurement systems (A) and (B) to ensure correct normalization and smooth data transition for ECG-synchronized DSCT image reconstruction. Left: Minimum data interval per measurement system to optimize temporal resolution. Right: Larger data interval per measurement system to accumulate dose and trade-off temporal resolution for reduced image noise.
is a smooth detector weighting function that assigns less weight to the outer detector rows with larger cone angle. Deviating from the standard spiral (helical) case [see Eq. (14)] no truncation of (B) data with weight is performed. Since each measurement system typically contributes less than a halfscan sinogram to each voxel, the (A) data are not necessarily complete outside the small scan field of view with radius , and the extrapolated (B) data are required to reconstruct a complete CT image. Due to the small pitch values of ECG-gated cardiac scans, the inconsistent filter direction across the (B) detector can be tolerated (see Sec. II A 3).
At any projection angle , several filtered projections and from different half turns of the spiral, and hence, from different cardiac cycles may contribute to voxel , depending on the patient’s heart rate and the spiral feed per rotation.
The normalization sum for voxel is given by
| (31) |
The voxel values are calculated by summing over ,
| (32) |
(c) Limitation of the table feed. Continuous volume coverage in retrospectively ECG-gated multislice spiral CT of the heart requires limitation of the spiral pitch depending on the patient’s heart rate. The maximum extension of the image stacks that can be reconstructed with data from one cardiac cycle is
| (33) |
In multiplanar reformations along the direction these image stacks are sometimes visible due to different concentrations of the iodine contrast agent or due to slight displacements of the heart from one cardiac cycle to the next as a result of irregular heart motion or suboptimal reconstruction phase.
Using
| (34) |
we immediately obtain from Eq. (24),
| (35) |
is the patient’s RR-cycle length. Following Eq. (35), the table feed can be efficiently adapted to the patient’s heart rate and significantly increased at elevated heart rates, thereby not only reducing examination time, but also radiation dose to the patient.10 The actual pitch for a particular scan is calculated assuming a confidence interval of that the heart rate of the patient is allowed to drop during examination. With a single source CT, the pitch can in general not be increased at higher heart rates because multisegment reconstruction is used to improve temporal resolution.
Typically, with properly adjusted spiral pitch, only data from one cardiac cycle will contribute to the image for positions close to the center of an image stack , while data from two cardiac cycles and may contribute to the image for positions close to the boundaries of the image stacks. The choice of the smoothing parameter in the detector weighting function [see Eqs. (29) and (17)] affects the relative contribution of the rays from cardiac cycles and for , both rays contribute with equal weight, for , the relative weight of the ray closer to the detector center is dominating. Hence, by adjusting , a more or less sharp transition between two image stacks can be established.
II.A.5. ECG-triggered axial image reconstruction
To further reduce the radiation dose to the patient, prospectively ECG-triggered axial scan and reconstruction techniques have recently been re-introduced for coronary CT angiographic examinations.21 Prospective ECG-triggering combined with “step-and-shoot” data acquisition is the most dose-efficient way of ECG-synchronized scanning as only the very minimum of scan data needed for image reconstruction is acquired in the previously selected heart phase. As a drawback, reconstruction of images in different phases of the cardiac cycle for functional evaluation is not possible, and the method encounters its limitations for patients with arrhythmia, since ECG-triggered axial scanning depends on a reliable prediction of the patient’s next RR-interval by analyzing the preceding RR-intervals.
Image reconstruction for ECG-triggered axial data acquired with a DSCT is very similar to ECG-gated spiral (helical) reconstruction. In each cardiac cycle, axial scan data intervals
| (36) |
are acquired. Note that due to the necessary data completion for measurement system (B) (see Sec. II A 2), measurement system (A) has to start data acquisition a quarter rotation earlier than measurement system (B). Convolution and 3D-backprojection of the axial data are performed as described in Sec. II A 4, except that the formula for the detector coordinates of the rays which hit voxel simplifies to
| (37) |
[Equation (37) is obtained from Eq. (15), which describes the spiral (helical) case, by setting is then the position of the current axial scan. Note that similar to spiral (helical) scanning, axial data from one cardiac cycle will contribute to the image for positions close to the center of an image stack , while data from two cardiac cycles and may contribute to the image for positions close to the boundaries of the image stacks, if the table increment between two axial scans is smaller than the detector width. As a consequence of 3D backprojection a 3D image volume is the primary outcome for axial scans, too, and arbitrarily oriented 2D images with the final image slice width can be obtained by means of standard interpolation techniques.
II.B. Evaluation of the image reconstruction
We performed simulation studies and phantom measurements to evaluate the proposed approaches for data completion and image reconstruction. Furthermore, we used ECG-gated patient data to demonstrate the influence of the reconstruction parameter on the transition between image stacks acquired in different cardiac cycles.
II.B.1. Evaluation of data extrapolation and combined 3D backprojection both for standard and ECG-gated spiral (helical) image reconstruction
We used simulated CT raw data of an anthropomorphic thorax phantom to assess the image quality obtained after extrapolation of the truncated (B) data and simultaneous 3D backprojection of both (A) and (B) data as described in Sec. II A. The phantom data were generated with the CT-simulation tool “DRASIM;”22 this is a computer program which allows simulation of transmission data based on a narrow beam assumption. The simulated object is constructed from a combination of geometric primitive objects, such as spheres, ellipsoids, cylinders, or cones, which can be made time (projection number) dependent to incorporate object motion into the simulation. For each ray, both the focus size and the detector aperture can be oversampled, and motion of the focal spot on the anode plate, e.g., in case of a flying focal spot, can be exactly reproduced. If necessary, the polychromatic nature of the x-ray beam can be taken into account. We simulated CT raw data for the geometry of the evaluated DSCT system, in a 64-slice acquisition mode with detector collimation and flying focal spot for both measurement systems. The true geometrical sizes of focal spot and detector elements were taken into account. Poisson-distributed, attenuation-dependent data noise corresponding to a CT scan with , per rotation, rotation time was added to both (A) and (B) data. We did not include cross-scattered radiation into our simulation to separate the effects of data extrapolation and combined 3D backprojection from potential cross-scatter artifacts. We simulated data both for a standard spiral at pitch 0.8 and 1.4, and for an ECG-gated spiral at pitch 0.3, assuming an artificial ECG at .
Images of the thorax phantom for the standard (non ECG-gated) spiral were reconstructed in four different ways:
-
•
using (A) data only (corresponding to a single-source CT system with SFOV),
-
•
using both (A) and (B) data without extrapolation of the truncated (B) data,
-
•
using both (A) and (B) data with extrapolation of the truncated (B) data as described in Sec. II A 2, but without truncation of the extrapolated (B) data after convolution at the boundaries of the small SFOV , and
-
•
using both (A) and (B) data with extrapolation of the truncated (B) data and truncation of the extrapolated (B) data after convolution at the boundaries of the small SFOV, as described in Sec. II A 3.
We reconstructed slices in a FOV. We used a medium-smooth body kernel (B30) for reconstruction and measured the standard deviation of the CT numbers in a central region of interest (ROI) and in two peripheral ROIs inside and outside the small SFOV of detector (B), to assess the effect of the added (B) data on homogeneity and image noise.
In addition, we scanned a centered water phantom in a standard (non-ECG-gated) spiral mode, both in a single source mode using (A) data only and in a dual source mode using (A) and (B) data with extrapolation of the truncated (B) data and truncation of the extrapolated (B) data after convolution at the boundaries of the small SFOV. The scan parameters of the DSCT system were: gantry rotation, collimation with flying focal spot, pitch . We used and per rotation for tube (A) in the single source mode, and and per rotation both for tube (A) and tube (B) in the dual source mode. We reconstructed images with slice width and increment using the standard body kernel B30. To quantitatively evaluate the effect of the added (B) data we measured image noise as a function of the distance from the isocenter using small ROIs with diameter, both for the single source images and for the dual source images .
To evaluate the properties of the ECG-gated dual source spiral, we reconstructed images of the computer simulated anthropomorphic thorax phantom:
-
•
using both (A) and (B) data with extrapolation of the truncated (B) data, but without truncation of the extrapolated (B) data after convolution at the boundaries of the small SFOV, as described in Sec. II A 4.
In this case, we reconstructed data for , , and [see Secs. II A 4(a) and II A 4(b)], to evaluate the anticipated dose accumulation in the images due to the increased reconstruction range per measurement system.
II.B.2. Evaluation of through-plane (z-axis) spatial resolution for ECG-gated spiral image reconstruction as a function of heart rate and pitch
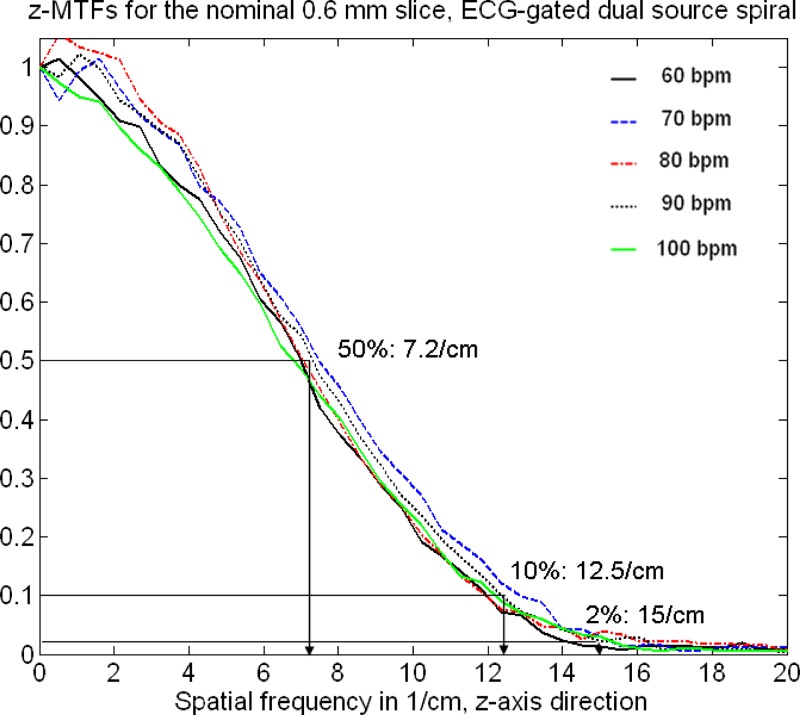
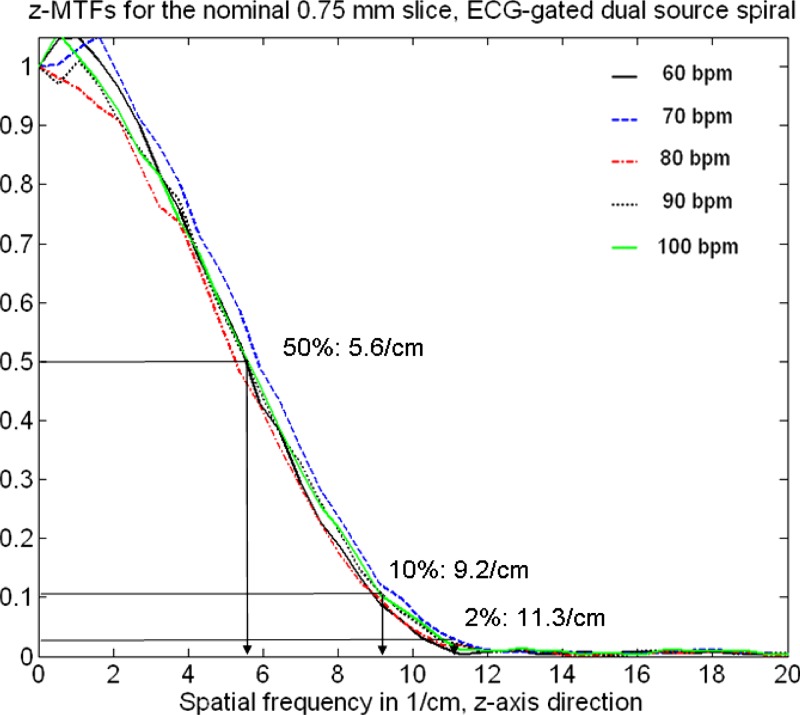
Using the evaluated DSCT system we scanned a thin gold plate ( thick) embedded in a Lucite cylinder to determine spiral slice sensitivity profiles (SSPs) obtained with the proposed ECG-gated spiral (helical) image reconstruction with adaptation of the pitch to the patient’s heart rate as described in Sec. II A 4.(c). We placed the gold plate close to the isocenter of the scanner and performed ECG-gated spiral (helical) scans with collimation in a 64-slice acquisition mode with -flying focal spot for both measurement systems, using artificial ECG-signals with 60, 70, 80, 90, and 100 bpm and the correspondingly adapted pitch values ( 0.32, 0.37, 0.43, and 0.46, respectively). Other scan parameters were: gantry rotation time, , per rotation for each x-ray tube. We reconstructed highly overlapping images with 0.6 and nominal slice width at an increment of , using single-segment reconstruction as proposed in Sec. II A 4. The reconstruction range was large enough to fully cover the gold plate, i.e., in the first and in the last image the gold plate had completely disappeared and only the Lucite cylinder was visible. For each of the overlapping images, the mean CT value in a small region of interest within the gold plate was determined, and the “background” CT value (CT value of the Lucite cylinder without gold plate) was subtracted. The maximum of these corrected mean values (with the gold plate fully in the reconstructed slice) was normalized to 1. The normalized mean values, plotted as a function of the positions of the respective image slices, represent the measured SSP. The FWHM of this SSP is the measured slice width. In addition, we performed Fourier transforms of the measured SSPs to evaluate the modulation transfer functions (MTFs) in the direction.
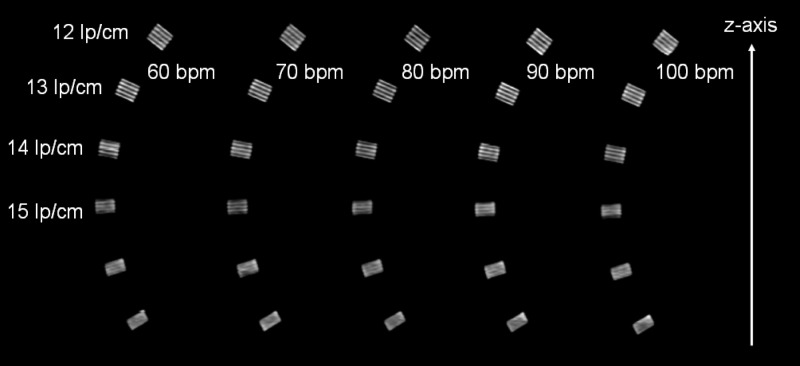
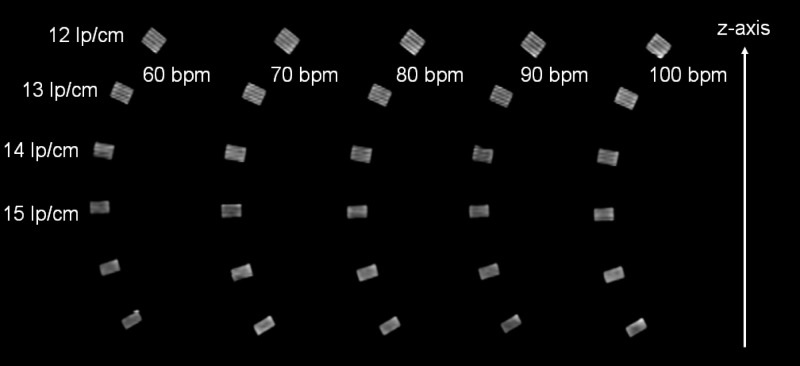
For a visual evaluation of through-plane (-axis) spatial resolution as a function of the patient’s heart rate we scanned the high-resolution insert of the CATPHAN (The Phantom Laboratories, Salem, NY) in the proposed ECG-gated spiral (helical) mode with scan parameters as described above, except that each x-ray tube was operated at per rotation. We turned the high-resolution insert by 90° and aligned the bar patterns in a way that the grids with 12, 13, 14, 15, and , corresponding to 0.42, 0.38, 0.36, 0.33, and resolution, were roughly perpendicular to the direction. The phantom was placed at the isocenter of the scanner. We reconstructed images with the high-resolution cardiac kernel B46. The reconstruction slice width was both 0.6 and with reconstruction increment. Through-plane (-axis) resolution was visually determined on multiplanar reformations (MPRs) in the direction by two experienced observers (TF, KS).
II.B.3. Evaluation of temporal resolution versus dose accumulation for ECG-gated spiral image reconstruction using a moving coronary artery phantom
We used a moving coronary artery phantom to evaluate the temporal resolution of ECG-gated spiral scanning and to show the effect of increasing on image noise and motion artifacts. The phantom consisted of a contrast-filled Lucite tube with a lumen of and an inserted coronary artery stent. The tube was immersed in a water bath and moved in a periodic manner by a computer-controlled robot arm at an angle of 45° relative to the scan plane to simulate heart motion, see Fig. 6. The motion amplitudes and velocities of the robot arm were based on published values for the coronary arteries.23 We used a motion pattern with rest phase at a heart rate of , and reconstructed the phantom data for (expected temporal resolution ), (expected temporal resolution ), (expected temporal resolution ), (expected temporal resolution ), and (expected temporal resolution ). Scan parameters of the DSCT system were: , per rotation for each x-ray tube, gantry rotation, collimation with flying focal spot for both measurement systems, and pitch . We reconstructed images with slice width and increment using the high-resolution kernel B46. We assessed motion artifacts by visual inspection of both axial images and MPRs, and we measured the image noise as standard deviation in a central ROI.
FIG. 6.
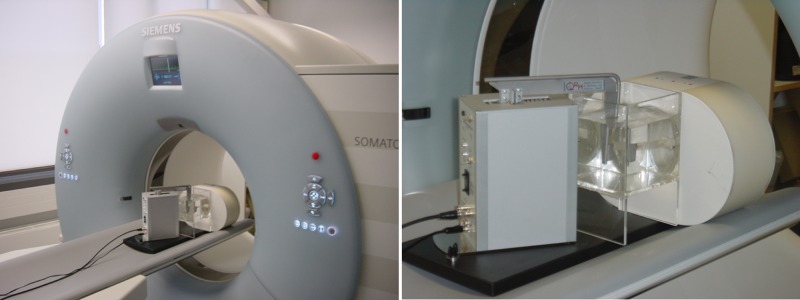
Computer-controlled robot arm moving a tube filled with contrast agent (“coronary artery”) in a water tank. The motion amplitudes and velocities of the robot arm can be adjusted to provide a realistic motion pattern of the tube.
II.B.4. Evaluation of the influence of the reconstruction parameter on the transition between image stacks in cardiac CT
We used scan data of patients referred for clinically indicated ECG-gated spiral coronary CTA to demonstrate how the smoothing parameter in the detector weighting function [see Eq. (17)] can be used to control the smoothness of the transition between image stacks acquired in subsequent heart cycles. The scan parameters were: , per rotation for each x-ray tube, gantry rotation, collimation with -flying focal spot for each detector. The spiral pitch was adjusted to the patient’s heart rate according to Eq. (35), with a safety margin of . We reconstructed slices at increment with the medium-smooth convolution kernel B30.
III. Results
III.A. Image quality with data extrapolation and combined 3D backprojection
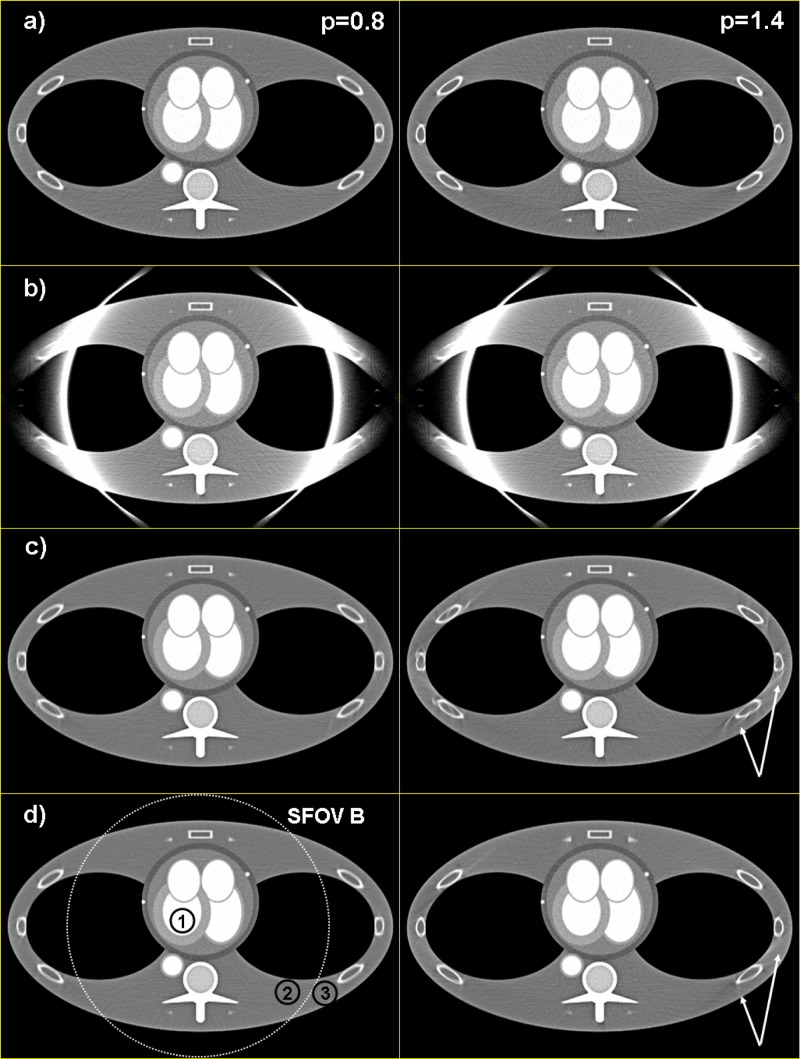
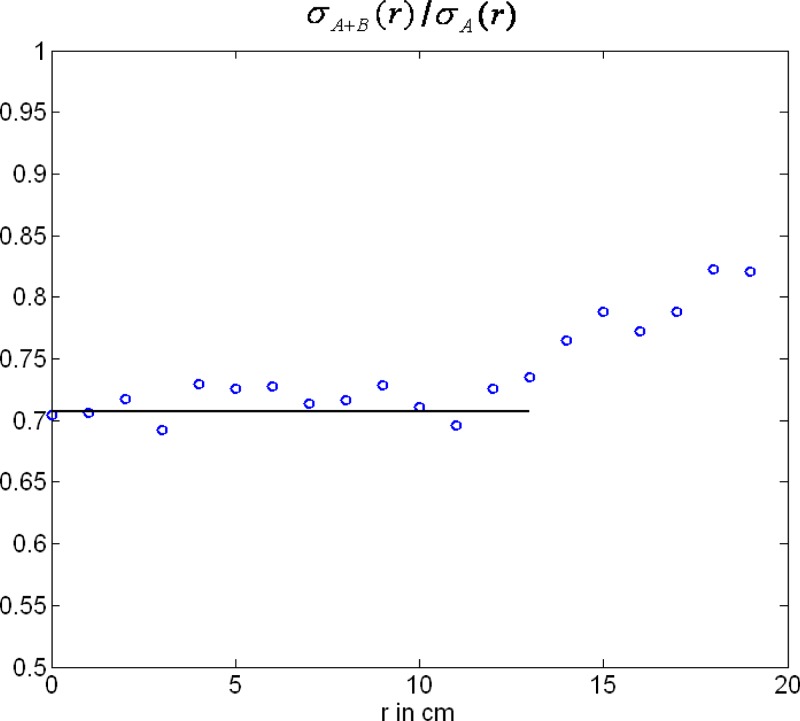
Figures 7 and 8 show standard spiral reconstructions of the anthropomorphic thorax phantom at pitch (left) and (right). Figure 7 shows the full FOV of , and Figure 8 shows a detail reconstruction. The reference images in Figs. 7(a) and 8(a) were obtained by using data from measurement system (A) only, corresponding to a single source CT scanner with collimation and -flying focal spot. For the images shown in Figs. 7(b) and 8(b) both (A) and (B) data were simultaneously backprojected into the same 3D volume as proposed in Sec. II A 3(b). The truncated (B) data were not extrapolated, as a consequence the images suffer from severe truncation artifacts at the boundary of the small SFOV with diameter. Figures 7(c) and 8(c) show the result after extrapolation of the (B) data as proposed in Sec. II A 2, but without truncation of the extrapolated (B) data after convolution. The cone-beam artifacts at the ribs are a result of the inconsistent filter direction of the (B) data. Since the deviation from the proper filter direction increases with increasing pitch, cone-beam artifacts are worse at pitch 1.4 than at pitch 0.8. Truncation of the (B) data after convolution significantly reduces cone-beam artifacts, see Figs. 7(d) and 8(d). Note the lower image noise level compared to the single source reference images 7(a) and 8(a), also outside the small SFOV, due to dose accumulation by using both (A) and (B) data for image reconstruction. In ROIs 1, 2, and 3 (see Fig. 7) image noise is reduced from 21.0, 16.5, and 15.1 HU in the single source image [Fig. 7(a)] to 14.5, 12.4, and 10.8 HU, respectively, in the dual source image [Fig. 7(d)]. This corresponds to a relative noise reduction from 1 to 0.69, 0.75, and 0.72, respectively, which is in good agreement with the theoretical value expected for the accumulation of two CT raw data sets at equal mA s. While image pixels outside the small SFOV, but closely adjacent to the boundary, receive contributions from the truncated (B) data for nearly a full rotation, the contribution of the (B) data—and hence, dose accumulation—decreases with increasing distance of the pixels from the boundary. This is quantitatively demonstrated by noise measurements in a centered waterphantom. In Fig. 9 the ratio of the standard deviation of the image noise using (A) and (B) data with truncation of the extrapolated (B) data after convolution, and using (A) data only is shown as a function of the distance from the isocenter. As expected, for . For , increases monotonically as a consequence of decreasing contribution of the (B) data. Nevertheless, even at , the ratio is still 0.85, indicating that about 38% of the (B) data contribute to the image at this distance from the isocenter.
FIG. 7.
Spiral reconstructions of the anthropomorphic thorax phantom at pitch (left) and (right), . (a) Reconstruction using (A) data only. (b) Simultaneous 3D backprojection of (A) and (B) data without extrapolation of the truncated (B) data. Note the severe truncation artifacts at the boundary of the small SFOV. (c) Simultaneous 3D backprojection of (A) and (B) data with extrapolation of the truncated (B) data, but without truncation of the extrapolated (B) data after convolution. Cone-beam artifacts (arrows) are a result of the inconsistent filter direction of the (B) data. (d) Simultaneous 3D backprojection of (A) and (B) data with extrapolation of the truncated (B) data and truncation of the extrapolated (B) data after convolution. Cone-beam artifacts are significantly reduced. The ROIs 1, 2, and 3 were used to measure image noise.
FIG. 8.
Spiral reconstructions of the anthropomorphic thorax phantom at pitch (left) and (right), detail. For (a), (b), (c), and (d) see Fig. 7.
FIG. 9.
Relative image noise reduction in a water phantom obtained by simultaneously backprojecting both the (A) data and the truncated (B) data. Ratio of the standard deviation of the image noise using (A) and (B) data with truncation of the extrapolated (B) data after convolution, and using (A) data only as a function of the distance from the isocenter. The solid line represents the theoretically expected value for .
Figure 10 shows ECG-gated spiral reconstructions of the stationary anthropomorphic thorax phantom at pitch assuming an artificial ECG at , for , , and . The (B) data were not truncated after convolution, to always provide a complete CT-halfscan data set outside the small SFOV [e.g., note that for detector (A) only contributes a quarter rotation outside the small SFOV, and its data have to be complemented by extrapolated (B) data]. In this case, the intensity of cone-beam artifacts decreases with increasing , but at the expense of compromised temporal resolution.
FIG. 10.

ECG-gated spiral (helical) reconstructions of the stationary anthropomorphic thorax phantom at pitch , assuming an artificial ECG at , for , , and . Cone-beam artifacts decrease with increasing , but temporal resolution is then compromised.
Measured relative noise values in ROI 1 are 1, 0.87, and 0.75, for , , and , respectively. This corresponds well to the theoretical values 1, 0.86, and 0.73, obtained by integrating the squared detector-weighting functions and (see Fig. 5) as a function of , and calculating the square root of the sum of both integrals.
III.B. Through-plane (-axis) spatial resolution for ECG-gated spiral image reconstruction
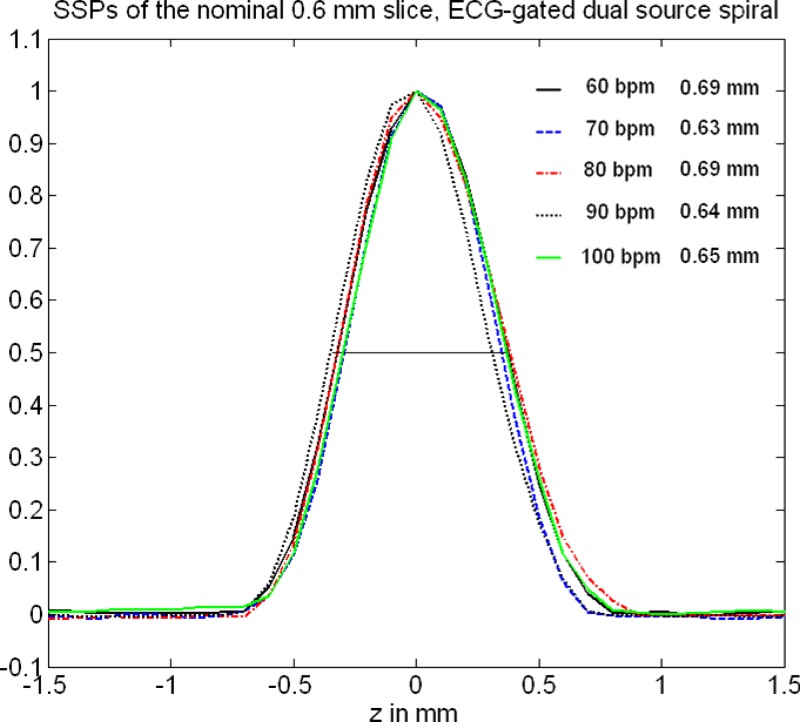
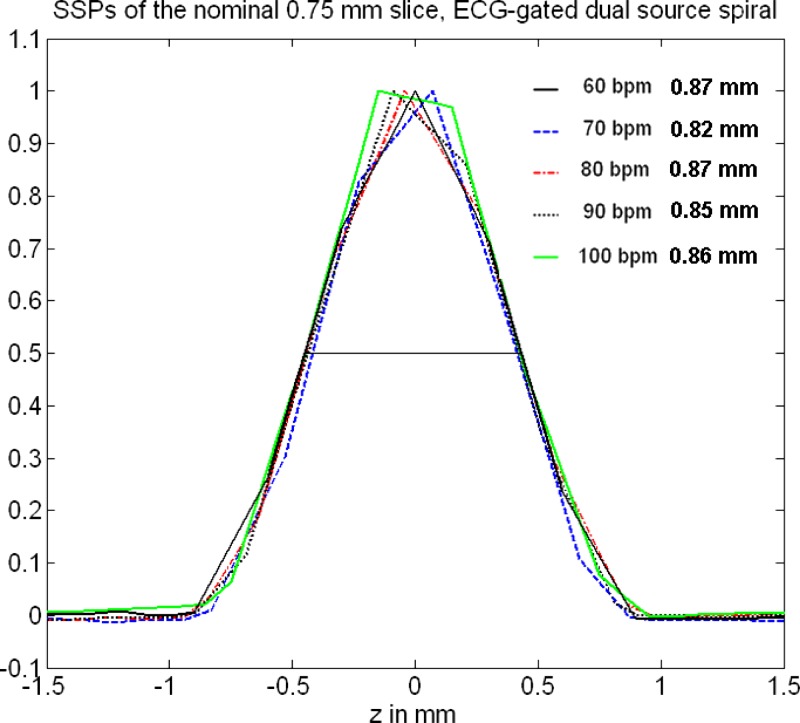
Figures 11 and 12 show measured SSPs (at the isocenter) of the nominal 0.6 and slices as a function of the “heart rate” of an artificial ECG at 60, 70, 80, 90, and 100 bpm with the correspondingly adapted pitch values , 0.32, 0.37, 0.43, and 0.46, respectively, using ECG-gated spiral (helical) image reconstruction. The SSPs are symmetrical, bell-shaped curves that are almost independent of the patient’s heart rate. The slice in particular is well-defined and compact. The measured FWHMs range from for the nominal slice and from for the nominal slice. Figures 13 and 14 show the Fourier transforms of the measured SSPs at various heart rates, which are the MTFs in the direction. The 2% value of the -MTF for the nominal slices is about , hence, it can be expected that high-contrast objects down to in size should be separable in the through-plane direction, provided the radiation dose is sufficient. The average 2% value of the -MTFs for the nominal slices is about , corresponding to an object size of in the through-plane direction.
FIG. 11.
Measured SSPs (at the isocenter) of the nominal slice as a function of the heart rate of an artificial ECG at 60, 70, 80, 90, and 100 bpm with the correspondingly adapted pitch values , 0.32, 0.37, 0.43, and 0.46, respectively, using dual source acquisition and ECG-gated spiral (helical) image reconstruction. The indicated slice widths are the FWHMs of the SSPs.
FIG. 12.
Measured SSPs (at the isocenter) of the nominal slice as a function of the heart rate of an artificial ECG at 60, 70, 80, 90, and with the correspondingly adapted pitch values , 0.32, 0.37, 0.43, and 0.46, respectively, using dual source acquisition and ECG-gated spiral (helical) image reconstruction. The indicated slice widths are the FWHMs of the SSPs.
FIG. 13.
Fourier transforms of the measured SSPs of the nominal slice (see Fig. 11) at various heart rates. The SSPs were obtained by using dual source acquisition and ECG-gated spiral (helical) image reconstruction. The Fourier transforms are the MTFs in the direction.
FIG. 14.
Fourier transforms of the measured SSPs of the nominal slice (see Fig. 12) at various heart rates. The SSPs were obtained by using dual source acquisition and ECG-gated spiral (helical) image reconstruction. The Fourier transforms are the MTFs in the direction.
Figures 15 and 16 show MPRs of the z-resolution phantom (high-resolution insert of the CATPHAN, turned by 90°) at (Fig. 15) and at (Fig. 16) nominal reconstruction slice width, again as a function of the heart rate of an artificial ECG at 60, 70, 80, 90, and with the correspondingly adapted pitch values 0.32, 0.37, 0.43, and 0.46, respectively. The -resolution phantom was placed at the isocenter of the DSCT scanner. As predicted by the analysis of the -MTFs, the bar patterns with are visible at slice width, which corresponds to object size that can be resolved in the through-plane direction independent of the heart rate. Through-plane resolution in ECG-gated spiral (helical) DSCT scanning is not affected by the increased pitch at higher heart rates according to Eq. (35). At slice width, the bar patterns with can still be separated. They are tilted by about 30°, and we conclude that the true resolution is , corresponding to objects of about in size that can be differentiated.
FIG. 15.
MPRs of the -resolution phantom at nominal reconstruction slice width, as a function of the heart rate of an artificial ECG at 60, 70, 80, 90, and with the correspondingly adapted pitch values , 0.32, 0.37, 0.43, and 0.46, respectively. Independent of the heart rate, the bar patterns with are visible, which corresponds to object size. This result is in good agreement with the evaluation of the -MTFs, see Fig. 13.
FIG. 16.
MPRs of the -resolution phantom at nominal reconstruction slice width. Independent of the heart rate, the bar patterns with are visible, corresponding to about true resolution due to the 30° angle of the bar-patterns. Hence, objects of about in size can be differentiated. This result is in good agreement with the evaluation of the -MTFs, see Fig. 14.
III.C. Temporal resolution versus dose accumulation for ECG-gated spiral image reconstruction
Figure 17 shows axial images and MPRs of the moving coronary artery phantom for various choices of the reconstruction data interval per measurement system , ranging from to . At , corresponding to the best possible temporal resolution of , the contrast filled tube with inserted stent is visually free of motion artifacts, due to its rest phase of . With increasing , image noise decreases at the expense of temporal resolution, resulting in increased blurring and double contours of the moving phantom. In Table I the measured relative noise values in a centered ROI (see Fig. 17 left) are listed as a function of , together with theoretical values obtained by integrating the squared detector weighting functions and as a function of , and calculating the square root of the sum of both integrals. Measured and theoretically expected noise values are in good agreement, similar to the evaluation of computer simulated data in Sec. III A.
FIG. 17.
Axial images and MPRs of the moving coronary artery phantom for various choices of the reconstruction data interval per measurement system. With increasing , image noise is reduced, but at the expense of temporal resolution. ROI 1 was used for image noise measurements.
TABLE I.
Temporal resolution, measured and theoretically expected relative noise values for ECG-gated spiral (helical) DSCT image reconstruction, as a function of .
| Data interval | |||||
|---|---|---|---|---|---|
| Temporalresolution(ms) | 83 | 105 | 125 | 145 | 165 |
| Relative noisemeasured | 1 | 0.94 | 0.85 | 0.76 | 0.72 |
| Relative noisecalculated | 1 | 0.94 | 0.86 | 0.78 | 0.73 |
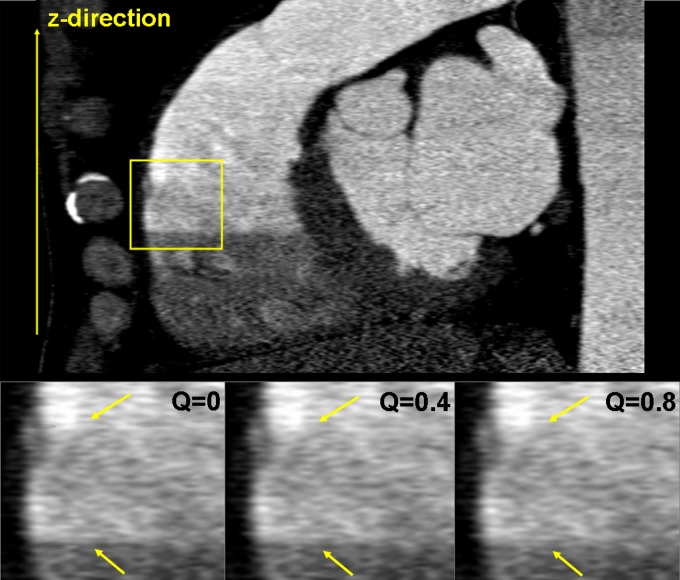
III.D. Influence of the reconstruction parameter on the transition between image stacks in cardiac CT
Figure 18 shows a MPR of a DSCT coronary angiographic patient examination. Due to suboptimal bolus timing, an abrupt change of the contrast density between two heart cycles can be observed (see the yellow box). The smoothing parameter in the detector weighting function [see Eqs. (29) and (17)] is a means to control the smoothness of the transition between image stacks acquired in different cardiac cycles. Close to the boundaries of those image stacks, rays from two subsequent cardiac cycles may contribute to the image. For the weight of both rays is equal and the transition is very smooth, which is beneficial to avoid stair-step artifacts, but can also cause blurring due to a potential superposition of inconsistent data in case of motion or varying density of the contrast agent. As approaches 0, the relative weight of the ray closer to the detector center is dominating, and the transition is more pronounced, see Fig. 18 for , 0,4 and 0.8. Clinical practice suggests the choice of or for ECG-gated spiral scanning and of for ECG-triggered sequential scanning with 10% overlap between the individual axial scans.
FIG. 18.
MPR of a DSCT coronary angiographic patient examination for various values of the smoothing parameter , which controls the smoothness of the transition between image stacks acquired in different cardiac cycles, see the arrows. As approaches 0, the transition is more pronounced (image courtesy of Dr. J. Hausleiter, German Heart Center, Munich).
IV. Discussion and Conclusion
DSCT scanners equipped with two x-ray tubes and two corresponding detectors offer flexible modes of operation and various options to combine the acquired data. As a drawback, one detector (B) can only cover a reduced SFOV to keep the system design compact. We have shown that extrapolation of the (B) data by using (A) data acquired a quarter rotation earlier or later is sufficient to solve the resulting data truncation problem. A unified framework can be used for convolution (filtering) and simultaneous 3D backprojection of both (A) and (B) data, with similar treatment of standard spiral, ECG-gated spiral, and sequential (axial) scan data. Special attention has to be paid to ensure the correct filter direction along the spiral tangent for both detectors, requiring truncation of the extrapolated (B) data after convolution in case of standard spiral (helical) scans with high pitch up to 1.5. We have shown that simultaneous 3D backprojection of the filtered (A) data and the truncated filtered (B) data into the same 3D image volume results in good image quality and dose accumulation as theoretically expected. In ECG-gated spiral (helical) reconstructions, both measurement systems typically contribute less than a half-scan segment in parallel geometry, and the extrapolated (B) data cannot be truncated after convolution to provide a complete halfscan sinogram outside the small SFOV.
Due to the -flying focal spot technique that is applied to both measurement systems, a through-plane (-axis) spatial resolution of for slice width and for slice width can be achieved with the evaluated DSCT scanner. In ECG-gated spiral (helical) modes, SSPs and through-plane resolution are almost independent of the patient’s heart rate if the spiral pitch is properly adapted. Thanks to a flexible choice of the data interval per measurement system in ECG-controlled CT reconstructions, temporal resolution can be traded-off for dose accumulation and reduced image noise, which is beneficial for the examination of obese patients at low to moderate heart rates. We have verified the theoretically expected temporal resolution of by blur free images of a moving coronary artery phantom with rest phase. Experimental evidence for the temporal resolution in cardiac DSCT has also been given in Ref. 24
Meanwhile, several clinical studies have demonstrated the potential of DSCT to accurately rule out significant coronary artery stenoses with little or no dependence on the patient’s heart rate.25–30
Another interesting application of DSCT is the acquisition of dual energy CT data, by independently operating x-ray tubes (A) and (B) at different tube voltages, e.g., 80 and . The acquisition of dual energy data can, in principle, add functional information to the mere morphological information based on different x-ray attenuation coefficients that is usually obtained in a CT examination. Due to different attenuation mechanisms (mainly photoeffect and Compton effect) with different dependence on the x-ray energy and on the atomic number , many materials show a characteristic change of attenuation in CT scans at different tube voltages. Even if two materials, such as bone and iodine filled vessels, show identical absorption at one tube voltage (e.g., ) and thus identical CT numbers in the corresponding CT image, they may show different absorption at the other tube voltage (e.g., ) and can thus be separated. While dual energy CT was initially evaluated ago,11,12 technical limitations of the CT scanners at those times prevented the development of relevant clinical applications. Details of the dual energy algorithms used in the evaluated DSCT-scanner can be found in. Ref. 13 Dual-energy acquisition can support the differentiation of iodine filled vessels and bone for automatic bone removal in CT angiographic studies, in particular in complex anatomical situations. Dual energy helps to characterize certain tissues in the human body, such as kidney stones14,31,32 or tendons and ligaments. Dual energy CT may be capable of visualizing and quantifying the local iodine uptake in tissues as a measure for the local blood supply. Potential applications of this technique comprise visualization of the iodine uptake in the lung parenchyma to evaluate perfusion defects in the lung, e.g., as a consequence of pulmonary embolism, tumor characterization, or quantification of myocardial enhancement to determine the myocardial blood volume,15 which so far has been reserved to other modalities. Clinical research is currently ongoing to evaluate the clinical potential of DSCT, and of dual energy CT in particular.13–15,30–32
REFERENCES
- 1.Klingenbeck-Regn K., Schaller S., Flohr T., Ohnesorge B., Kopp A. F., and Baum U., “Subsecond multi-slice computed tomography: Basics and applications,” Eur. J. Radiol. 10.1016/S0720-048X(99)00086-831, 110–124 (1999). [DOI] [PubMed] [Google Scholar]
- 2.McCollough C. H. and Zink F. E., “Performance evaluation of a multi-slice CT system,” Med. Phys. 10.1118/1.59877726, 2223–2230 (1999). [DOI] [PubMed] [Google Scholar]
- 3.Hu H., He H. D., Foley W. D., and Fox S. H., “Four multidetector-row helical CT: Image quality and volume coverage speed,” Radiology 215, 55–62 (2000). [DOI] [PubMed] [Google Scholar]
- 4.Flohr T., Stierstorfer K., Bruder H., Simon J., Polacin A., and Schaller S., “Image reconstruction and image quality evaluation for a 16-slice CT scanner,” Med. Phys. 10.1118/1.156216830(5), 832–845 (2003). [DOI] [PubMed] [Google Scholar]
- 5.Flohr T. G., Stierstorfer K., Ulzheimer S., Bruder H., Primak A. N., and McCollough C. H., “Image reconstruction and image quality evaluation for a 64-slice CT scanner with z-flying focal spot,” Med. Phys. 10.1118/1.194978732(8), 2536–2547 (2005). [DOI] [PubMed] [Google Scholar]
- 6.Halliburton S. S., Stillman A. E., Flohr T., Ohnesorge B., Obuchowski N., Lieber M., Karim W., Kuzmiak S., Kasper J. M., and White R. D., “Do segmented reconstruction algorithms for cardiac multi-slice computed tomography improve image quality?,” Herz 28(1), 20–31 (2003). [DOI] [PubMed] [Google Scholar]
- 7.Greuter M. J. W., Flohr T., van Ooijen P. M. A., and Oudkerk M.,” A model for temporal resolution of multidetector computed tomography of coronary arteries in relation to rotation time, heart rate and reconstruction algorithm,” Eur. Radiol. 17(3), 784–812 (2007). [DOI] [PubMed] [Google Scholar]
- 8.Robb R. and Ritman E., “High speed synchronous volume computed tomography of the heart,” Radiology 133, 655–661 (1979). [DOI] [PubMed] [Google Scholar]
- 9.Ritman E., Kinsey J., Robb R., Gilbert B., Harris L., and Wood E., “Three-dimensional imaging of heart, lungs, and circulation,” Science 10.1126/science.7423187210, 273–280 (1980). [DOI] [PubMed] [Google Scholar]
- 10.Flohr T. G., McCollough C. H., Bruder H., Petersilka M., Gruber K., Süß C., Grasruck M., Stierstorfer K., Krauss B., Raupach R., Primak A. N., Küttner A., Achenbach S., Becker C., Kopp A., and Ohnesorge B. M., “First performance evaluation of a dual-source CT (DSCT) system,” Eur. Radiol. 16(2), 256–268 (2006). [DOI] [PubMed] [Google Scholar]
- 11.Kalender W. A., Perman W. H., Vetter J. R., and Klotz E., “Evaluation of a prototype dual-energy computed tomographic apparatus. I. Phantom studies,” Med. Phys. 10.1118/1.59595813(3), 334–339 (1986). [DOI] [PubMed] [Google Scholar]
- 12.Vetter J. R., Perman W. H., Kalender W. A., Mazess R. B., and Holden J. E., “Evaluation of a prototype dual-energy computed tomographic apparatus. II. Determination of vertebral bone mineral content,” Med. Phys. 10.1118/1.59595113(3), 340–343 (1986). [DOI] [PubMed] [Google Scholar]
- 13.Johnson T. R. C., Krauß B., Sedlmair M., Grasruck M., Bruder H., Morhard D., Fink C., Weckbach S., Lenhard M., Schmidt B., Flohr T., Reiser M. F., and Becker C. R., “Material differentiation by dual energy CT: Initial experience,” Eur. Radiol. 17(6), 1510–1517 (2007). [DOI] [PubMed] [Google Scholar]
- 14.Stolzmann P., Scheffel H., Rentsch K., Schertler T., Frauenfelder T., Leschka S., Sulser T., Marincek B., and Alkadhi H., “Dual-energy computed tomography for the differentiation of uric acid stones: Ex vivo performance evaluation,” Urol. Res. 10.1007/s00240-008-0140-x36, 133–138 (2008). [DOI] [PubMed] [Google Scholar]
- 15.Ruzsics B., Lee H., Zwerner P. L., Gebregziabher M., Costello P., and Schoepf U. J., “Dual-energy CT of the heart for diagnosing coronary artery stenosis and myocardial ischemia-initial experience,” Eur. Radiol. 18(11), 2414–2424 (2008). [DOI] [PubMed] [Google Scholar]
- 16.Feldkamp L. A., Davis L. C., and Kress J. W., “Practical cone-beam algorithm,” J. Opt. Soc. Am. A 10.1364/JOSAA.1.0006121, 612–619 (1984). [DOI] [Google Scholar]
- 17.Stierstorfer K., Rauscher A., Boese J., Bruder H., Schaller S., and Flohr T., “Weighted FBP—A simple approximate 3D FBP algorithm for multislice spiral CT with good dose usage for arbitrary pitch,” Phys. Med. Biol. 10.1088/0031-9155/49/11/00749, 2209–2218 (2004). [DOI] [PubMed] [Google Scholar]
- 18.Ohnesorge B., Flohr T., Becker C., Kopp A., Schoepf U., Baum U., Knez A., Klingenbeck K., and Reiser M., “Cardiac imaging by means of electrocardiographically gated multisection spiral CT—Initial experience,” Radiology 217, 564–571 (2000). [DOI] [PubMed] [Google Scholar]
- 19.Kachelriess M., Ulzheimer S., and Kalender W., “ECG-correlated image reconstruction from subsecond multi-slice spiral CT scans of the heart,” Med. Phys. 10.1118/1.128655227, 1881–1902 (2000). [DOI] [PubMed] [Google Scholar]
- 20.Flohr T. and Ohnesorge B., “Heart rate adaptive optimization of spatial and temporal resolution for ECG-gated multi-slice spiral CT of the heart,” J. Comput. Assist. Tomogr. 10.1097/00004728-200111000-0001425(6), 907–923 (2001). [DOI] [PubMed] [Google Scholar]
- 21.Hsieh J., Londt J., Vass M., Li J., Tang X., and Okerlund D., “Step-and-shoot data acquisition and reconstruction for cardiac x-ray computed tomography,” Med. Phys. 10.1118/1.236107833(11), 4236–4842 (2006). [DOI] [PubMed] [Google Scholar]
- 22.Stierstorfer K., “DRASIM: A CT-simulation tool,” Internal Report, Siemens Medical Engineering.
- 23.Achenbach S.et al. , “In-plane coronary arterial motion velocity: Measurement with electron beam CT,” Radiology 216, 457–463 (2000). [DOI] [PubMed] [Google Scholar]
- 24.McCollough C. H., Schmidt B., Yu L., Primak A., Ulzheimer S., Bruder H., and Flohr T. G., “Measurement of temporal resolution in dual source CT,” Med. Phys. 10.1118/1.282655935(2), 764–768 (2008). [DOI] [PMC free article] [PubMed] [Google Scholar]
- 25.Achenbach S., Ropers D., Kuettner A., Flohr T., Ohnesorge B., Bruder H., Theessen H., Karakaya M., Daniel W. G., Bautz W., Kalender W. A., and Anders K., “Contrast-enhanced coronary artery visualization by dual-source computed tomography—Initial experience,” Eur. J. Radiol. 57(3), 331–335 (2006). [DOI] [PubMed] [Google Scholar]
- 26.Scheffel H., Alkadhi H., Plass A., Vachenauer R., Desbiolles L., Gaemperli O., Schepis T., Frauenfelder T., Schertler T., Husmann L., Grunenfelder J., Genoni M., Kaufmann P. A., Marincek B., and Leschka S., “Accuracy of dual-source CT coronary angiography: First experience in a high pre-test probability population without heart rate control,” Eur. Radiol. 16(12), 2739–2747 (2007). [DOI] [PMC free article] [PubMed] [Google Scholar]
- 27.Johnson T. R., Nikolaou K., Busch S., Leber A. W., Becker A., Wintersperger B. J., Rist C., Knez A., Reiser M. F., and Becker C. R., “Diagnostic accuracy of dual-source computed tomography in the diagnosis of coronary artery disease,” Invest. Radiol. 42(10), 684–691 (2007). [DOI] [PubMed] [Google Scholar]
- 28.Leber A. W., Johnson T., Becker A., von Ziegler F., Tittus J., Nikolaou K., Reiser M., Steinbeck G., Becker C. R., and Knez A., “Diagnostic accuracy of dual-source multi-slice CT-coronary angiography in patients with an intermediate pretest likelihood for coronary artery disease,” Eur. Heart J. 10.1093/eurheartj/ehm29428(19), 2354–2360 (2007). [DOI] [PubMed] [Google Scholar]
- 29.Matt D., Scheffel H., Leschka S., Flohr T. G., Marincek B., Kaufmann P. A., and Alkadhi H., “Dual-source CT coronary angiography: Image quality, mean heart rate, and heart rate variability,” AJR, Am. J. Roentgenol. 189(3), 567–573 (2007). [DOI] [PubMed] [Google Scholar]
- 30.Ropers U., Ropers D., Pflederer T., Anders K., Kuettner A., Stilianakis N. I., Komatsu S., Kalender W., Bautz W., Daniel, W. G. , and Achenbach S., “Influence of heart rate on the diagnostic accuracy of dual-source computed tomography coronary angiography,” J. Am. Coll. Cardiol. 50(25), 2393–2398 (2002). [DOI] [PubMed] [Google Scholar]
- 31.Graser A., Johnson T. R., Bader M., Staehler M., Haseke N., Nikolaou K., Reiser M. F., Stief C. G., and Becker C. R., “Dual energy CT characterization of urinary calculi: Initial in vitro and clinical experience,” Invest. Radiol. 43(2), 112–119 (2008). [DOI] [PubMed] [Google Scholar]
- 32.Primak A. N., Fletcher J. G., Vrtiska T. J., Dzyubak O. P., Lieske J. C., Jackson M. E., J. C. Williams, Jr., and McCollough C. H., “Noninvasive differentiation of uric acid versus non-uric acid kidney stones using dual-energy CT,” Acad. Radiol. 14(12), 1441–1447 (2007). [DOI] [PMC free article] [PubMed] [Google Scholar]
- 33.Flohr T., Ohnesorge B., Bruder H., Stierstorfer K., Simon J., Suess C., and Schaller S., “Image reconstruction and performance evaluation for ECG-gated spiral scanning with a 16-slice CT system,” Med. Phys. 10.1118/1.159363730(10), 2650–2662 (2003). [DOI] [PubMed] [Google Scholar]


