Abstract
A simplified three-dimensional (3-D) zero-thickness shell model was developed to recover the non-spherical response of thick-shelled encapsulated microbubbles subjected to ultrasound excitation. The model was validated by comparison with previously developed models and was then used to study the mechanism of bubble break-up during non-spherical deformations resulting from the presence of a nearby rigid boundary. The effects of the shell thickness and the bubble standoff distance from the solid wall on the bubble break-up were studied parametrically for a fixed insonification frequency and amplitude. A diagram of bubble shapes versus the normalized shell thickness and wall standoff was derived, and the potential bubble shapes at break-up from reentrant jets were categorized resulting in four distinct zones.
I. INTRODUCTION
Encapsulated microbubbles formed of a gas core and an elastic shell have been used in medical applications of ultrasound for many years. The most established use of encapsulated microbubbles is with acoustic contrast agents used to enhance ultrasonic image quality (Becher and Burns, 2000). In addition, due to their inert properties under normal biological conditions and their reactive character when subjected to ultrasound excitation, there are rapidly emerging applications for thick shell microbubbles in targeted drug and gene delivery (Ferrara et al., 2007; Mayer and Bekeredjian, 2008; Song et al., 2002). In one design, the drug is suspended in a highly viscous thick liquid shell (Unger et al., 2002). The high viscosity stabilizes the encapsulated bubble and enables it to conserve its integrity until it reaches the specific target. Microbubble shape instabilities are then excited with an appropriate acoustic amplitude and frequency to result in microbubble shell break up and delivery of the drugs.
Several ways of using encapsulated microbubbles for targeted drug and gene delivery have been studied. One approach is to inject conventional ultrasound contrast agents and drug-containing vesicles simultaneously (Song et al., 2002; Price et al., 1998). Then a sufficiently strong ultrasound pulse is applied to the targeted area such that the contrast agents expand explosively and collapse violently near the cells and tissues to induce sonoporation, a temporary formation of pores on the cell membrane, and assist large molecule drug delivery from carriers to the interstitial tissue. An alternative approach is to incorporate the drug directly in the encapsulating layer shell of the microbubble (Unger et al., 2002; Chen et al., 2006; Hauff et al., 2005). When subjected to ultrasound excitation, the shell is forced to fragment and release the payload to the targeted area. Such drug-laden encapsulated microbubbles require a thick shell to increase the payload because the volume of the drug delivered by the microbubbles is relatively small compared to other means of drug delivery. A further improvement to the use of drug-laden encapsulated microbubbles is to attach a ligand that is targeted to a specific endothelial receptor (Tartis et al., 2006). This method allows the encapsulated microbubbles to adhere to the endothelial surface and thus increase local microbubble accumulation and targeted delivery.
However, sonoporation is therapeutic only when using low doses of ultrasound. An increase in the ultrasound intensity may result in cell death and other detrimental biological side effects. Therefore characterization and understanding of the fragmentation mechanisms of encapsulated microbubbles is pivotal to its use for drug delivery. Although many studies (Church, 1995; Allen et al., 2002; Marmottant et al., 2005; Sarkar et al., 2005) have investigated shell break-up of encapsulated microbubbles, they were limited to spherical models, and no 3-D deformations were included. From previous studies on bubble dynamics (Plesset and Chapman, 1971; Crum, 1979; Chahine, 1977, 1982; Blake and Gibson, 1987; Zhang et al., 1993; etc.), it is known that depending on its distance to nearby boundaries, an oscillating bubble may form a re-entrant jet during its collapse. A similar behavior is expected with encapsulated microbubbles, and micro-jetting and micro-streaming associated with violent non-spherical break-up have been hypothesized as mechanisms to enhance drug delivery (Miller, 2000). Understanding this phenomenon is particularly important for drug-laden microbubbles baring surface ligands to adhere to the endothelial surface because of their small stand-off from the tissue surface.
Hsiao et al. (2010) developed a 3-D numerical model based on a domain decomposition scheme to study the dynamics of thick liquid-shelled microbubbles. The computational domain was decomposed into inner domains composed of the shelled bubbles and an outer domain covering the host liquid medium. The inner domains are discretized and solved using an unsteady Navier–Stokes solver, 3DynaFS-Vis, while the flow field in the outer domain is solved using a boundary element method based potential flow solver, 3DynaFS-Bem. Both are sub-modules of our computational fluid dynamics (CFD) code 3DynaFS. This method best describes the dynamics of thick-shelled encapsulated microbubbles, but the solution and coupling of the two 3-D models comes with a high CPU computational cost. To reduce computational time without great loss of accuracy and enable parametric studies using the model, we present here a 3-D zero-thickness shell model. The approach replaces the shell thickness with an equivalent dilatational viscosity term in the boundary conditions. The results of the model are first compared to previously developed models and to the thick shell model to evaluate accuracy. This model is then used to study the mechanism of encapsulated microbubble break-up due to ultrasound excitation and resulting non-spherical bubble dynamics and deformations in the presence of a nearby rigid wall.
II. ENCAPSULATED MICROBUBBLES 3-D MODEL
A. Problem definition
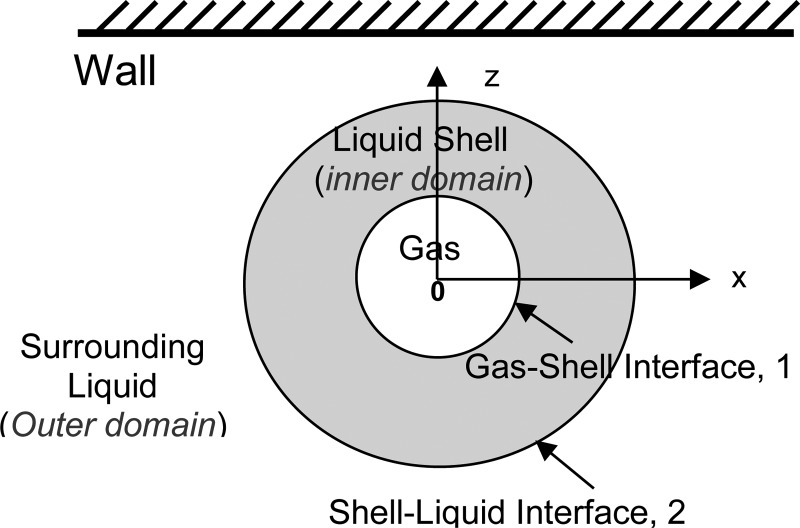
Consider the response of encapsulated microbubbles to ultrasound acoustic waves when the bubble is excited near a solid boundary. Due to the proximity of the boundary and to the interaction with other bubbles, the problem is fully three-dimensional, and a spherical model is inadequate. For a single bubble, the computational domain for this problem, as illustrated in Fig. 1 can be decomposed into three regions: The region of the compressible gas in the bubble, an inner liquid domain for the highly viscous liquid shell around the bubble gas core, and an outer liquid domain for the host liquid medium bounded by a solid wall. As summarized in the subsections in the following text, in the general 3-D finite-thickness shell model (Hsiao et al., 2010), the flow field within the shell layer is solved using the unsteady Navier–Stokes equations, while the flow field in the outer domain, which is much less viscous, is solved with a boundary element method assuming a potential flow. In the present zero-thickness shell model, a thin-shell approximation will be used to condense the liquid shell into a zero-thickness layer with space varying properties, and this allows the solution of the full problem by considering the outer domain only.
FIG. 1.
(Color online) Sketch for illustration of the domain decomposition of the thick shell encapsulated microbubble problem.
B. Solution of the outer domain liquid problem
1. Fictitious membrane
The outer domain liquid flow due to the encapsulated bubble's motion is assumed to be irrotational and incompressible. These are conventional assumptions for bubble dynamics (Plesset and Chapman, 1971; Blake and Gibson, 1987; Chahine, 1993, 1997; Church, 1995; Allen et al., 2002; Marmottant et al., 2005; Sarkar et al., 2005). The assumption of irrotational flow for the outer domain allows the definition of a velocity potential, ϕ, such that
| (1) |
where u is the velocity vector. The assumption that the liquid is incompressible leads to Laplace's equation for the potential:
| (2) |
A boundary integral method is used to solve Eq. (2). This method is based on an integral solution of the Laplace equation using the Gauss–Ostrogradsky divergence theorem, which can be written using Green's second identity:
| (3) |
In this expression is the 3-D domain of integration having elementary volume . The boundary surface of is S, which includes the surface of the contrast agent and the nearby boundaries with elementary surface element dS and local normal unit vector n. ϕ is harmonic in the fluid domain , and G is Green's function. If G is selected to be harmonic everywhere but at some discrete points, Eq. (17) simplifies considerably. For instance, if
| (4) |
where x is a fixed point in and y is a point on the boundary surface S, Eq. (3) reduces to Green's formula with απ being the solid angle at x enclosing the domain .
| (5) |
α = 4, if x is a point in the fluid, α = 2, if x is a point on a smooth surface, and α < 4, if x is a point at a sharp corner of the discretized surface.
This equation states that if the velocity potential ϕ and its normal derivatives are known on the boundary surface S of a domain , where ϕ satisfies the Laplace equation, then ϕ can be determined anywhere in by integration over the boundary surface. Using this expression, the boundary integral method reduces by one the dimension of the problem of solving the Laplace equation.
2. Boundary conditions
The mathematical modeling of the problem leads to a boundary value problem posed for a domain with a fixed boundary (liquid/wall interface) and a moving boundary (liquid/shell interface) on which nonlinear boundary conditions should be satisfied. For the fixed boundary, the boundary condition on any nearby body surface, S, states that there is no flow across the boundary and is given for a rigid and stationary body surface by
| (6) |
For a moving/deforming boundary, the boundary conditions impose a balance of the normal stresses and an equality of the fluid normal velocity and the interface normal velocity, un,
| (7) |
At any given time step, if the velocity potential ϕ on the boundary surface S is known, then the interface normal velocity can be derived from Eq. (5) by solving a system of linear equations. For a point B on the boundary S, the Bernoulli equation gives
| (8) |
where is the imposed ultrasound pressure at the particular bubble location, . is the liquid density, and Pl is the liquid side pressure on the liquid/shell interface at . Once Pl is determined from the boundary conditions (see Sec. ???), Eq. (8) can provide , and the rate of change in potential at a given point followed in its motion can be obtained by
| (9) |
where is the velocity at , at the liquid/shell interface.
C. Thick shell viscous Navier–Stokes model
1. Governing equations
To solve the highly viscous flow in the inner domain, the unsteady incompressible Navier–Stokes equations are used. The continuity and momentum equations in non-dimensional form are given as
| (10) |
| (11) |
where are the normalized Cartesian components of the velocity, are the normalized Cartesian coordinates, and p is the normalized pressure. Using asterisks for the selected scales, is the Reynolds number of the viscous shell, and are the characteristic velocity and length, is the shell density, and is its dynamic viscosity. For the simulations in the following text, L* is selected to be the encapsulated shell inside radius, the selected characteristic time, T*, is the imposed acoustic oscillations period, and .
2. Boundary condition at the gas-shell interface
Kinematic and dynamic boundary conditions are applied at the gas-liquid interface. The kinematic condition ensures that a particle on the surface remains on the surface. This can be written , with , being the equation of the surface.
The dynamic condition imposes zero shear stress and balance of normal stresses at the interface. The dynamic boundary condition at ζ = 0 (gas-shell interface) in non-dimensional form as
| (12) |
where are contravariant velocity components in the curvilinear coordinates and is the curvature of gas-shell interface.
| (13) |
is the Weber number with being the surface tension at the gas-shell interface.
| (14) |
where , and are the dimensional gas and vapor partial pressures inside the bubble and the imposed driving pressure function far from the bubble.
To determine the gas pressure we assume that the amount of gas inside the bubble remains constant and that the gas satisfies the polytropic relation
| (15) |
where is the gas volume and is the gas polytropic exponent.
III. BOUNDARY CONDITION AT THE SHELL–LIQUID INTERFACE
The shell–liquid interface is a liquid–liquid interface at which the boundary conditions are continuity of the shear stresses, balance of the normal stresses, and continuity of the velocity. These can be written in nondimensional format as
| (16) |
| (17) |
In the preceding expressions, is the normalized dynamic viscosity of the host liquid, is its normalized density, is the normalized curvature of the shell-liquid interface, and
| (18) |
is the Weber number, where is the surface tension at the shell-liquid interface.
are the normal derivatives of the tangential velocity components in the and directions, respectively, at the liquid side of the interface. is the derivative along the normal of the velocity normal component, and Pl is the pressure on the liquid side of the shell-liquid. is the local unit normal vector to the boundary, and is the viscous liquid velocity at the boundary which will be provided by the solution of the outer domain.
A. Zero-thickness approximation
In Eq. (8), Pl can be determined by considering the normal stress balance across the liquid/shell interface and computed in the inner domain as described in the previous study (Hsiao et al., 2010). However, there are great advantages if this relatively CPU-costly procedure is replaced by an equivalent zero-thickness shell with properties reproducing the real finite-thickness shell behavior. To do this, the stresses exerted by the liquid on the encapsulated bubble have to be properly captured. For the study of microbubble rupture by acoustic excitation, the normal stresses are predominant and can be expressed through the normal stress boundary condition across the liquid/shell/gas interface. To do this, let us consider the dynamics of a spherical thick shell encapsulated bubble with inner and outer shell radii, R1 and R2, respectively. The continuity equation and incompressibility of the shell material and host liquid fluid leads to
| (19) |
where is the radial velocity in the shell and host liquids. This provides a direct relationship between and , the inner and outer radius of the shell.
Applying the momentum equations to both the inner and outer domain problem with the boundary equations described in the following text leads to a non-dimensional Rayleigh–Plesset-like differential equation for R2, which describes the time variation of —and thus too because of Eq. (19)—which has the following non-dimensional expression (Allen et al., 2002, Lu et al., 2010):
| (20) |
where and . The characteristic length is chosen to be the initial outer radius and the characteristic velocity is . is the selected characteristic time and is the smallest of the inverse of the frequency, f, of the imposed acoustic waves or the bubble Rayleigh period based on ΔP the amplitude of the imposed acoustic waves:
| (21) |
In the case of a highly viscous liquid shell of thickness, d, which tends toward zero, we have
| (22) |
and Eq. (20) becomes
| (23) |
If we ignore the layer thickness variations in a zero-thickness model, d can be replaced by its initial value , and if we define the equivalent properties for Weber number, , and dilatational parameter, :
| (24) |
we obtain the equivalent zero-thickness differential equation:
| (25) |
Incidentally, this spherical finite-thickness shell model recovers the spherical zero-thickness shell model derived by Sarkar et al. (2005) using a dilatational viscosity in the normal stress balance equation. In dimensional form, the dilatational coefficient is given by
| (26) |
This same concept can be applied in 3-D to develop a 3-D zero-thickness shell model. In this model, the dynamics boundary condition at the contrast agent/liquid interface is obtained by analogy with the spherical zero-thickness model, (25), by balancing the pressure in the liquid at the interface with the partial gas and vapor pressures, the surface tension and the viscous and dilatational normal stresses:
| (27) |
To derive the boundary condition for the 3-D equivalent zero-thickness model, we start from combining Eqs. (12) and (16):
| (28) |
The finite thickness shell can be replaced by a vanishing thin boundary, if new equivalent parameters are used for the Weber number and the dilatational viscosity,
| (29) |
Therefore Eq. (28) can be reduced to
| (30) |
where is an “effective” normal stress that is introduced to represent the normal stress of the finite thickness shell. By comparing Eqs. (30) and (27), we can find all equivalent terms, i.e., , and if a local spherical model is assumed. To adapt Eq. (30) for the current 3-D zero-thickness model, a local-spherical motion approximation is applied such that and . As a result, the normal stress boundary condition is written as
| (31) |
In the equivalent zero-thickness model, as expressed in Eq. (22), the inner and outer bubble shell radii become the same, and the first choice this study made was to use the initial outer radios, , as the equivalent microbubble radius to track and use for the computations in Eq. (23) especially that was selected as length scale. However, the conducted 3-D numerical validation tests comparing the equivalent zero-thickness model with the thick model suggest that using the mid-layer thickness, i.e., , is a better choice for improved equivalency.
IV. NUMERICAL SOLUTION METHOD
A. Boundary element method
With the equivalent thin layer approximation, the problem has been reduced to the potential flow solution of the outer problem only, Eq. (5). This is solved using a boundary element method. To do so, all boundaries are discretized into triangles, , and the surface integrals are evaluated at any field point x as a summation over all panels of the influence of singularity distributions over the boundaries. This enables one to write Green's second formula, (5), in the form
| (32) |
where M is the number of surface elements on the boundary. To evaluate the integrals over , given in Eq. (32), it is necessary to assume a relation between and at a surface node with the values of these quantities at the discretized nodes. Here we assume that these quantities vary linearly over a panel and can be described by the panel nodes. By applying a linear interpolation for each panel , each elementary integral can be written as a linear combination of or evaluated at the surrounding nodes. The integration expressions are complex, and details can be found in our previous study (Chahine et al., 1989). With the integration over each panel performed, the discretized Eq. (32) can be expressed as
| (33) |
where and are the potential and its normal derivative at node i of panel k, and and are influence coefficients obtained from elementary integration and N is the total node number.
Following a “collection” procedure in which the contributions due to the same node are collected from the various contiguous elementary surfaces and summed up, Eq. (33) can be rewritten as
| (34) |
where and are the altered influence coefficients due to summation of the same node. It is noted that the “collection” approach transfers the panel contribution in Eq. (33) to the node contribution in Eq. (34). Equation (34) can be expressed in a matrix form as
| (35) |
where I is an identity matrix, and and are influence coefficient matrices. With known on all boundary nodes, Eq. (35) is a linear system of N equations and can be readily solved for N unknowns of , using classical methods such as LU decomposition and Gauss elimination. The LU decomposition factorizes a matrix as the product of a lower triangular matrix and an upper triangular matrix. The LU decomposition can be viewed as the matrix form of Gaussian elimination (Poole, 2010).
B. Time integration
To proceed with the time integration, the points on the bubble surface are advanced using the node velocities. The normal velocity is known from the solution of the integral equation while the tangential velocity is obtained by using a local surface fit to the velocity potential . The nodes are then advanced according to
| (36) |
The 3DynaFS-Bem© version used here uses a simple Euler stepping scheme to numerically integrate Eq. (36).
The time stepping uses an adaptive scheme with the step δt selected to ensure that smaller time steps are used when rapid changes in the velocity potential occur, while larger ones are chosen for less rapid changes. The time step is determined by
| (37) |
where is the highest nodal velocity and is the minimum distance between the nodes at the current step. The factor A in the denominator is a user input to further control the time scale.
To prevent excessively small steps or large steps leading to inordinately long run times or erroneous results, the time step size is not allowed to become smaller or larger than prescribed minimum and maximum values.
C. Curvature computation
The curvature introduced in Eq. (31) is the local surface curvature given by
| (38) |
The local normal at the surface is defined by
| (39) |
where F is a local description of the surface. The appropriate sign is chosen so that all normals point toward the liquid domain. The normal is computed at each node with a first order finite difference using the surrounding nodes. Because all the cases presented in this study are axisymmetric, azimuthal averaging was applied to smooth the value of curvature computed.
V. EXAMPLE NUMERICAL RESULTS
The results and computations in this study focus on oil-shelled microbubbles developed for drug delivery. For example, ImaRx Therapeutics (Tucson, AZ) has produced a prototype with a triacetin shell. In the present study, we consider a triacetin-shelled bubble in water with the following physical properties: Triacetin density (May et al., 2002): , triacetin viscosity: , surface tension at gas-triacetin interface: , water density: , water viscosity: , surface tension at triacetin-water interface: . The bubble is assumed to contain a gas with negligible density and viscosity and with a gas polytropic constant, .
A. Validity of equivalent spherical zero-thickness shell model
To examine the validity of replacing the triacetin shell with a zero-thickness shell of equivalent properties and explore for the region of applicability of the method for the triacetin-shelled microbubble, we consider first an isolated microbubble excited by an ultrasound acoustic wave and compare the results obtained from both the finite-thickness spherical model and the equivalent zero-thickness spherical model as shown in Eqs. (20) and (25), respectively.
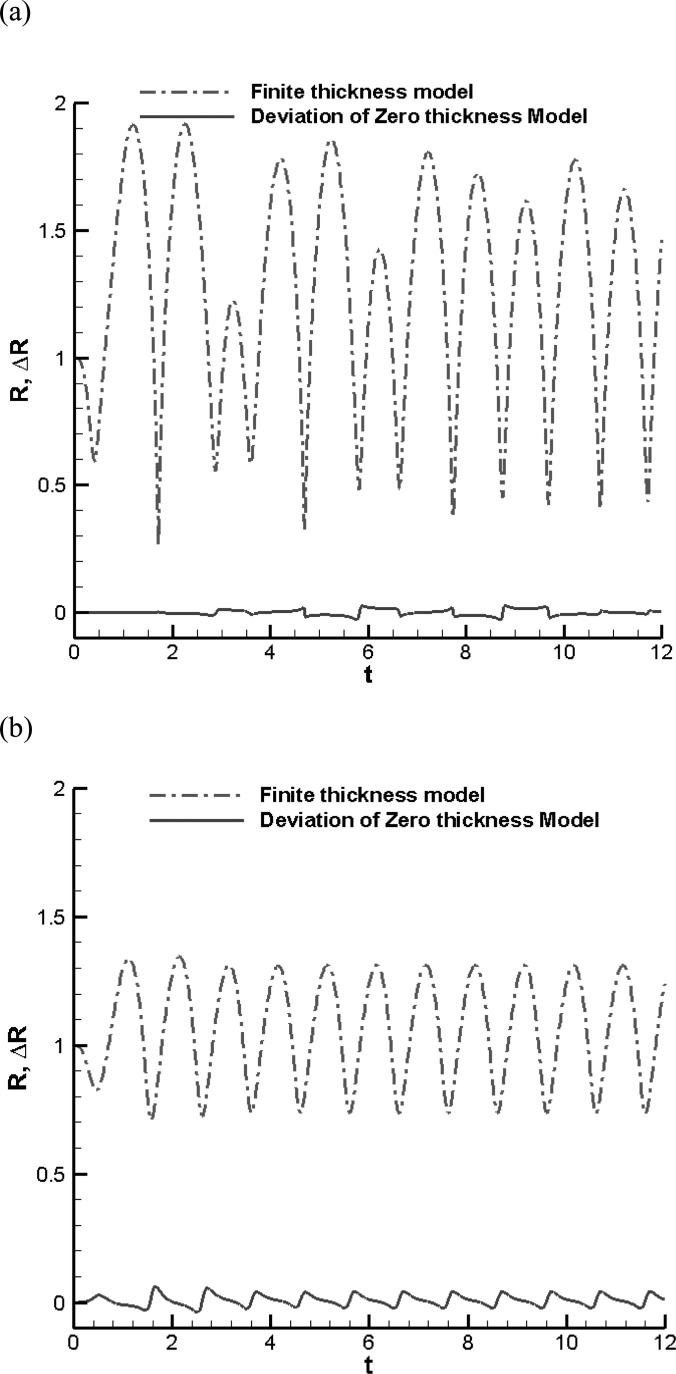
Figure 2(a) shows a comparison between the two models for a triacetin-shelled bubble with initial outer radius of 1.7 μm and an initial thickness of μm driven by a sinusoidal acoustic wave with amplitude, , and frequency, f = 2.5 MHz in water at atmospheric pressure, . The figure shows that the shelled microbubble oscillates at a frequency composed of both the acoustic driving frequency (2.5 MHz) and the bubble natural frequency, which appears to be of the order of 10 MHz from the short period oscillations in the figure. A simple formula to describe the natural frequency of highly viscous shelled bubble is not readily available; however, when the shell thickness is negligible, the dilatation term can be ignored and the frequency can be estimated using
| (40) |
This is a modified expression from the expressions given in Brennen (1995) and Krismatullin (2004) without considering the viscous damping of the surrounding liquid and shell and gives a value of about 3.53 MHz for the case in Fig. 2(a). As we can see in the figure, both the finite-thickness and the zero-thickness shell models capture the same behavior and the solution of the equivalent zero-thickness model matches very well with that of the finite-thickness model.
FIG. 2.
(Color online) Comparison of the time history of the shelled bubble outer radius between finite-thickness and equivalent zero-thickness models for (a) , 1 MPa, and (b) under a sinusoidal acoustic excitation pressure with , , and f = 2.5 MHz. The radii are normalized by the initial outer radius size, while times are normalized by 1/f.
Figure 2(b) shows a comparison between the two models for a much thicker shelled contrast agent driven by a sinusoidal acoustic wave with , and frequency, f = 2.5 MHz in water at atmospheric pressure, . While the viscous damping from the surrounding liquid can be neglected, a viscous correction for the shell is needed for the case in Fig. 2(b). Using the correction from Krismatullin (2004),
| (41) |
the natural frequency decreases to the value of 3.23 MHz. Here again both the finite-thickness and zero-thickness shell models capture the same oscillation behavior, but the figure shows some discrepancies in the details especially during the lower amplitude higher frequency cycles.
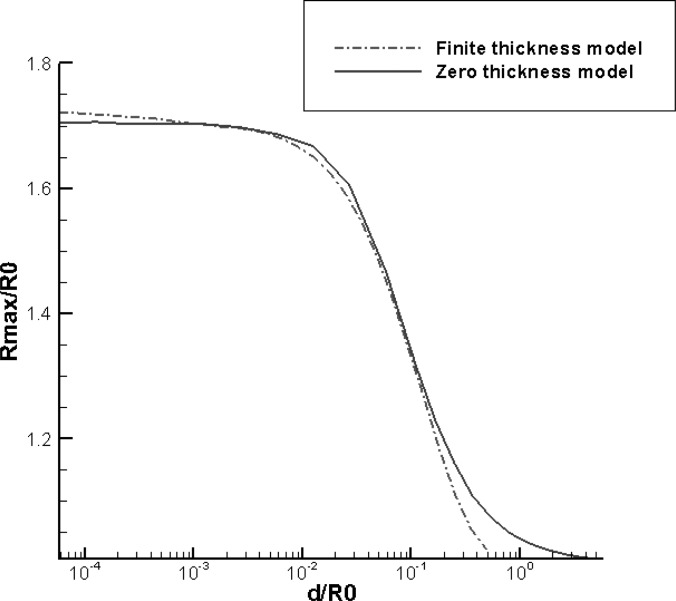
Figure 3 generalizes the results of Fig. 2 by considering an extensive range of the non-dimensional shelled microbubble thickness. The figure compares the steady state maximum microbubble amplitude of oscillation of the radius versus the normalized initial shell thickness, i.e., after the bubble has reached repeated oscillations cyclic behavior. Here again, the driving pressure considered was , , and .5 MHz for both methods. It can be seen that the equivalent zero-thickness model starts to deviate significantly from the finite-thickness model if the shell thickness exceeds 10% of the initial outside shell radius. This shows that for these conditions the domain of application of the thin shell model is quite extensive but not universal. The weakest assumption in the equivalent model is probably the assumption that the shell thickness retains the initial values during the dynamics. This assumption is being improved in the follow-up model.
FIG. 3.
(Color online) Comparison of the normalized maximum radius versus normalized initial shell thickness between the finite-thickness and the zero-thickness model for , MPa, and f = 2.5 MHz.
B. Validity of equivalent 3D zero-thickness shell model
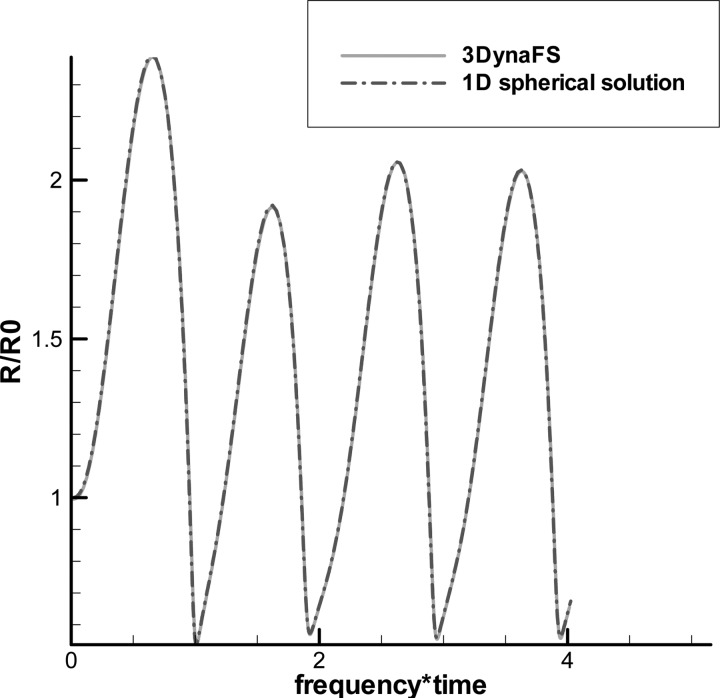
To validate the equivalent 3-D zero-thickness shell model using the thin shell approximation as expressed by Eq. (31), we consider an isolated bubble first and compare its corresponding 3D solutions with those obtained by a spherical finite-thickness shell model that has been validated with experimental measurement by Hsiao et al. (2010). To do so, we consider the 3-D non-spherical zero-thickness model results for a triacetin-shelled contrast agent driven by a sinusoidal acoustic wave with , , and in an unbounded domain. For these simulations, we use , which corresponds to a thickness of 0.5 μm; a total of 402 nodes and 800 panels are used to discretized the bubble. As shown in Fig. 4 the solution obtained by the 3-D model gives an excellent agreement with the spherical solution.
FIG. 4.
(Color online) Comparison between 3-D equivalent zero-thickness and spherical finite-thickness models for a Triacetin-shelled contrast agent oscillating under a sinusoidal acoustic excitation pressure with , , and f = 2.5 MHz.
The 3-D zero-thickness shell model is also applied to the simulation of the dynamics of a thick-shelled microbubble near a rigid wall when subjected to ultrasound acoustic excitation with amplitude , and frequency and . The thick-shelled microbubble has an initial inner radius of 1.2 μm and an initial outer radius of 1.7 μm and is initially located 2.85 μm away from the solid wall. The results of the equivalent zero-thickness model were compared to those of the finite-thickness shell model. During the study, we found that using as radius in the equivalent zero-thickness model, , i.e., , gives the best match with the finite-thickness shell model results.
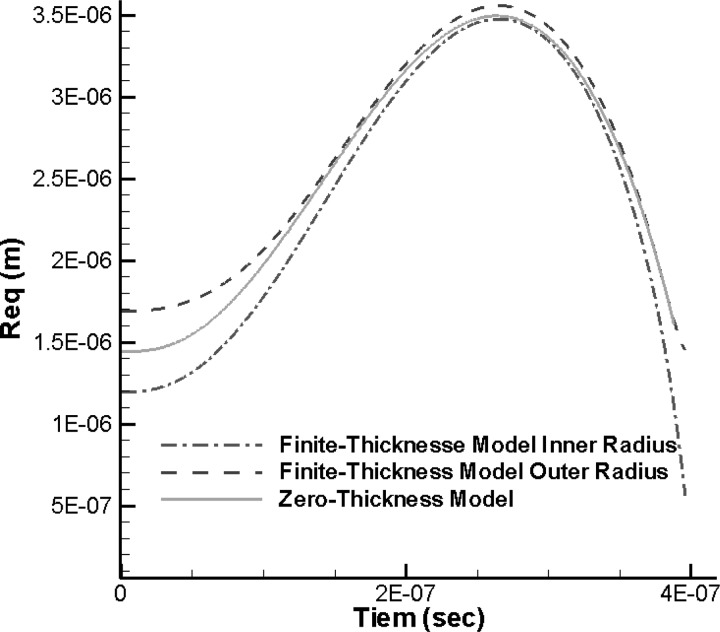
Figure 5 shows the comparison of the bubble shape variations between the two models at several time steps during the first bubble cycle of oscillations while Fig. 6 shows the comparison of the equivalent encapsulated bubble radius versus time. It can be seen that the bubble shapes of the equivalent zero-thickness shell model fall almost between the 3-D finite-thickness fully computed shapes of the inner and outer shell interfaces. The shapes start to deviate from each other when the thickness increases significantly toward the end of the bubble collapse. In addition to such deviation, the bubble shape of the zero-thickness model also shows undulations at the end of the first cycle. These are higher order mode surface shape deformations or surface buckling that the viscous finite thickness layer damp out. By comparing with the finite-thickness model, these deformations are damped by viscous tangential shear stresses in the finite thickness model, which are ignored in the zero-thickness model.
FIG. 5.

(Color online) Comparison of the bubble shape variations between the 3-D finite-thickness model (solid line) and the equivalent zero-thickness shell model (dashdot line) at several time steps during the first bubble oscillation cycle. , f = 2.5 MHz. . Initial inner and outer radii: 1.2 and 1.7 μm. Initial distance from rigid wall: 2.85 μm.
FIG. 6.
(Color online) Comparison of the equivalent encapsulated bubble radius versus time between the 3-D finite-thickness model and the equivalent zero-thickness shell model (represented as sold line) during the first bubble oscillation cycle. , f = 2.5 MHz. . Initial inner and outer radii: 1.2 and 1.7 μm. Initial distance from rigid wall: 2.85 μm.
C. Application to dynamics of thick-shelled contrast agents near a wall
1. Rigid wall standoff effect for insonified agents
The 3-D zero-thickness shell model is used in this section to simulate the dynamics of a contrast agent near a rigid wall. For illustration, we consider a triacetin-shelled bubble with an initial outer radius R0 = 1.45 μm, and a shell thickness, d0 = 0.5 μm.
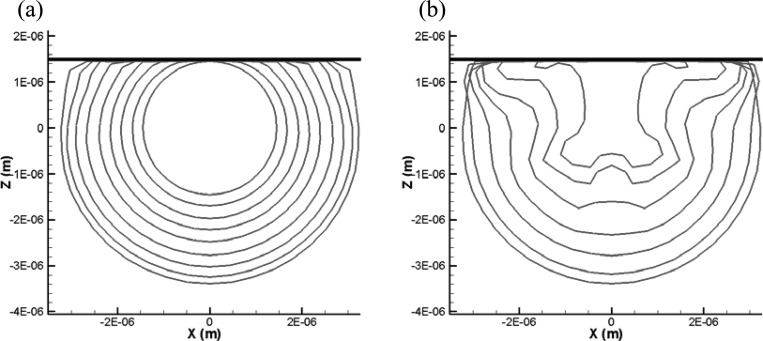
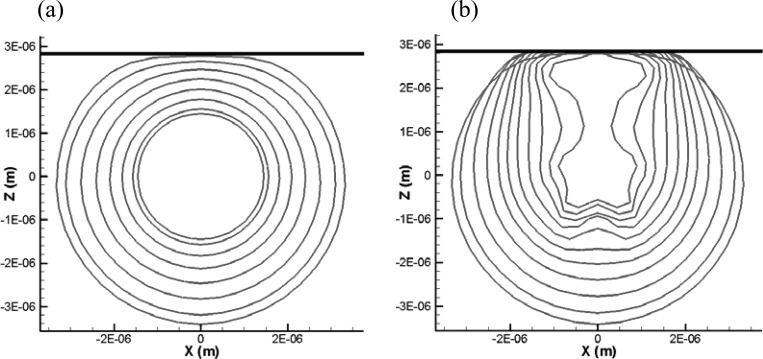
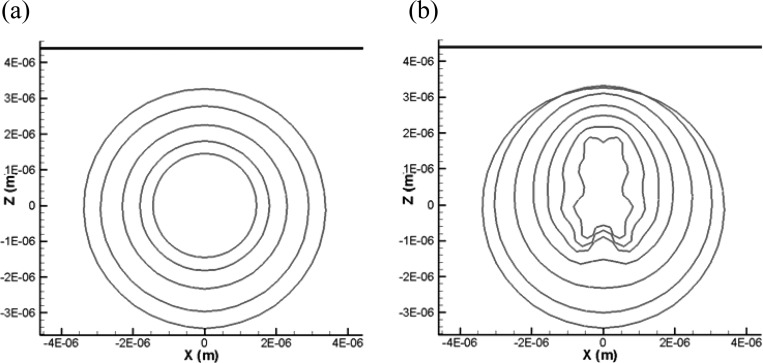
Figures 7–9 show the time evolution of the contrast agent outer contour when the Triacetin-shelled bubble is subjected to a sinusoidal acoustic wave with , , and f = 2.5 MHz. The figures show the first period of oscillation (growth and collapse) at three different initial standoffs (distances between the bubble center and the plane wall) are X = 1.45, 2.85, and 4.35 μm. These correspond, based on the resulting maximum radius in each case, to normalized standoff distances of (). Among these three cases, only the largest standoff case, , was able to continue to the next cycle while the simulations for and μm were terminated when the bubble surface became multi-connected due to two sides of the surface touching each other at the end of collapse. In the present simulations, this occurs either when a reentrant jet traverses the whole bubble interior to touch the other side or when a part of the surface pinches off. These phenomena may initiate shell break up.
FIG. 7.
(Color online) Contrast agent shape variations obtained by the equivalent 3-D zero-thickness model. Oscillations near a rigid wall under a sinusoidal acoustic wave with ΔP = 1 MPa, , and f = 2.5 MHz at an initial standoff from the rigid wall of 1.45 μm with R0 = 1.45 μm, d0 = 0.5 μm. (a) Bubble growth, (b) bubble collapse during first oscillation period.
FIG. 8.
(Color online) Contrast agent shape variations obtained by the equivalent 3-D zero-thickness model. Oscillations near a rigid wall under a sinusoidal acoustic wave with , , and f = 2.5 MHz at an initial standoff from the rigid wall of 2.85 μm with R0 = 1.7 μm, d0 = 0.5 μm. (a) Bubble growth, (b) bubble collapse during first oscillation period.
FIG. 9.
(Color online) Contrast agent shape variations obtained by the equivalent 3-D zero-thickness model. Oscillations near a rigid wall under a sinusoidal acoustic wave with , , and f = 2.5 MHz at an initial standoff from the rigid wall of 4.35 μm with R0 = 1.7 μm, d0 = 0.5 μm. (a) Bubble growth, (b) bubble collapse during first oscillation period.
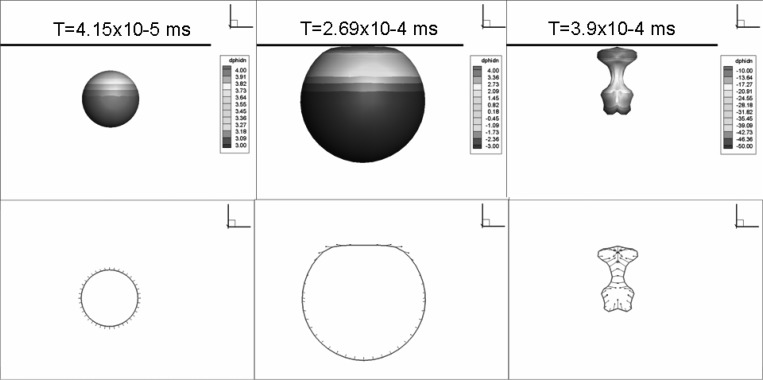
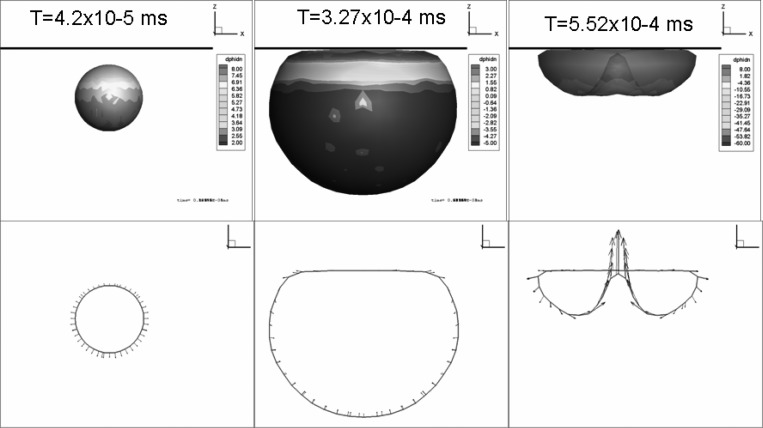
Figure 10 shows for X = 2.85 μm the contrast agent 3-D shape and the normal velocities at the bubble surface at three different instants. The top set shows color contours of the normal component of the velocity, while the lower row shows the bubble contour and the velocity vectors. A positive normal velocity indicates the surface moving outward (away from the gas region). In the figure, the times are selected such that the second contours are when the contrast agent attains its maximum size while the third contours are at the last computation time step before the shelled microbubble volume rebounds.
FIG. 10.
(Color online) Dynamics of a contrast agent near a rigid wall when subjected to a sinusoidal acoustic wave with , , and f = 2.5 MHz. The initial standoff form the rigid wall is 2.85 μm. R0 = 1.45 μm, d0 = 0.5 μm. Top row: Contrast agent shape evolution and normal velocity contours obtained with equivalent the 3-D zero-thickness model at three time steps (during growth, at maximum volume, and at minimum volume prior to rebound). Bottom row: Bubble outline and velocity vectors at the three time steps.
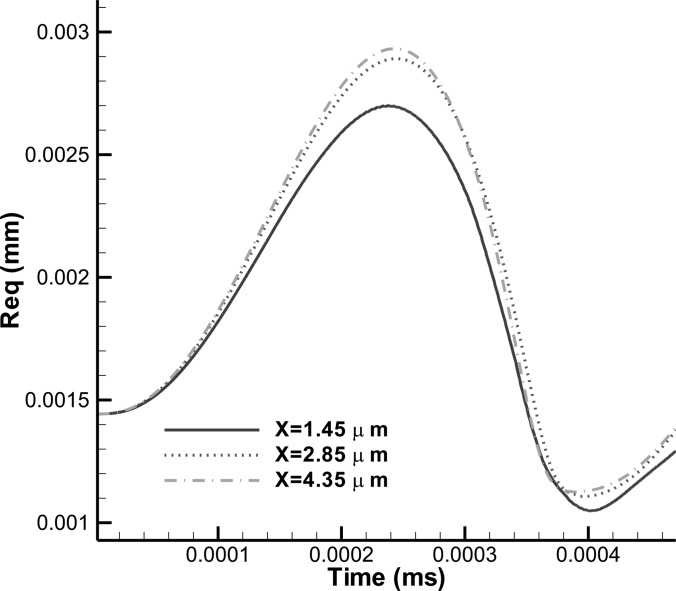
Figure 11 shows a comparison of the time history of the contrast agent equivalent radii for three different initial standoffs (1.45, 2.85, and 4.35 μm). For this comparison, the initial shell thickness was chosen to be d0 = 0.7 μm so that the bubble oscillations can continue to the second bubble period without the bubble becoming multi-connected. From the comparison, we can see that reducing the standoff reduces the equivalent maximum bubble radius but increases the first bubble period. It is noted that the first bubble period is defined as the time lapse from the beginning of excitation to the moment when the bubble rebound, i.e., the bubble size is at its minimum. This is similar to the behavior of an air/vapor bubble behavior near a rigid wall (Chahine, 1982; Blake and Gibson, 1987).
FIG. 11.
(Color online) Comparison of the time history of a contrast agent equivalent radius for three different standoff distances. Dynamics near a rigid wall when subjected to a sinusoidal acoustic wave with , , and f = 2.5 MHz, R0 = 1.45 μm, d0 = 0.7 μm.
2. Comparison between zero-thickness approximation and 3-D full solution
In addition to the comparison between the results of finite-thickness and zero-thickness models already shown in Fig. 5 (X = 2.85 μm), we compare here the two methods for three other standoffs (X = 2.0, 2.6, and 4.35 μm) to cover the various bubble dynamics regimes.
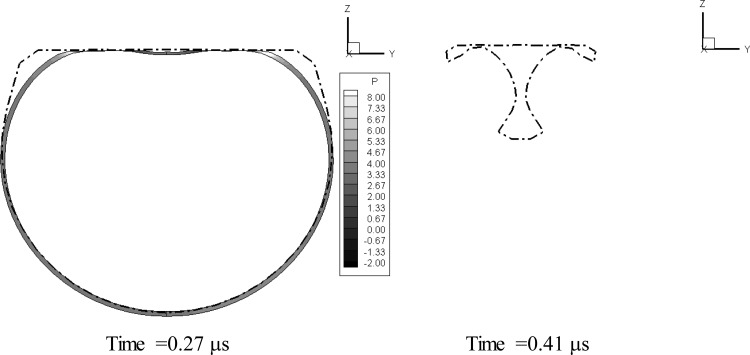
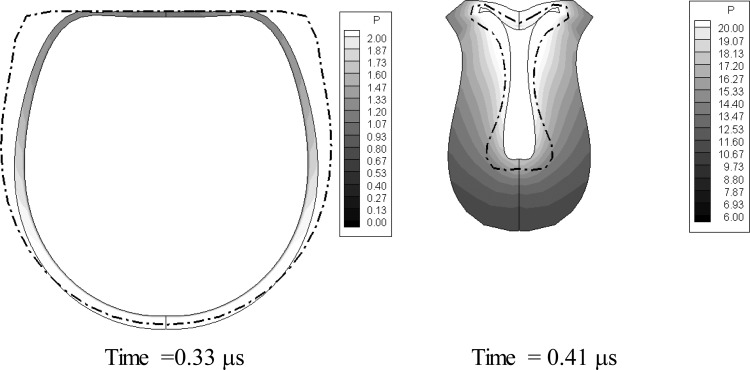
When the standoff distance is very small (e.g., X = 2.0 μm, Fig. 12), the zero-thickness shell model is able to continue the simulation to the end of the first bubble cycle, while the strong bubble-wall interaction and excessive shell stretching prevents the finite-thickness shell model from completing the simulation. As the standoff increases (X = 2.6 μm in Fig. 13 and X = 4.35 μm in Fig. 14), the two methods can complete the computation successfully. Figure 13 shows that the thick viscous layer prevents the bubble side closer to the wall from expanding as much as obtained with the zero-thickness model. However, the overall dynamics and bubble shape are captured very well with the zero-thickness model. The final shapes of the zero-thickness model appear as an average through the thickness of the 3-D solution. For the largest standoff, Fig. 14, the dynamics during the bubble growth are almost identical between the two methods. However, during the collapse, higher order mode surface deformations appear in the zero-thickness model, while they are damped through viscous losses in the finite-thickness shell model. The overall dynamics is similar between the two codes; however, the comparison shows the need for some additional damping in the zero-thickness model.
FIG. 12.
Comparison of the bubble shape variations between the 3-D finite-thickness model and the equivalent zero-thickness shell model (represented as dashdot curves) at two time steps for initial distance from rigid wall equal to 2.0 μm. , f = 2.5 MHz. . Initial inner and outer radii: 1.2 and 1.7 μm.
FIG. 13.
Comparison of the bubble shape variations between the 3-D finite-thickness model and the equivalent zero-thickness shell model (represented as dashdot curves) at two time steps for initial distance from rigid wall equal to 2.6 μm. , f = 2.5 MHz. . Initial inner and outer radii: 1.2 and 1.7 μm.
FIG. 14.
Comparison of the bubble shape variations between the 3-D finite-thickness model and the equivalent zero-thickness shell model (represented as dashdot curves) at two time steps for initial distance from rigid wall equal to 4.35 μm. , f = 2.5 MHz. . Initial inner and outer radii: 1.2 and 1.7 μm.
3. Dilatational viscosity and reentrant jet formation
One significant result from these and previous simulations (Hsiao et al., 2007; Hsiao et al., 2010) is that, even for the smallest standoff case, there is no conventional reentrant jet formation during the bubble collapse. To investigate the connection between this observation and the effect of the dilatational viscosity, we consider the same 2.85 μm standoff case shown in the preceding text and for the same acoustic excitation but in absence of the dilatational viscosity in equation (i.e., after canceling the strong viscous effect of the layer).
Figure 15 shows, in absence of the viscous effects, the bubble shape and normal velocity contours at three times. In the figure, the second sequence corresponds to the maximum bubble size, while the third sequence corresponds to the time step when the reentrant jet touched the other side bubble. The figure shows that without the dilatational viscosity the bubble behaves as a regular gas bubble and a strong reentrant jet is formed. By comparing the microbubble behavior with that in Fig. 7, it can be seen that the shell viscosity both reduces the maximum bubble size and opposes the formation of a reentrant jet, making the effective standoff larger.
FIG. 15.
(Color online) Bubble shape normal velocity contours and velocity vectors at three time steps (during growth, at maximum volume, and at minimum volume prior to rebound) when the microbubble is subjected to a sinusoidal acoustic wave with ΔP = 1 MPa, and f = 2.5 MHz at an initial standoff of 2.85 μm with R0 = 1.45 μm. Equivalent 3-D zero-thickness model with dilatational viscosity turned off artificially.
D. Effect of shell thickness and standoff on shell break-up
It has been shown by Chahine (1997) that a bubble growing and collapsing explosively may become in presence of other body forces (e.g., gravity) pinched off and cut into two as opposed to forming a reentrant jet during its collapse, depending on its initial distance to a solid boundary. For the current problem, parameters such as the shell thickness, shell material, initial bubble radius, acoustic pressure amplitude, and frequency affect the bubble shape and type of deformation and will influence the breakup mechanism. Here we only focus on the effect of stand-off to the wall and shell thickness on the shell deformation and breakup. Simulations were conducted again for a triacetin-shelled bubble with an initial equivalent zero-thickness shelled microbubble radius of R0 = 1.45 μm under ultrasound acoustic excitation with , and f = 2.5 MHz.
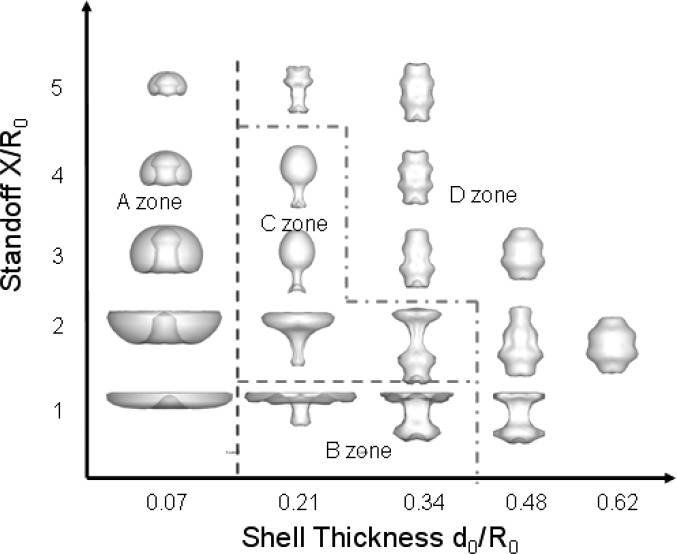
Simulations are presented in Fig. 16 for five wall stand-off distances, X = 1.45, 2.85, 4.35, 5.80, and 7.25 μm, and five shell thicknesses, d0 = 0.1, 0.3, 0.5, 0.7, and 0.9 μm. The simulation in each case was continued for more than one oscillation cycle unless microbubble breakup occurred earlier. Within the parametric space studied, Fig. 16 shows a diagram of the resulting bubble shapes, either at the end of the simulation due to bubbles becoming multi-connected or at the end of the first bubble oscillation cycle. It is noted that the rigid wall, which is not shown in each bubble image, is located above the bubble for all the cases. According to the last shape of the bubble surface, we can divide the diagram into four zones:
-
(1)
In Zone A, a single re-entering jet is found to punch through the bubble.
-
(2)
In Zone B, a ring type jet is formed at touchdown in addition to an elongated bubble.
-
(3)
In Zone C, the bubble is seen to pinch off into two in the direction perpendicular to the wall.
-
(4)
In Zone D, the relative importance of the viscosity in the shell is so large that the bubble surface does not become multi-connected during the first cycle.
FIG. 16.
(Color online) Diagram of bubble shapes at breakup (Zones A, B, C) or at the end of the first bubble period (Zone D) within the parametric space studied for ΔP = 1 MPa, , and f = 2.5 MHz, R0 = 1.45 μm. It is noted that the wall is located above the bubble in all cases.
Figure 17 shows three representative bubble center-plane crosscuts with velocity vectors to illustrate a typical single reentrant jet touchdown for Zone A, ring-type reentrant jet touchdown for Zone B and pinch-off touchdown for Zone C. Based on this diagram, bubble break-up in Zones A and B could be the best conditions for drug or gene delivery. This is because the break-up of bubble in the first cycle allows lower pressure amplitude, and the jet directed to the wall can help drug or gene particles penetrate the cell membrane. Although the bubble also breaks up due to pinch-off in Zone C within the first cycle, there is no jet vectoring towards the wall to enhance sonoporation.
FIG. 17.

(Color online) Three representative bubble center plane crosscuts with velocity vectors illustrating (a) single reentrant jet touchdown for Zone A, (b) ring-type reentrant jet touchdown for Zone Band, (c) pinch-off touchdown for Zone C.
VI. CONCLUSIONS
A 3-D zero-thickness shell model was developed to model the dynamics of encapsulated bubble with viscous shells in strong pressure field oscillations, reduce computational cost, and enable parametric study of shell break-up mechanisms. Test cases were considered for triacetin-shelled microbubbles subjected to ultrasound excitation. The study showed that the zero-thickness shell model can recover well the full 3-D viscous-inviscid dynamics of encapsulated microbubbles if the initial shell thickness is less than 10% of the initial shell outer radius. This limit may be due to the present assumption in the equivalent model that the shell thickness retains its initial value during the dynamics. The model is being improved by allowing the shell thickness to vary in time and space according to the local pressure and velocity conditions while conserving the shell volume.
A parametric study on shell thickness and stand-off shows a variety of bubble shapes at break-up. Four zones are identified in the parametric space. Based on the diagram, the best conditions for drug and gene delivery enhancement using the reentrant jet mechanism are identified and correspond as expected to thin shells and closeness to the boundary. Because this study considered rigid boundaries, its results need to be reconsidered for nearby flexible boundaries interacting with the microbubble.
ACKNOWLEDGMENTS
This work was supported by the National Institute of Biomedical Imaging and Bioengineering under SBIR Phase I and Phase II programs for the development of 3DYNAFS-CELL© a software to study cells, microbubbles, and contrast agents and their interactions
REFERENCES
- 1.Allen, J. S. , May, D. J. , and Ferrara, K. W. (2002). “ Dynamics of therapeutic ultrasound contrast agents,” Ultrasound Med. Biol. 29(6 ), 805–816 10.1016/S0301-5629(02)00522-7 [DOI] [PubMed] [Google Scholar]
- 2.Becher, H., and Burns, P. N. (2000). Handbook of Contrast Echocardiography: Left Ventricular Function and Myocardial Perfusion (Springer Verlag, New York), pp. 1–44 [Google Scholar]
- 3.Blake, J. R. , and Gibson, D. C. (1987). “ Cavitation bubbles near boundaries,” Annu. Rev. Fluid Mech. 19, 99–123 10.1146/annurev.fl.19.010187.000531 [DOI] [Google Scholar]
- 4.Brennen, C. E. (1995). Cavitation and Bubble Dynamics (Oxford University Press, New York: ), Chap. 4. [Google Scholar]
- 5.Chahine, G. L. (1977). “ Interaction between an oscillating bubble and a free surface,” J. Fluids Eng. 99, 709–716 10.1115/1.3448889 [DOI] [Google Scholar]
- 6.Chahine, G. L. (1982). “ Experimental and asymptotic study of nonspherical bubble collapse,” Appl. Sci. Res. 38, 187–197 10.1007/BF00385948 [DOI] [Google Scholar]
- 7.Chahine, G. L. (1993). “ Cavitation dynamics at microscale level,” J. Heart Valve Dis. 3, 102–116 [PubMed] [Google Scholar]
- 8.Chahine, G. L. (1997). “Numerical and experimental study of explosion bubble crown jetting behavior,” Technical Report 96003-1-ONR (Dynaflow, Inc., Jessup, MD).
- 9.Chahine, G. L. , Perdue, T. O. , and Tucker, C. B. (1989). “ Interaction between underwater explosion bubble and a solid submerged body,” Technical Report 89001-1 (Dynaflow, Inc., Jessup, MD).
- 10.Chen, S. Y. , Ding, J. H. , Bekeredjian, R., Yang, B. Z. , and Shohet, R. V. (2006). “ Efficient gene delivery to pancreatic islets with ultrasonic microbubble destruction technology,” Proc. Natl. Acad. Sci. USA 103(22 ), 8469–8474 10.1073/pnas.0602921103 [DOI] [PMC free article] [PubMed] [Google Scholar]
- 11.Church, C. C. (1995). “ The effects of an elastic solid surface layer on the radial pulsations of gas bubbles,” J. Acoust. Soc. Am. 97(3 ), 1510–1521 10.1121/1.412091 [DOI] [Google Scholar]
- 12.Crum, L. A. (1979). “ Surface oscillations and jet development in pulsating bubbles,” J. Phys., Colloq., Suppl. N.11 40, c8–285 [Google Scholar]
- 13.Ferrara, K. W. , Pollard, R., and Borden, M. (2007). “ Ultrasound microbubble contrast agents: Fundamentals and application to gene and drug delivery,” Annu. Rev. Biomed. Eng. 9, 415–447 10.1146/annurev.bioeng.8.061505.095852 [DOI] [PubMed] [Google Scholar]
- 14.Hauff, P., Seemann, S., Reszka, R., Schultze-Mosgau, M., and Reinhardt, M. (2005). “ Evaluation of gas-filled microparticles and sonoporation as gene delivery system: Feasibility study in rodent tumor models,” Radiology 236, 572–578 10.1148/radiol.2362040870 [DOI] [PubMed] [Google Scholar]
- 30.Hsiao, C. T. , Lu, X., and Chahine, G. L. (2007). “ 3D Modeling of the Dynamics of Therapeutic Ultrasound Contrast Agents,” Technical Report 2M6018 (Dynaflow, Inc., Jessup, MD).
- 15.Hsiao, C.-T., Lu, X., and Chahine, G. L. (2010). “ Three-dimensional modeling of the dynamics of therapeutic ultrasound contrast agent,” Ultrasound Med. Biol. 36(12 ), 2065–2079 10.1016/j.ultrasmedbio.2010.08.022 [DOI] [PMC free article] [PubMed] [Google Scholar]
- 16.Krismatullin, D. B. (2004). “ Resonance frequency of microbubbles: Effect of viscosity,” J. Acoust. Soc. Am. 116(3 ), 1463–1473 10.1121/1.1778835 [DOI] [PubMed] [Google Scholar]
- 17.Lu, X., Chahine, G. L. , and Hsiao, C.-T. (2010). “ Stability analysis of ultrasound thick-shell contract agent,” J. Acoust. Soc. Am. 131(1 ), 24–34 10.1121/1.3666000 [DOI] [PMC free article] [PubMed] [Google Scholar]
- 18.Marmottant, P., van der Meer, S., Emmer, M., Versluis, M., de Jong, N.Hilgenfeldt, S., and Lohse, D. (2005). “ A model for large amplitude oscillations of coated bubbles accounting for buckling and rupture,” J. Acoust. Soc. Am. 118(6 ), 3499–3505 10.1121/1.2109427 [DOI] [Google Scholar]
- 19.May, D. J. , Allen, J. J. , and Ferrara, K. W. (2002). “ Dynamics and fragmentation of thick-shelled microbubbles,“IEEE Trans. Ultrason., Ferroelectr. Freq. Control 49(10 ), 1400–1410 10.1109/TUFFC.2002.1041081 [DOI] [PubMed] [Google Scholar]
- 20.Mayer, C. R. , and Bekeredjian, R. (2008). “ Ultrasonic gene and drug delivery to the cardiovascular system,” Adv. Drug Delivery Rev. 60, 1177–1192 10.1016/j.addr.2008.03.004 [DOI] [PubMed] [Google Scholar]
- 21.Miller, M. W. (2000). “ Gene transfection and drug delivery,” Ultrasound Med. Biol. 26, S59–S62 10.1016/S0301-5629(00)00166-6 [DOI] [PubMed] [Google Scholar]
- 22.Plesset, M. S. , and Chapman, R. B. (1971). “ Collapse of an initially spherical vapour cavity in the neighborhood of a solid boundary,” J. Fluid Mech. 47(2 ), 283–290 10.1017/S0022112071001058 [DOI] [Google Scholar]
- 23.Poole, D. (2010). Linear Algebra: A Modern Introduction, 3rd ed. (Brooks/Cole, Canada: ), Chap. 3. [Google Scholar]
- 24.Price, R. J. , Skyba, D. M. , Kaul, S., and Skalak, T. C. (1998).” Delivery of colloidal particles and red blood cells to tissue through microvessel ruptures created by targeted microbubble destruction with US,” Circulation. 98, 1264–1267 10.1161/01.CIR.98.13.1264 [DOI] [PubMed] [Google Scholar]
- 25.Sarkar, K., Shi, W. T. , Chatterjee, D., and Forsberg, F. (2005). “ Characterization of ultrasound contrast microbubbles using in vitro experiments and viscous and viscoelastic interface models for encapsulation,” J. Acoust. Soc. Am. 118(1 ), 539–550 10.1121/1.1923367 [DOI] [PubMed] [Google Scholar]
- 26.Song, J., Chappell, J. C. , Ming, Q., VanGieson, E. J. , Kaul, S., and Price, R. J. (2002). “ Influence of injection site, microvascular pressure and ultrasound variables on microbubble-mediated delivery of microspheres to muscle,” J. Am. Coll. Radiol. 39, 726–731 10.1016/S0735-1097(01)01793-4 [DOI] [PubMed] [Google Scholar]
- 27.Tartis, M. S. , McCallan, J., Lum, A. F. , Labell, R., and Stieger, S. M. (2006). “ Therapeutic effects of paclitaxel-containing ultrasound contrast agents,” Ultrasound Med. Biol. 32, 1771–1780 10.1016/j.ultrasmedbio.2006.03.017 [DOI] [PubMed] [Google Scholar]
- 28.Unger, E. C. , Matsunaga, T. O. , McCreery, T., Schumann, P., Switzer, R., and Quigley, R. (2002). “ Therapeutic applications of microbubbles,” Eur. J. Radiol. 42, 160–168 10.1016/S0720-048X(01)00455-7 [DOI] [PubMed] [Google Scholar]
- 29.Zhang, S., Duncan, J. H. , and Chahine, G. L. (1993). “ The final stage of the collapse of a cavitation bubble near a rigid wall,” J. Fluid Mech. 257, 147–181 10.1017/S0022112093003027 [DOI] [Google Scholar]


