

Abstract
High dose nitrate (NO3-) supplementation via beetroot juice (BR, 1 mmol/kg/day) lowers mean arterial blood pressure (MAP) and improves skeletal muscle blood flow and O2 delivery/utilization matching thereby raising microvascular O2 pressure (PO2mv). We tested the hypothesis that a low dose of NO3- supplementation, consistent with a diet containing NO3- rich vegetables (BRLD, 0.3 mmol/kg/day), would be sufficient to cause these effects. Male Sprague-Dawley rats were administered a low dose of NO3- (0.3 mmol/kg/day; n=12), a high dose (1 mmol/kg/day; BRHD, n=6) or tap water (control, n=10) for 5 days. MAP, heart rate (HR), blood flow (radiolabeled microspheres) and vascular conductance (VC) were measured during submaximal treadmill exercise (20 m/min, 5% grade, equivalent to ∼60% of maximal O2 uptake). Subsequently, PO2mv (phosphorescence quenching) was measured at rest and during 180 s of electrically-induced twitch contractions (1 Hz, ∼6 volts) of the surgically-exposed spinotrapezius muscle. BRLD and BRHD lowered resting (control: 139±4, BRLD: 124±5, BRHD: 128±9 mmHg, P<0.05) and exercising (control: 138±3, BRLD: 126±4, BRHD: 125±5 mmHg, P<0.05) MAP to a similar extent. For BRLD this effect occurred in the absence of altered exercising hindlimb muscle(s) blood flow or spinotrapezius PO2mv (rest and across the transient response at the onset of contractions, all P>0.05), each of which increased significantly for the BRHD condition (all P<0.05). Whereas BRHD slowed the PO2mv kinetics significantly (i.e., >mean response time, MRT; control: 16.6±2.1, BRHD: 23.3±4.7 s) following the onset of contractions compared to control, in the BRLD group this effect did not reach statistical significance (BRLD: 20.9±1.9 s, P=0.14). These data demonstrate that while low dose NO3- supplementation lowers MAP it does so in the absence of augmented muscle blood flow, VC and PO2mv; all of which are elevated at a higher dose. Thus, in healthy animals, a high dose of NO3- supplementation seems necessary to elicit significant changes in exercising skeletal muscle O2 delivery/utilization.
Keywords: nitric oxide, exercise, dietary nitrate, nitrite, mean arterial pressure, blood flow
1. Introduction
A fundamental tenet of exercise physiology is that blood flow (BF) increases following exercise onset to meet the rising skeletal muscle energetic demands. This hyperemic response is mediated by a host of vasodilatory controllers (Joyner and Wilkins, 2007) and it is now widely accepted that nitric oxide (NO) plays a deterministic role in regulating not only O2 delivery (QO2) (Hirai et al. 1994; reviewed by Joyner and Tschakovsky, 2004), but also O2 utilization (V(02D9)O2) within the skeletal muscle (Andrade et al. 1998; Larsen et al 2012). A growing body of evidence suggests that ingestion of inorganic nitrate (NO3-), for example via beetroot juice (BR), can, following a step-wise reduction, elevate NO bioavailability and thus impact skeletal muscle hemodynamic and metabolic function during exercise (Larsen et al. 2007; Bailey et al. 2009; Vanhatalo et al. 2010; Kenjale et al. 2011; Lansley et al. 2011a,b; Ferguson et al. 2013a,b).
In humans, NO3- supplementation via BR reduces blood pressure and enhances exercise tolerance in both healthy (Bailey et al. 2009; Vanhatalo et al. 2010; Lansley et al. 2011a,b; Cermak et al. 2012; Wylie et al. 2013b) and patient populations (i.e., peripheral arterial disease, Kenjale et al. 2011). These effects appear to have a dose-dependent response with no additional improvement in exercise tolerance after ingesting BR containing 16.8 compared to 8.4 mmol NO3- (Wylie et al. 2013a). The precise mechanisms for these improvements are not yet fully understood. However, recent investigations using murine models implicate enhanced exercising muscle BF (i.e., ↑QO2, Ferguson et al. 2013a) and QO2/V(02D9)O2matching (e.g. microvascular PO2; PO2mv, Ferguson et al. 2013b) combined with greater contractile efficiency (e.g. ↓ V(02D9)O2; Hernandez et al. 2012).
Many disease states impair exercise tolerance and its restoration is a primary therapeutic goal. What is not known is whether lower doses of NO3- alter cardiovascular control and muscle oxygenation (i.e. PmvO2, which sets the pressure head for capillary-myocyte O2 flux) during exercise. Specifically, one question of paramount ecological importance is whether NO3- dosing consistent with an individual eating a diet rich in leafy greens and other NO3- sources can achieve the cardiovascular and muscular benefits without the necessity for supplementation per se. Thus, we tested the hypotheses that a low dose of NO3- supplementation (i.e. consistent with a diet containing NO3- rich vegetables, 0.3 mmol/kg/day) would be sufficient to 1) raise plasma [NO3-] and [NO2-], 2) lower mean arterial pressure (MAP) at rest and during exercise, 3) elevate BF and vascular conductance (VC) in locomotory muscles of the hindlimb and 4) raise the PO2mv of the mixed fiber-type spinotrapezius muscle during the crucial rest-contractions transient.
Methods
Animal selection and care
Thirty-one young adult male Sprague-Dawley rats (∼3-4 months of age, Charles River Laboratories, Wilmington, MA, USA) were used in this investigation. Rats were maintained in accredited animal facilities at Kansas State University on a 12/12 hr light-dark cycle with food and water provided ad libitum. All procedures were approved by the Institutional Animal Care and Use Committee of Kansas State University and conducted according to National Institutes of Health guidelines. All rats were familiarized with running on a custom-built motor-driven treadmill for 5 min/day at a speed of 20 m/min up a 5% grade for ∼5 days.
Supplementation protocol
Rats were randomly assigned to receive 5 days of BR supplementation with either a low NO3- dose of 0.3 mmol/kg/day (BRLD; n=14), a higher NO3- dose of 1 mmol/kg/day (BRHD; n=6, Beet it™, James White Drinks, Ipswich UK) or untreated tap water (control; n=11) with consumption monitored. For both BRLD and BRHD rats, two days' worth of BR was diluted in 100 ml of tap water (average daily fluid consumption ∼50-60 ml/day). This lower NO3- dose (0.3 mmol/kg/day) represents a dose found in a diet containing NO3- rich vegetables, while the higher NO3- dose (1 mmol/kg/day) represents a dietary supplement with a NO3- concentration similar to that used by Jones and colleagues (Bailey et al. 2009; Vanhatalo et al. 2010; Lansley et al. 2011a,b) after accounting for the resting metabolic rate of rats (∼7x that of humans, Henson et al. 1987; Musch et al. 1988). In an effort to minimize the unnecessary utilization of additional animals, both control and BRHD data presented herein represent a randomly selected subset of animals published recently. The BRHD data represent a NO3- dose of 1 mmol/kg/day and demonstrate a significant vascular effect of supplementation (Ferguson et al. 2013a,b). Data from the BRLD group were obtained within the same time-frame as control and BRHD groups presented in Ferguson et al. (2013a,b, e.g. within 16 weeks). In this way any potential seasonal differences or variations in rat-chow content were avoided.
Surgical instrumentation
Rats were anaesthetized with a 5% isoflurane-O2 mixture and maintained subsequently on 3% isoflurane-O2. The carotid artery was isolated and cannulated with a catheter (PE-10 connected to PE-50, Intra-Medic polyethylene tubing, Clay Adams Brand, Becton, Dickinson and Company, Sparks, MD) for the measurement of MAP and HR, infusion of the phosphorescent probe (see below), and arterial blood sampling. A second catheter was placed in the caudal artery. The incisions were then closed and rats were given >1 hr to recover (Flaim et al. 1984).
Protocol 1: Measurement of hindlimb skeletal muscle blood flow
After recovery, rats were placed on the treadmill and the caudal artery catheter was connected to a 1 ml syringe chambered in a Harvard infusion/withdrawal pump (model 907, Cambridge, MA, USA). The carotid artery catheter was connected to a pressure transducer (Gould Statham P23ID, Valley View, OH, USA) maintained at the same height as the animal. Exercise was initiated and treadmill speed was increased progressively over a ∼30 s period to a speed of 20 m/min (5% grade, ∼60% V(02D9)O O2 max; Musch et al. 1988). The rat continued to exercise for another 2.5 min until a total time of 3 min was reached. At 3 min the Harvard pump was activated and withdrawal was initiated at a rate of 0.25 ml · min-1. Simultaneously, HR and MAP were measured and recorded using the carotid artery catheter. The carotid artery catheter was then disconnected from the pressure transducer and 0.5-0.6 × 10⁶ 15 μm diameter radiolabeled microspheres (57Co or 85Sr in random order; Perkin Elmer, Waltham, MA, USA) were infused into the aortic arch for determination of regional BF. Following the microsphere infusion ∼0.2 ml of blood was sampled from the carotid artery catheter for the determination of blood lactate concentration ([lactate]) (Nova Stat Profile M, Nova Biomedical, Waltham, MA, USA) after which exercise was terminated.
Following a minimum 1 hr recovery period, a second microsphere infusion (differently radio-labeled than the first) was performed while the rat sat quietly on the treadmill for the determination of resting BF, HR and MAP. This experimental strategy (i.e. exercise before rest) mitigates potential influences of the pre-exercise anticipatory response on resting skeletal muscle BF measurements (Armstrong et al. 1989).
Protocol 2: Measurement of spinotrapezius muscle PO2mv
Following the second (resting) microsphere infusion, rats were anesthetized progressively using diluted pentobarbital sodium anesthesia (administered into the caudal artery catheter to effect) with the level of anesthesia monitored continuously via the toe-pinch and blink reflexes. Rats were then placed on a heating pad to maintain core temperature at ∼38 °C (measured via rectal probe). Overlying skin and fascia were reflected carefully from the mid-dorsal caudal region of each rat and the right spinotrapezius muscle was carefully exposed in a manner that ensured the integrity of the neural and vascular supply to the muscle (Bailey et al. 2000). Silver wire electrodes were sutured (6–0 silk) to the rostral (cathode) and caudal (anode) regions of the muscle. The exposed spinotrapezius muscle was continuously superfused with a warmed (38°C) Krebs–Henseleit bicarbonate buffered solution equilibrated with 5% CO2–95% N2 and surrounding exposed tissue was covered with Saran wrap (Dow Brands, Indianapolis, IN). The spinotrapezius muscle was selected specifically based on its mixed muscle fiber-type composition and citrate synthase activity close to that found in human quadriceps muscle (Delp & Duan 1996; Leek et al. 2001).
The phosphorescent probe palladium meso-tetra (4 carboxyphenyl)porphyrin dendrimer (R2: 15–20 mg ·kg-1 dissolved in 0.4 ml saline) was infused via the carotid artery catheter. After a brief stabilization period (∼10 min), the common end of the light guide of a frequency domain phosphorometer (PMOD 5000, Oxygen Enterprises, Philadelphia, PA) was positioned ∼2-4 mm superficial to the dorsal surface of the exposed right spinotrapezius muscle over a randomly selected muscle field absent of large vessels thus ensuring that the region contained principally capillary blood. PO2mv was measured via phosphorescence quenching (see below) and reported at 2 s intervals throughout the duration of the 180 s contraction protocol (1 Hz, ∼6 V, 2 ms pulse duration) elicited via a Grass stimulator (model S88, Quincy, MA). Following the contraction period it was ensured that PmvO2 returned to baseline values (indicative of preserved vasomotor function). Rats were euthanized via pentobarbital sodium overdose (≥50 mg/kg administered into the carotid artery catheter).
PO2mv measurement and curve-fitting
The Stern-Volmer relationship allows the calculation of PO2mv through the direct measurement of a phosphorescence lifetime via the following equation (Rumsey et al., 1988):
where kQ is the quenching constant and τ° and τ are the phosphorescence lifetimes in the absence of O2 and the ambient O2 concentration, respectively. For R2, kQ is 409 mmHg-1 · s-1 and τ° is 601 μs (Lo et al., 1997) and these characteristics do not change over the physiological range of pH and temperature in the rat in vivo and, therefore, the phosphorescence lifetime is determined directly by the O2 pressure (Rumsey et al., 1988; Lo et al., 1997).
The R2 phosphorescent probe binds to albumin, and consequently, is uniformly distributed throughout the plasma. A previous study from our laboratory investigated systematically the compartmentalization of R2 and confirmed that it remains within the microvasculature of exposed muscle over the duration considered in the present experiments, thereby ensuring a valid PO2mv measurement (Poole et al., 2004).
Curve-fitting of the measured PO2mv responses was performed with commercially available software (SigmaPlot 11.01, Systat Software, San Jose, CA) and the data were fit with either a one- or two-component model as described below:
where PO2mv (t) represents the PO2mv at any given time t, PO2mv (BL) corresponds to the precontracting resting baseline PO2mv, Δ1 and Δ2 are the amplitudes for the first and second components, respectively, TD1 and TD2 are the time delays for each component, and τ1 and τ2 are the time constants (i.e., time to 63% of the final response value) for each component. Goodness of fit was determined using the following criteria: 1) the coefficient of determination, 2) sum of the squared residuals, and 3) visual inspection and analysis of the model fits to the data and the residuals. The mean response time (MRT) of the kinetics response was calculated for the first component in order to provide an index of the overall principal kinetics response according to the following equation:
where TD1 and 1 are as described above. The delta of the initial PO2mv fall following contractions onset was normalized to τ1 (Δ1 PO2mv /τ1) to provide an index of the relative rate of fall. Additionally, the time taken to reach 63% of the initial PO2mv fall was determined independently from the modeling procedures (T63) to ensure appropriateness of the model fits. Specifically, the raw PO2mv data were interpolated, and the time coinciding with 63% of the total amplitude (Δtotal PO2mv) was determined.
Determination of BF and VC
Following euthanasia, the thorax of each rat was opened and placement of the carotid artery catheter was confirmed before the internal organs and individual muscles and muscle parts of the hindlimb were identified and excised. Upon removal, tissues were weighed and placed promptly into counting vials. Radioactivity of each tissue was determined with a gamma scintillation counter (Packard Auto Gamma Spectrometer, model 5230, Downers Grove, IL, USA). Tissue BF was then calculated using the reference sample method (Musch & Terrell, 1992) and expressed as ml/min/100 g. Adequate mixing of the microspheres was verified for each microsphere infusion as demonstrated by a <15% difference in BF to the right and left kidneys and to the right and left hindlimb musculature. VC was calculated by normalizing BF to MAP and expressed as ml/min/100 g · mmHg-1.
Blood sampling and measurement of plasma [NO3-] and [NO2-]
Post-supplementation blood samples were collected following surgical instrumentation via the caudal artery catheter to assess 1) plasma [NO3-] and [NO2-] and 2) pH, PO2, and %O2 saturation. For plasma [NO3-] and [NO2-], ∼0.8 ml of blood was drawn into heparinized tubes and rapidly centrifuged at 6000 g at 4°C for 6 minutes. Plasma was then extracted and frozen immediately at -80°C for later analysis. A second ∼0.3 ml blood sample was drawn and analyzed for pH, PO2, and %O2 saturation (Nova Stat Profile M, Nova Biomedical, Waltham, MA, USA).
All measurements of plasma NO3- and NO2- were performed within 30 minutes of thawing via chemiluminescence with an Ionic/Sievers NO analyzer (NOA 280i, Sievers Instruments, Boulder, CO, USA). In order to obtain plasma NO2- levels and to avoid potential reduction of NO3-, potassium iodide in acetic acid was used as a reductant. This reductant possesses the ability to reduce NO2- to NO but is incapable of reducing higher oxides of nitrogen (i.e. NO3-) thus increasing the specificity for NO2-. Plasma NO3- concentrations were then obtained using the same apparatus with the stronger reductant vanadium chloride in hydrochloric acid at a temperature of 95°C. This stronger reductant reduces the sum of all nitrogen oxides with an oxidation state of +2 or higher (predominantly NO3- [μM]) but also includes NO2- and nitrosothiols [nM]. Consequently, the signals obtained using potassium iodide were subtracted from those with vanadium chloride to provide a clearer representation of the NO3-concentrations.
Statistical analysis
Data are presented as mean ± standard error of the mean (SEM). Results were compared within (rest vs. exercise) and between (control vs. BRLD vs. BRHD) using mixed 2-way analysis of variance (ANOVA) with Student-Newman-Keuls post hoc tests where appropriate. Significance was accepted at P<0.05.
Results
There were no between-group differences in the total hind-limb muscle/body mass ratio (control: 4.4 ± 0.1, BRLD: 4.3 ± 0.1, BRHD: 4.2 ± 0.2%, P>0.05). BRHD, but not BRLD, rats had significantly higher plasma [NO3-] and [NO2-] when compared to control (Figure 1).
Figure 1.

Top panel: Post-supplementation plasma [NO3-] for control, BRLD and BRHD rats. Bottom panel: Post-supplementation plasma [NO2-] for control, BRLD and BR rats. *P<0.05 versus control #P<0.05 versus BRLD.
Protocol 1: BF and VC at rest and during exercise
MAP and HR
MAP at rest was reduced in BRLD rats compared to control. However, despite >10 mmHg lower average, resting MAP was not significantly different in BRHD rats when compared to control (P=0.20, Figure 2). During treadmill exercise MAP was reduced for both BRLD and BRHD groups when compared to control (Figure 2). Neither HR at rest (control: 408 ± 8, BRLD: 408 ± 17, BRHD: 407 ± 18 beats/min, P>0.05) or during exercise (control: 528 ± 10, BRLD: 508 ± 14, BRHD: 525 ± 7 beats/min, P>0.05) was altered for BRLD or BRHD.
Figure 2.
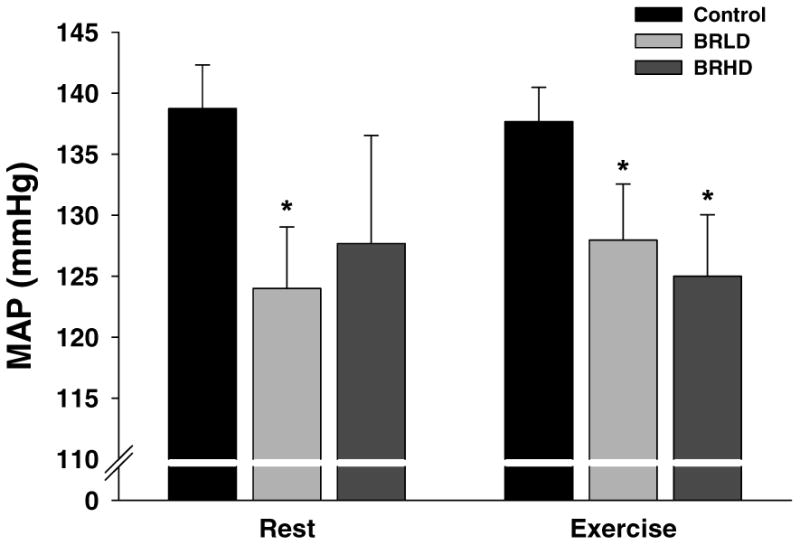
Resting and exercising mean arterial pressures for control, BRLD and BRHD rats. *P<0.05 versus control.
Blood gases, blood [lactate], hematocrit
There were no between-group differences in arterial PO2, PCO2, or hematocrit at rest or during exercise (data not shown, P>0.05 for all). Resting and exercising arterial blood [lactate] were not different among groups (Table 1, P>0.05 for all) but tended (P=0.12) to be lower for BRHD during exercise.
Table 1.
Effects of low dose and high dose BR supplementation on resting hindlimb muscle BF (ml/min/100g) and VC (ml/min/100g/mmHg).
| BF | VC | |||||
|---|---|---|---|---|---|---|
|
|
|
|||||
| Control | BRLD | BRHD | Control | BRLD | BRHD | |
| Ankle extensors | ||||||
| Soleus (9%) | 87 ± 16 | 119 ± 17 | 107 ± 33 | 0.62 ± 0.11 | 0.96 ± 0.12 | 0.79 ± 0.24 |
| Plantaris (80%) | 15 ± 2 | 16 ± 2 | 9 ± 2 | 0.11 ± 0.01 | 0.13 ± 0.01 | 0.07 ± 0.02 |
| Gastrocnemius, red (14%) | 43 ± 7 | 56 ± 9 | 58 ± 19 | 3.07 ± 0.05 | 0.44 ± 0.07 | 0.43 ± 0.13 |
| Gastrocnemius, white (100%) | 14 ± 2 | 12 ± 2 | 10 ± 3 | 0.10 ± 0.05 | 0.10 ± 0.02 | 0.08 ± 0.02 |
| Gastrocnemius, mixed (91%) | 14 ± 2 | 16 ± 2 | 16 ± 4 | 0.10 ± 0.02 | 0.12 ± 0.02 | 0.12 ± 0.02 |
| Tibialis posterior (73%) | 17 ± 2 | 18 ± 3 | 16 ± 5 | 0.12 ± 0.01 | 0.14 ± 0.02 | 0.12 ± 0.03 |
| Flexor digitorum longus (68%) | 19 ± 2 | 24 ± 2 | 10 ± 2 | 0.15 ± 0.02 | 0.19 ± 0.02 | 0.08 ± 0.01 |
| Flexor halicus longus (71%) | 13 ± 2 | 12 ± 2 | 9 ± 2 | 0.09 ± 0.01 | 0.09 ± 0.01 | 0.07 ± 0.01 |
| Ankle flexors | ||||||
| Tibialis anterior, red (63%) | 19 ± 3 | 27 ± 7 | 21 ± 10 | 0.14 ± 0.02 | 0.21 ± 0.06 | 0.15 ± 0.07 |
| Tibialis anterior, white (80%) | 20 ± 2 | 18 ± 3 | 16 ± 4 | 0.14 ± 0.02 | 0.15 ± 0.02 | 0.12 ± 0.03 |
| Extensor digitorum longus (76%) | 16 ± 2 | 15 ± 2 | 15 ± 4 | 0.12 ± 0.01 | 0.12 ± 0.01 | 0.11 ± 0.03 |
| Peroneals (67%) | 17 ± 3 | 15 ± 2 | 19 ± 4 | 0.12 ± 0.02 | 0.12 ± 0.02 | 0.14 ± 0.03 |
| Knee extensors | ||||||
| Vastus intermedius (4%) | 46 ± 9 | 84 ± 18 | 93 ± 48 | 0.32 ± 0.06 | 0.66 ± 0.13 | 0.69 ± 0.35 |
| Vastus medialis (82%) | 15 ± 2 | 17 ± 3 | 25 ± 9 | 0.10 ± 0.01 | 0.13 ± 0.02 | 0.19 ± 0.06 |
| Vastus lateralis, red (35%) | 40 ± 6 | 66 ± 16 | 83 ± 31 | 0.28 ± 0.04 | 0.19 ± 0.04 | 0.61 ± 0.22 |
| Vastus lateralis, white (100%) | 16 ± 2 | 14 ± 2 | 13 ± 3 | 0.11 ± 0.01 | 0.11 ± 0.02 | 0.10 ± 0.02 |
| Vastus lateralis, mixed (89%) | 16 ± 1 | 21 ± 4 | 29 ± 9 | 0.12 ± 0.01 | 0.17 ± 0.04 | 0.21 ± 0.06 |
| Rectus femoris, red (66%) | 23 ± 4 | 24 ± 4 | 29 ± 14 | 0.16 ± 0.03 | 0.19 ± 0.04 | 0.20 ± 0.10 |
| Rectus femoris, white (100%) | 15 ± 2 | 16 ± 3 | 17 ± 5 | 0.11 ± 0.01 | 0.13 ± 0.02 | 0.12 ± 0.03 |
| Knee flexors | ||||||
| Biceps femoris anterior (100%) | 11 ± 1 | 9 ± 1 | 10 ± 2 | 0.07 ± 0.01 | 0.07 ± 0.01 | 0.08 ± 0.01 |
| Biceps femoris posterior (92%) | 11 ± 2 | 12 ± 2 | 15 ± 3 | 0.08 ± 0.01 | 0.10 ± 0.01 | 0.11 ± 0.02 |
| Semitendinosus (83%) | 12 ± 2 | 14 ± 2 | 18 ± 5 | 0.08 ± 0.01 | 0.11 ± 0.02 | 0.14 ± 0.03 |
| Semimembranosus, red (72%) | 15 ± 2 | 19 ± 3 | 28 ± 9 | 0.11 ± 0.02 | 0.15 ± 0.02 | 0.21 ± 0.06 |
| Semimembranosus, white (100%) | 13 ± 2 | 11 ± 1 | 12 ± 2 | 0.09 ± 0.01 | 0.09 ± 0.01 | 0.09 ± 0.01 |
| Thigh adductors | ||||||
| Adductor longus (5%) | 115 ± 7 | 142 ± 12 | 148 ± 12 | 0.84 ± 0.06 | 1.12 ± 0.10 | 1.19 ± 0.12 |
| Adductor magnus & brevis (89%) | 15 ± 3 | 16 ± 3 | 23 ± 7 | 0.11 ± 0.02 | 0.13 ± 0.02 | 0.17 ± 0.05 |
| Gracilis (77%) | 16 ± 3 | 17 ± 2 | 20 ± 4 | 0.11 ± 0.02 | 0.13 ± 0.01 | 0.15 ± 0.03 |
| Pectineus (69%) | 17 ± 2 | 23 ± 4 | 28 ± 7 | 0.12 ± 0.01 | 0.19 ± 0.03 | 0.21 ± 0.04 |
Data are mean ± SEM. Values in parentheses indicate % type IIb + d/x according to Delp & Duan (1996). Control; n=10, BRLD; n=14, BRHD; n=6.
BF and VC
There were no differences in resting total hindlimb skeletal muscle BF (control: 16 ± 2, BRLD: 19 ± 2, BRHD: 21 ± 5 ml/min/100g, P>0.05) or VC (control: 0.12 ± 0.01, BRLD: 0.15 ± 0.02, BRHD: 0.16 ± 0.03 ml/min/100g/mmHg, P>0.05) between groups. Similarly, there were no differences in resting BF or VC in any of the 28 individual hindlimb muscles or muscle parts (Table 1).
Total exercising hindlimb muscle BF and VC were greater in BRHD rats when compared to BRLD and control rats (Figure 3). Specifically, BRHD supplemented rats had greater BF in 15, and VC in 20, of the 28 individual hindlimb muscles and muscle parts (Table 2) when compared to control and BRLD rats. There were no between-group differences in BF or VC at rest or during exercise to organs of the splanchnic region (Table 3).
Figure 3.
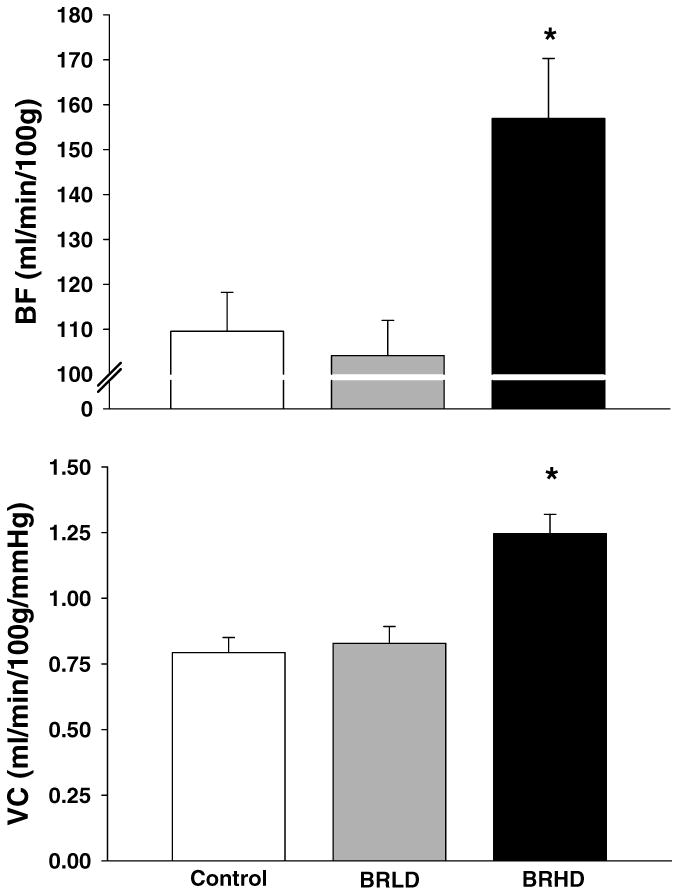
Total hindlimb BF and VC for control, BRLD and BRHD rats during submaximal locomotory exercise. *P<0.05 versus control.
Table 2.
Effects of low dose and high dose BR supplementation on exercising hindlimb muscle BF (ml/min/100g) and VC (ml/min/100g/mmHg).
| BF | VC | |||||
|---|---|---|---|---|---|---|
|
|
|
|||||
| Control | BRLD | BRHD | Control | BRLD | BRHD | |
| Ankle extensors | ||||||
| Soleus (9%) | 297 ± 46 | 251 ± 19 | 328 ± 39 | 2.15 ± 0.33 | 2.04 ± 0.20 | 2.60 ± 0.26 |
| Plantaris (80%) | 208 ± 17 | 194 ± 18 | 249 ± 10† | 1.51 ± 0.11 | 1.56 ± 0.17 | 2.00 ± 0.06*† |
| Gastrocnemius, red (14%) | 444 ± 48 | 391 ± 40 | 507 ± 42 | 3.21 ± 0.32 | 3.13 ± 0.28 | 4.07 ± 0.31*† |
| Gastrocnemius, white (100%) | 44 ± 7 | 42 ± 8 | 71 ± 14*† | 0.31 ± 0.05 | 0.32 ± 0.05 | 0.56 ± 0.10*† |
| Gastrocnemius, mixed (91%) | 153 ± 13 | 135 ± 12 | 214 ± 19*† | 1.11 ± 0.08 | 1.08 ± 0.10 | 1.71 ± 0.11*† |
| Tibialis posterior (73%) | 121 ± 18 | 111 ± 11 | 137 ± 22 | 0.88 ± 0.13 | 0.89 ± 0.09 | 1.10 ± 0.18 |
| Flexor digitorum longus (68%) | 103 ± 15 | 113 ± 19 | 106 ± 19 | 0.74 ± 0.10 | 0.92 ± 0.17 | 0.84 ± 0.15 |
| Flexor halicus longus (71%) | 74 ± 11 | 69 ± 11 | 88 ± 11 | 0.53 ± 0.07 | 0.55 ± 0.08 | 0.70 ± 0.07 |
| Ankle flexors | ||||||
| Tibialis anterior, red (63%) | 347 ± 38 | 303 ± 22 | 388 ± 35t | 2.50 ± 0.26 | 2.38 ± 0.16 | 3.08 ± 0.19† |
| Tibialis anterior, white (80%) | 120 ± 15 | 109 ± 11 | 170 ± 24*† | 0.86 ± 0.10 | 0.86 ± 0.08 | 1.34 ± 0.16*† |
| Extensor digitorum longus (76%) | 57 ± 8 | 60 ± 6 | 83 ± 13*† | 0.46 ± 0.05 | 0.47 ± 0.04 | 0.66 ± 0.09*† |
| Peroneals (67%) | 129 ± 13 | 123 ± 10 | 172 ± 8*† | 0.93 ± 0.09 | 0.98 ± 0.08 | 1.38 ± 0.05*† |
| Knee extensors | ||||||
| Vastus intermedius (4%) | 371 ± 41 | 320 ± 28 | 358 ± 54 | 2.68 ± 0.29 | 2.54 ± 0.23 | 2.88 ± 0.41 |
| Vastus medialis (82%) | 122 ± 18 | 111 ± 13 | 185 ± 36 | 0.88 ± 0.12 | 0.87 ± 0.10 | 1.48 ± 0.28*† |
| Vastus lateralis, red (35%) | 393 ± 47 | 327 ± 29 | 486 ± 48t | 2.84 ± 0.32 | 2.60 ± 0.23 | 3.91 ± 0.39*† |
| Vastus lateralis, white (100%) | 32 ± 5 | 33 ± 5 | 51 ± 10*† | 0.23 ± 0.03 | 0.26 ± 0.04 | 0.40 ± 0.07*† |
| Vastus lateralis, mixed (89%) | 169 ± 23 | 151 ± 14 | 243 ± 17*† | 1.23 ± 0.16 | 1.20 ± 0.11 | 1.95 ± 0.13*† |
| Rectus femoris, red (66%) | 233 ± 35 | 245 ± 15 | 33 ± 37*† | 1.69 ± 0.24 | 1.95 ± 0.13 | 2.64 ± 0.30*† |
| Rectus femoris, white (100%) | 103 ± 14 | 94 ± 8 | 197 ± 38*† | 0.74 ± 0.09 | 0.75 ± 0.06 | 1.55 ± 0.27*† |
| Knee flexors | ||||||
| Biceps femoris anterior (100%) | 49 ± 9 | 50 ± 7 | 77 ± 16*† | 0.36 ± 0.06 | 0.40 ± 0.05 | 0.63 ± 0.13*† |
| Biceps femoris posterior (92%) | 79 ± 9 | 81 ± 9 | 135 ± 13 | 0.57 ± 0.07 | 0.65 ± 0.07 | 1.09 ± 0.10*† |
| Semitendinosus (83%) | 57 ± 7 | 51 ± 5 | 80 ± 13*† | 0.41 ± 0.05 | 0.40 ± 0.04 | 0.63 ± 0.11*† |
| Semimembranosus, red (72%) | 120 ± 16 | 116 ± 10 | 172 ± 17*† | 0.87 ± 0.11 | 0.93 ± 0.10 | 1.38 ± 0.13*† |
| Semimembranosus, white (100%) | 34 ± 6 | 32 ± 4 | 67 ± 14*† | 0.25 ± 0.04 | 0.25 ± 0.03 | 0.54 ± 0.11*† |
| Thigh adductors | ||||||
| Adductor longus (5%) | 321 ± 42 | 268 ± 20 | 333 ± 51 | 2.32 ± 0.29 | 2.17 ± 0.20 | 2.66 ± 0.40 |
| Adductor magnus & brevis (89%) | 82 ± 9 | 71 ± 7 | 116 ± 19*† | 0.59 ± 0.06 | 0.60 ± 0.06 | 0.93 ± 0.14*† |
| Gracilis (77%) | 42 ± 5 | 41 ± 6 | 60 ± 11 | 0.30 ± 0.03 | 0.33 ± 0.06 | 0.48 ± 0.08* |
| Pectineus (69%) | 49 ± 7 | 59 ± 8 | 84 ± 17* | 0.35 ± 0.05 | 0.46 ± 0.06 | 0.68 ± 0.14*† |
Data are mean ± SEM. Values in parentheses indicate % type IIb + d/x according to Delp & Duan (1996). Control; n=10, BRLD; n=14 BRHD; n=6.
P<0.05 vs. control.
P<0.05 vs. BRLD.
Table 3.
Effects of low dose and high dose BR supplementation on kidney and splanchnic region organ BF (ml/min/100g) and VC (ml/min/100g/mmHg) at rest and during exercise.
| Rest | Exercise | |||||
|---|---|---|---|---|---|---|
|
|
|
|||||
| Control | BRLD | BRHD | Control | BRLD | BRHD | |
| BF | ||||||
| Kidney | 414 ± 29 | 447 ± 32 | 521 ± 32* | 421 ± 47 | 372 ± 35 | 436 ± 52† |
| Stomach | 82 ± 8 | 94 ± 13 | 71 ± 16 | 68 ± 15 | 51 ± 6† | 49 ± 9 |
| Adrenals | 557 ± 91 | 601 ± 57 | 667 ± 67 | 349 ± 79 | 321 ± 49 | 594 ± 188 |
| Spleen | 345 ± 54 | 332 ± 37 | 501 ± 134 | 63 ± 16† | 81 ± 14† | 99 ± 33† |
| Pancreas | 117 ± 11 | 112 ± 14 | 86 ± 15 | 115 ± 15 | 103 ± 10 | 116 ± 28 |
| Sm. Intestine | 304 ± 17 | 361 ± 38 | 269 ± 38 | 247 ± 30 | 238 ± 21† | 255 ± 53 |
| Lg. Intestine | 131 ± 13 | 153 ± 18 | 139 ± 18 | 135 ± 15 | 126 ± 13 | 142 ± 21 |
| Liver** | 37 ± 13 | 32 ± 6 | 40 ± 8 | 17 ± 4 | 18 ± 2 | 41 ± 11 |
| VC | ||||||
| Kidney | 3.04 ± 0.27 | 3.65 ± 0.32 | 4.15 ± 0.27* | 3.04 ± 0.31 | 3.13 ± 0.43 | 3.51 ± 0.44 |
| Stomach | 0.59 ± 0.06 | 0.75 ± 0.10 | 0.54 ± 0.09 | 0.50 ± 0.11 | 0.41 ± 0.05† | 0.39 ± 0.07 |
| Adrenals | 4.06 ± 0.72 | 4.71 ± 0.37 | 5.42 ± 0.80 | 2.86 ± 0.49 | 2.51 ± 0.37† | 4.79 ± 1.57 |
| Spleen | 2.50 ± 0.40 | 2.63 ± 0.27 | 3.71 ± 0.85 | 0.45 ± 0.11† | 0.64 ± 0.28† | 0.79 ± 0.28 |
| Pancreas | 0.85 ± 0.08 | 0.88 ± 0.11 | 0.65 ± 0.09 | 0.83 ± 0.11 | 0.83 ± 0.08 | 0.92 ± 0.23† |
| Sm. Intestine | 2.18 ± 0.14 | 2.87 ± 0.28 | 2.06 ± 0.25 | 1.72 ± 0.20 | 1.89 ± 0.17† | 2.00 ± 0.43 |
| Lg. Intestine | 0.95 ± 0.10 | 1.21 ± 0.14 | 1.09 ± 0.11 | 0.98 ± 0.10 | 1.00 ± 0.10 | 1.13 ± 0.16 |
| Liver** | 0.26 ± 0.12 | 0.21 ± 0.04 | 0.26 ± 0.05 | 0.12 ± 0.03 | 0.15 ± 0.02 | 0.32 ± 0.08 |
Data are mean ± SEM.
, P< 0.05 vs. Control.
, P < 0.05 vs. rest.
Indicates arterial, not portal, BF and VC.
Protocol 2: PO2mv parameters
Representative raw PO2mv profiles of control, BRLD and BRHD rats are presented in Figure 4. The responses were fit by a one-component model in 2 of 11 control, 6 of 12 BRLD and 2 of 5 BRHD rats while the more complex two-component model was utilized for the remainder. The r2 (control: 0.99 ± 0.01, BRLD: 0.98 ± 0.01, BRHD: 0.98 ± 0.01) and low sum of squared residuals (control: 20.2 ± 3.1, BRLD: 18.3 ± 2.7, BRHD: 21.1 ± 7 mmHg) for both groups supported that the model fits were suitable. Table 4 presents the average PO2mv baselines and kinetics parameters. There were no differences in the PO2mv (BL) between groups. However, following the onset of contractions BRHD, but not BRLD, demonstrated a longer TD1, smaller first-component amplitude and slower PO2mv kinetics (i.e., longer MRT1). Overall (i.e., PO2mv (BL) minus PO2mv (steady-state), ΔtotalPO2mv) amplitudes tended to be less in BRHD (P=0.06) but failed to reach statistical significance. There were no differences in PO2mv (steady-state) during contractions between groups.
Figure 4.
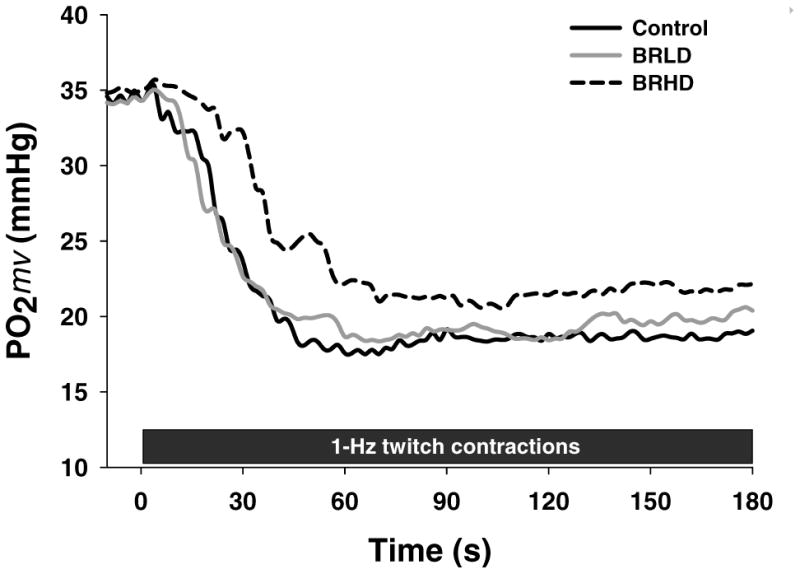
Raw representative PO2mv profiles for control, BRLD and BRHD rats during 180 s of 1-Hz twitch contractions.
Table 4.
Microvascular partial pressure of O2 (PO2mv) kinetics parameters at rest and during contractions for control, BRLD and BRHD rats
| Control | BRLD | BRHD | |
|---|---|---|---|
| PO2mv(BL) (mmHg) | 31.1 ± 2.0 | 30.1 ± 1.9 | 26.4 ± 2.8 |
| Δ1PO2mv (mmHg) | 16.7 ± 1.5 | 12.9 ± 0.7* | 11.8 ± 0.9* |
| Δ2PO2mv (mmHg) | 3.9 ± 0.8 | 3.6 ± .3 | 3.8 ± 0.4 |
| ΔtotalPO2mv (mmHg) | 13.6 ± 1.6 | 11.1 ± 1 | 9.6 ± 1.5 |
| PO2mv(steady-state)(mmHg) | 18 ± 1.7 | 19 ± 1.4 | 17.7 ± 2.0 |
| TD1 (s) | 6.7 ± 1.5 | 8.6 ± 0.9 | 12.9 ± 2.8* |
| TD2 (s) | 49.8 ± 11.2 | 54 ± 15.6 | 27 ± 5.5 |
| τ1 (s) | 9.9 ± 1.2 | 8.6 ± 0.9 | 10.4 ± 2.2 |
| τ2 (s) | 89.4 ± 18.7 | 93.9 ± 21.2 | 86.1 ± 10.9 |
| MRT1 (s) | 16.6 ± 2.1 | 20.9 ± 1.9 | 23.3 ± 4.7* |
| Δ1PO2mv/ τ1 (mmHg/s) | 1.9 ± 0.3 | 1.3 ± 0.2 | 1.4 ± 0.3 |
Values are mean ± SEM. Where second component model averages are shown the value reflects only those rats where a two-component model was applied to describe the PO2mv data (control: n=9, BRLD: n=6, BRHD: n=3). PmvO2(BL), pre-contraction PO2mv; Δ1PO2mv, amplitude of the first component; Δ2PO2mv, amplitude of the second component; ΔtotalPO2mv, overall amplitude regardless of one- or two-component model fit; PO2mv (steady-state), PO2mv during contracting steady-state; TD1, time delay for the first component; TD2, time delay for the second component; τ1, time constant for the first component; τ2, time constant for the second component; MRT1, mean response time describing the overall kinetics response; Δ1PO2mv/ τ1, parameter describing the relative rate of PO2mv fall.
P<0.05 vs. control.
4. Discussion
The principal original finding of this investigation is that low dose NO3- supplementation via beetroot juice (0.3 mmol/kg/day, BRLD), at levels consistent with a diet rich in leafy green vegetables consumed by humans, lowers resting and exercising MAP. Moreover, this occurred in the absence of increased exercising skeletal muscle BF and VC which are both elevated after higher supplementation doses (1 mmol/kg/day, BRHD). That BRLD impacts cardiovascular control at levels that do not detectably increase circulating NO3- or NO2- suggests that central mechanisms of cardiovascular control, possibly within the rostral ventrolateral medulla (RVLM) region of the brain, are extremely sensitive to altered dietary NO3- intake. Given that, in humans, reductions in systolic blood pressure of ∼10 mmHg (as seen with BRLD herein) have been estimated to decrease the risk of stroke by ∼35% and ischemic heart disease by ∼25% (MacMahon et al. 1990; Lewington et al. 2002; Law et al. 2003; Lawes et al. 2003; Larsen et al. 2007, 2010), these findings have strong potential clinical significance. It is also pertinent that employing low dose inorganic NO3- supplementation may avoid or reduce the opportunity for development of NO3- tolerance and endothelial dysfunction (Vanhatalo et al. 2010; Omar et al. 2012) which occur especially after chronic administration of organic NO3- (see Wylie et al. 2013a for discussion).
Relationship to existing literature
The randomly selected subset of data from results initially reported from our laboratory (Ferguson et al. 2013a) demonstrate clearly the effects of BRHD as regards elevated skeletal muscle(s) BF and VC and reduced MAP during treadmill running. Also, as demonstrated in Figure 4, PO2mv kinetics were slowed significantly and PO2mv decreased less during contractions of the spinotrapezius muscle, effectively raising the microvascular O2 driving pressure especially across the transition period when mitochondrial O2 uptake would be rising most rapidly (Ferguson et al. 2013b). These effects can be explained by the greater O2 delivery combined with a reduced mitochondrial O2 utilization at a given workload as demonstrated in intact humans (Larsen et al. 2007; Bailey et al. 2009; Larsen et al. 2010; Wylie et al. 2013a) as well as in isolated mitochondria (Larsen et al. 2012). With respect to the BRLD and based upon the dose-response relationship reported by Wylie et al. (2013a), where a graded fall in MAP was observed from 4.2 to 8.4 mmol NO3- (supplemented via BR with no additional decrease at 16.8 mmol), we were surprised that, in rats, MAP fell to the same extent (i.e., ∼10 mmHg) with both doses. Paramount to setting the NO3- supplement doses herein was the consideration of the faster metabolic rate found in the resting rat (∼27 ml/kg/min, Musch et al. 1988) when compared to humans (3.5ml/kg/min, i.e. ∼7-8 fold higher per unit mass, Henson et al. 1987). Taking this into account, the doses employed (i.e., BRLD, 0.3; BRHD, 1 mmol/kg/day) correspond broadly to 3.2 and 7.4 mmol/day, respectively in humans. Thus, with respect to species differences, the NO3-derived hypotensive response becomes saturated at lower doses in rats than in their human counterparts. This effect is very different from the skeletal muscle vascular response and that of PO2mv which are manifested only at the higher dose.
Mechanisms for reduction of mean arterial pressure
The increased VC observed in the skeletal muscle(s) of BRHD rats explain, at least in part, the reduction in MAP found at the higher dose. However, in marked contrast, skeletal muscle VC and BF were unchanged for BRLD (which was not unexpected given that circulating NO3-/NO2- levels were not different from control values) and thus, the reduced MAP for these animals must have a different explanation. There is evidence that NO bioavailability (from both endothelial and neuronal nitric oxide synthase, eNOS and nNOS) in higher cardiovascular neural control centers, for example the RVLM, impacts sympathetic outflow and controls, or at least influences, MAP regulation and can lead to a reduction and/or redistribution of cardiac output (e.g. Mayorov, 2005; Gao et al. 2008). Although not measured in this investigation, it is possible that BRLD may have altered NO bioavailability in the RVLM. Indeed, elevated NO bioavailability via overexpression of eNOS in the RVLM induces significant hypotension by elevating gamma-aminobutyric acid (GABA) production (Kishi et al. 2001). Thus, one putative mechanism for the hypotensive response invoked by BRLD relates to increased NO bioavailability in the RVLM from non-nNOS/eNOS dependent sources which may ultimately reduce sympathetic outflow. A greater NO3- dose may intensify this effect which could be responsible, at least in part, for the elevated renal BF and VC seen in BRHD rats herein. Furthermore, the presence of antioxidants in the BR supplement may contribute to this effect (Gao et al. 2007) and thus play a synergistic role with NO3-. This novel aspect of BR and NO3- mediated cardiovascular control carries clinical implications for those suffering from renal vascular diseases (Lundberg et al. 2008; Carlstöm et al. 2011) and warrants future investigation.
Alternative mechanisms of BR induced reductions in MAP include impacts on other vascular beds, apart from the skeletal muscle vasculature. For example, BRHD rats demonstrated 26% greater renal BF at rest (Table 3) suggesting that the renal circulation may be prone to NO2- induced vascular effects. Given that resting renal BF was not significantly elevated in BRLD rats, this particular effect may require greater local concentrations of NO2- to elicit significant vascular effects within the renal circulation. While not statistically significant, a mild impact of the renal circulation on the resting MAP of BRLD rats is certainly plausible and should be investigated further. What's more, the lower PO2 environment of the venous circulation may enhance the reduction of circulating NO2- to NO and other reactive nitrogen species, which would likely cause venodilation and a reduction in MAP. This effect would likely be exacerbated during exercise due to the robust reductions in venous blood PO2 (to values <30 mmHg, Gonzalez et al. 1994) offering a partial explanation for the lower exercising MAP values presented in figure 2.
Experimental considerations
The rat is a widely used and valuable experimental model to study cardiovascular and muscle metabolic control particularly during exercise. Moreover, dietary, pharmaceutical and exercise conditions can be well controlled and standardized within this population. However, determination of “equivalent” NO3- doses is challenging and basing such on resting metabolic rate differences found between rats and humans is only a first approximation. Importantly, in the BRHD group plasma [NO3-] and [NO2-] were raised to levels approximating those seen in humans following consumption of a dietary supplement high in NO3- (Lundberg & Govoni, 2004; Kenjale et al. 2011) providing additional confidence in the doses used herein. What is particularly exciting with respect to the present results is that BRLD represented a dose that evinced clear cardiovascular responses in the absence of a significant increase in plasma NO3- or NO2- and the vascular and metabolic consequences of such. This observation unveils a novel, potentially exciting, and heretofore unappreciated consequence of BR-derived NO3-supplementation.
Conclusions
This investigation was the first to examine the effects of a low (0.3 mmol/kg/day) and high (1 mmol/kg/day) dose of NO3- supplementation on vascular responses at rest and during submaximal locomotory exercise in the rat. Despite the absence of elevations of plasma [NO3-] or [NO2-], BRLD evoked reductions in MAP at rest and during exercise. These cardiovascular improvements were further amplified in BRHD rats which demonstrated augmented skeletal muscle BF and VC, which likely resulted in the slowed PO2mv fall during the crucial rest-contraction transition presented herein. These results carry tremendous clinical implications particularly for those at risk for stroke, renal, and ischemic heart diseases (MacMahon et al. 1990; Lewington et al. 2002; Law et al. 2003; Lawes et al. 2003; Larsen et al. 2007, 2010; Tsuchiya et al. 2010; Carlström et al. 2011). Given the sensitivity of the RVLM to NO bioavailability (Mayorov, 2005; Gao et al. 2008), it seems logical to postulate an interaction between NO3-, NO2- and central cardiovascular control centers located in the brain (i.e. RVLM). Understanding these interactions will further provide a mechanistic linkage between elevated NO3- ingestion and the improved cardiovascular and metabolic function seen in humans (Bailey et al. 2009, 2010; Larsen et al. 2010; Kenjale et al. 2011; Vanhatalo et al. 2011; Masschelein et al. 2012; Wylie et al. 2013b) and animals (Ferguson et al. 2013a,b; Hernandez et al. 2013) and thus should be the focus of future investigations.
Highlights.
High dose nitrate supplementation has been shown to impact skeletal muscle vascular function in healthy animals.
The effects of a lower (more ecologically relevant) dose remain unknown.
Impacts of low (0.3 mmol/kg/day) and high (1 mmol/kg/day) dose of nitrate supplementation was investigated.
Both high and low doses evoked changes in mean arterial pressure during exercise.
High but not low dose nitrate supplementation evoked significant vascular effects.
Acknowledgments
The authors would like to thank Ms. K. Sue Hageman, Ms. Gabrielle E. Rico, Thomas Stabler, and Dr. Tadakatsu Inagaki for excellent technical assistance. These experiments were funded by a Kansas State University SMILE award to TIM, and American Heart Association Midwest Affiliate (10GRNT4350011) and NIH (HL-108328) awards to DCP.
References
- Andrade FH, Reid MB, Allen DG, Westerblad H. Effect of nitric oxide on single skeletal muscle fibres from the mouse. J Physiol (Lond) 1998;509:577–586. doi: 10.1111/j.1469-7793.1998.577bn.x. [DOI] [PMC free article] [PubMed] [Google Scholar]
- Armstrong RB, Hayes DA, Delp MD. Blood flow distribution in rat muscles during preexercise anticipatory response. J Appl Physiol. 1989;67:1855–1861. doi: 10.1152/jappl.1989.67.5.1855. [DOI] [PubMed] [Google Scholar]
- Bailey JK, Kindig CA, Behnke BJ, Musch TI, Schmid Schoenbein GW, Poole DC. Spinotrapezius muscle microcirculatory function: effects of surgical exteriorization. American journal of physiology Heart and circulatory physiology. 2000;279:H3131–H3137. doi: 10.1152/ajpheart.2000.279.6.H3131. [DOI] [PubMed] [Google Scholar]
- Bailey SJ, Fulford J, Vanhatalo A, Winyard PG, Blackwell JR, DiMenna FJ, Wilkerson DP, Benjamin N, Jones AM. Dietary nitrate supplementation enhances muscle contractile efficiency during knee-extensor exercise in humans. J Appl Physiol. 2010;109:135–148. doi: 10.1152/japplphysiol.00046.2010. [DOI] [PubMed] [Google Scholar]
- Bailey SJ, Winyard P, Vanhatalo A, Blackwell JR, Dimenna FJ, Wilkerson DP, Tarr J, Benjamin N, Jones AM. Dietary nitrate supplementation reduces the O2 cost of low-intensity exercise and enhances tolerance to high-intensity exercise in humans. J Appl Physiol. 2009;107:1144–1155. doi: 10.1152/japplphysiol.00722.2009. [DOI] [PubMed] [Google Scholar]
- Carlström M, Persson AE, Larsson E, Hezel M, Scheffer PG, Teerlink T, Weitzberg E, Lundberg JO. Dietary nitrate attenuates oxidative stress, prevents cardiac and renal injuries, and reduces blood pressure in salt-induced hypertension. Cardiovasc Res. 2011;89:574–585. doi: 10.1093/cvr/cvq366. [DOI] [PubMed] [Google Scholar]
- Delp MD, Duan C. Composition and size of type I, IIA, IID/X, and IIB fibers and citrate synthase activity of rat muscle. J Appl Physiol. 1996;80:261–270. doi: 10.1152/jappl.1996.80.1.261. [DOI] [PubMed] [Google Scholar]
- Ferguson SK, Hirai DM, Copp SW, Holdsworth CT, Allen JD, Jones AM, Musch TI, Poole DC. Effects of nitrate supplementation via beetroot juice on contracting rat skeletal muscle microvascular oxygen pressure dynamics. Respiratory Physiology Neurobiology. 2013a;187:250–255. doi: 10.1016/j.resp.2013.04.001. [DOI] [PMC free article] [PubMed] [Google Scholar]
- Ferguson SK, Hirai DM, Copp SW, Holdsworth CT, Allen JD, Jones AM, Musch TI, Poole DC. Impact of dietary nitrate supplementation via beetroot juice on exercising muscle vascular control in rats. J Physiol (Lond) 2013b;591:547–557. doi: 10.1113/jphysiol.2012.243121. [DOI] [PMC free article] [PubMed] [Google Scholar]
- Flaim SF, Nellis SH, Toggart EJ, Drexler H, Kanda K, Newman ED. Multiple simultaneous determinations of hemodynamics and flow distribution in conscious rat. J Pharmacol Methods. 1984;11:1–39. doi: 10.1016/0160-5402(84)90050-0. [DOI] [PubMed] [Google Scholar]
- Gao L, Wang W, Liu D, Zucker Irving IH. Exercise training normalizes sympathetic outflow by central antioxidant mechanisms in rabbits with pacing-induced chronic heart failure. Circulation. 2007;115:3095–3102. doi: 10.1161/CIRCULATIONAHA.106.677989. [DOI] [PubMed] [Google Scholar]
- Gao L, Wang W, Zucker IL. Simvastatin inhibits central sympathetic outflow in heart failure by a nitric-oxide synthase mechanism. J Pharmacol Exp Ther. 2008;326:278–285. doi: 10.1124/jpet.107.136028. [DOI] [PMC free article] [PubMed] [Google Scholar]
- Gonzalez NC, Erwid LP, Painter CF, 3rd, Clancy RL, Wagner PD. Effect of hematocrit on systemic O2 transport in hypoxic and normoxic exercise in rats. J Appl Physiol. 1994;77:1341–1348. doi: 10.1152/jappl.1994.77.3.1341. [DOI] [PubMed] [Google Scholar]
- Henson LC, Poole DC, Donahoe CP, Heber D. Effects of exercise training on resting energy expenditure during caloric restriction. Am J Clin Nutr. 1987;46:893–899. doi: 10.1093/ajcn/46.6.893. [DOI] [PubMed] [Google Scholar]
- Hernández A, Schiffer TA, Ivarsson N, Cheng AJ, Bruton JD, Lundberg JO, Weitzberg E, Westerblad H. Dietary nitrate increases tetanic [Ca2+] and contractile force in mouse fast-twitch muscle. J Physiol (Lond) 2012;590:3575–3583. doi: 10.1113/jphysiol.2012.232777. [DOI] [PMC free article] [PubMed] [Google Scholar]
- Joyner MJ, Tschakovsky ME. Nitric oxide and physiologic vasodilation in human limbs: where do we go from here? Canadian journal of applied physiology. 2003;28:475–490. doi: 10.1139/h03-035. [DOI] [PubMed] [Google Scholar]
- Joyner MJ, Wilkins BW. Exercise hyperaemia: is anything obligatory but the hyperaemia? J Physiol (Lond) 2007;583:855–860. doi: 10.1113/jphysiol.2007.135889. [DOI] [PMC free article] [PubMed] [Google Scholar]
- Kenjale AA, Ham KL, Stabler T, Robbins JL, Johnson J, Vanbruggen M, Privette G, Yim E, Kraus WE, Allen JD. Dietary nitrate supplementation enhances exercise performance in peripheral arterial disease. J Appl Physiol. 2011;110:1582–1591. doi: 10.1152/japplphysiol.00071.2011. [DOI] [PMC free article] [PubMed] [Google Scholar]
- Kishi T, Hirooka Y, Sakai K, Shigematsu H, Shimokawa H, Takeshita A. Overexpression of eNOS in the RVLM causes hypotension and bradycardia via GABA release. Hypertension. 2001;38:896–901. [PubMed] [Google Scholar]
- Lansley KE, Winyard PG, Bailey SJ, Vanhatalo A, Wilkerson DP, Blackwell JR, Gilchrist M, Benjamin N, Jones AM. Acute dietary nitrate supplementation improves cycling time trial performance. Med Sci Sports Exerc. 2011a;43:1125–1131. doi: 10.1249/MSS.0b013e31821597b4. [DOI] [PubMed] [Google Scholar]
- Lansley KE, Winyard PG, Fulford J, Vanhatalo A, Bailey SJ, Blackwell JR, Dimenna FJ, Gilchrist M, Benjamin N, Jones AM. Dietary nitrate supplementation reduces the O2 cost of walking and running: a placebo-controlled study. J Appl Physiol. 2011b;110:591–600. doi: 10.1152/japplphysiol.01070.2010. [DOI] [PubMed] [Google Scholar]
- Larsen FJ, Weitzberg E, Lundberg JO, Ekblom B. Dietary nitrate reduces maximal oxygen consumption while maintaining work performance in maximal exercise. Free Radic Biol Med. 2010;48:342–347. doi: 10.1016/j.freeradbiomed.2009.11.006. [DOI] [PubMed] [Google Scholar]
- Larsen FJ, Weitzberg E, Lundberg JO, Ekblom B. Effects of dietary nitrate on oxygen cost during exercise. Acta physiologica. 2007;191:59–66. doi: 10.1111/j.1748-1716.2007.01713.x. [DOI] [PubMed] [Google Scholar]
- Larsen FJ, Schiffer TA, Weitzberg E, Lundberg JO. Regulation of mitochondrial function and energetics by reactive nitrogen oxides. Free radical biology medicine. 2012;53:1919–1928. doi: 10.1016/j.freeradbiomed.2012.08.580. [DOI] [PubMed] [Google Scholar]
- Law MR, Wald NJ, Morris JK, Jordan RE. Value of low dose combination treatment with blood pressure lowering drugs: analysis of 354 randomized trials. BMJ British medical journal. 2003;326:1427–1427. doi: 10.1136/bmj.326.7404.1427. [DOI] [PMC free article] [PubMed] [Google Scholar]
- Lawes CM, Rodgers A, Bennett DA, Parag V, Suh I, Ueshima H, MacMahon S. Blood pressure and cardiovascular disease in the Asia Pacific region. J Hypertens. 2003;21:707–716. doi: 10.1097/00004872-200304000-00013. [DOI] [PubMed] [Google Scholar]
- Leek BT, Mudaliar SR, Henry R, Mathieu Costello O, Richardson RS. Effect of acute exercise on citrate synthase activity in untrained and trained human skeletal muscle. American journal of physiology Regulatory, integrative and comparative physiology. 2001;280:R441–R447. doi: 10.1152/ajpregu.2001.280.2.R441. [DOI] [PubMed] [Google Scholar]
- Lewington S, Clarke R, Qizilbash N, Peto R, Collins R. Age-specific relevance of usual blood pressure to vascular mortality: a meta-analysis of individual data for one million adults in 61 prospective studies. Lancet (London, England) 2002;360:1903–1913. doi: 10.1016/s0140-6736(02)11911-8. [DOI] [PubMed] [Google Scholar]
- Lo LW, Vinogradov SA, Koch CJ, Wilson DF. A new, water soluble, phosphor for oxygen measurements in vivo. Adv Exp Med Biol. 1997;428:651–656. doi: 10.1007/978-1-4615-5399-1_91. [DOI] [PubMed] [Google Scholar]
- Lundberg JO, Govoni M. Inorganic nitrate is a possible source for systemic generation of nitric oxide. Free Radic Biol Med. 2004;37:395–400. doi: 10.1016/j.freeradbiomed.2004.04.027. [DOI] [PubMed] [Google Scholar]
- Lundberg JO, Weitzberg E, Gladwin MT. The nitrate-nitrite-nitric oxide pathway in physiology and therapeutics. Nat Rev Drug Discov. 2008;7:156–167. doi: 10.1038/nrd2466. [DOI] [PubMed] [Google Scholar]
- MacMahon S, Peto R, Cutler J, Collins R, Sorlie P, Neaton J, Abbott R, Godwin J, Dyer A, Stamler J. Blood pressure, stroke, and coronary heart disease. Part 1, Prolonged differences in blood pressure: prospective observational studies corrected for the regression dilution bias. Lancet (London, England) 1990;335:765–774. doi: 10.1016/0140-6736(90)90878-9. [DOI] [PubMed] [Google Scholar]
- Masschelein E, Van Thienen R, Wang X, Van Schepdael A, Thomis M, Hespel P. Dietary nitrate improves muscle but not cerebral oxygenation status during exercise in hypoxia. J Appl Physiol. 2012;113:736–735. doi: 10.1152/japplphysiol.01253.2011. [DOI] [PubMed] [Google Scholar]
- Mayorov DN. Selective sensitization by nitric oxide of sympathetic baroreflex in rostral ventrolateral medulla of conscious rabbits. Hypertension. 2005;45:901–906. doi: 10.1161/01.HYP.0000160322.83725.6b. [DOI] [PubMed] [Google Scholar]
- Musch TI, Bruno A, Bradford GE, Vayonis A, Moore RL. Measurements of metabolic rate in rats: a comparison of techniques. J Appl Physiol. 1988;65:964–970. doi: 10.1152/jappl.1988.65.2.964. [DOI] [PubMed] [Google Scholar]
- Musch TI, Terrell JA. Skeletal muscle blood flow abnormalities in rats with a chronic myocardial infarction: rest and exercise. Am J Physiol. 1992;262:H411–H419. doi: 10.1152/ajpheart.1992.262.2.H411. [DOI] [PubMed] [Google Scholar]
- Omar SA, Artime E, Webb AJ. A comparison of organic and inorganic nitrates/nitrites. Nitric Oxide. 2012;26:229–240. doi: 10.1016/j.niox.2012.03.008. [DOI] [PubMed] [Google Scholar]
- Poole DC, Behnke BJ, McDonough P, McAllister RM, Wilson DF. Measurement of muscle microvascular oxygen pressures: compartmentalization of phosphorescent probe. Microcirculation. 2004;11:317–326. doi: 10.1080/10739680490437487. [DOI] [PubMed] [Google Scholar]
- Rumsey WL, Vanderkooi JM, Wilson DF. Imaging of phosphorescence: a novel method for measuring oxygen distribution in perfused tissue. Science. 1988;241:1649–1651. doi: 10.1126/science.241.4873.1649. [DOI] [PubMed] [Google Scholar]
- Tsuchiya K, Tomita S, Ishizawa K, Abe S, Ikeda Y, Kihira Y, Tamaki T. Dietary nitrite ameliorates renal injury in L-NAME-induced hypertensive rats. Nitric Oxide. 2010;22:98–103. doi: 10.1016/j.niox.2009.12.002. [DOI] [PubMed] [Google Scholar]
- Vanhatalo A, Bailey SJ, Blackwell JR, DiMenna FJ, Pavey T, Wilkerson DP, Benjamin N, Winyard PG, Jones AM. Acute and chronic effects of dietary nitrate supplementation on blood pressure and the physiological responses to moderate-intensity and incremental exercise. American Journal of Physiology: Regulatory, Integrative and Comparative Physiology. 2010;299:R1121–R1131. doi: 10.1152/ajpregu.00206.2010. [DOI] [PubMed] [Google Scholar]
- Vanhatalo A, Fulford J, Bailey SJ, Blackwell JR, Winyard PJ, Jones AM. Dietary nitrate reduces muscle metabolic perturbation and improves exercise tolerance in hypoxia. J Physiol (Lond) 2011;589:5517–5528. doi: 10.1113/jphysiol.2011.216341. [DOI] [PMC free article] [PubMed] [Google Scholar]
- Wylie LJ, Kelly J, Bailey SJ, Blackwell JR, Skiba PF, Winyard PG, Jeukendrup AE, Vanhatalo A, Jones AM. Beetroot juice and exercise: pharmacodynamic and dose-response relationships. J Appl Physiol. 2013a;115:325–336. doi: 10.1152/japplphysiol.00372.2013. [DOI] [PubMed] [Google Scholar]
- Wylie LJ, Mohr M, Krustrup P, Jackman SR, Ermidis G, Kelly J, Black MI, Bailey SJ, Vanhatalo A, Jones AM. Dietary nitrate supplementation improves team sport-specific intense intermittent exercise performance. Eur J Appl Physiol. 2013b;113:1673–1684. doi: 10.1007/s00421-013-2589-8. [DOI] [PubMed] [Google Scholar]