

Background: Hypoxia and growth factors synergistically enhance tumor cell invasiveness through poorly defined mechanisms.
Results: Molecular signaling pathways mediating tumor cell invasion driven by hypoxia and growth factors were identified.
Conclusion: The integration of three major signaling cascades controls invasive synergy.
Significance: This knowledge informs strategies to predict and disrupt tumor invasiveness.
Keywords: Cancer, Cell Invasion, Hepatocyte Growth Factor/Scatter Factor (HGF/SF), Hypoxia, Tumor Metastasis
Abstract
Hepatocyte growth factor (HGF) signaling promotes tumor invasiveness in renal cell carcinoma (RCC) and other cancers. In clear cell RCC, VHL loss generates pseudohypoxia that exacerbates HGF-driven invasion through β-catenin deregulation. Hypoxia also enhances HGF-driven invasiveness by papillary RCC cells, but in the absence of VHL, loss signaling integration involves three parallel routes: 1) hypoxia-induced reactive oxygen species production and decreased DUSP2 expression, leading to enhanced mitogen-activated protein kinase (MAPK) cascade activation; 2) reactive oxygen species-induced diacylglycerol production by phospholipase Cγ, leading to protein kinase C activation and increased protein phosphatase-2A activity, thereby suppressing HGF-induced Akt activation; and 3) a profound shift from HGF-enhanced, proliferation-oriented metabolism to autophagy-dependent invasion and suppression of proliferation. This tripartite signaling integration was not unique to RCC or HGF; in RCC cells, invasive synergy induced by the combination of hypoxia and epidermal growth factor occurred through the same mechanism, and in estrogen receptor-positive breast cancer cells, this mechanism was suppressed in the absence of estrogen. These results define the molecular basis of growth factor and hypoxia invasive synergy in VHL-competent papillary RCC cells, illustrate the plasticity of invasive and proliferative tumor cell states, and provide signaling profiles by which they may be predicted.
Introduction
Collectively, kidney cancers are the seventh most common cancer in men and the ninth most common in women (1). Although patients who present with localized disease have a 95% 5-year survival rate, it is only 26% for those with advanced disease (1); the development of novel therapeutic approaches needed to improve the latter survival rate will benefit from understanding the molecular basis of kidney tumor invasiveness and metastasis. Clear cell renal cell carcinoma, the most prevalent type of kidney cancer, is associated with the loss of VHL (von Hippel-Lindau) tumor suppressor gene function (1). The VHL gene product, pVHL, is part of an E3 ubiquitin ligase complex that targets hypoxia-inducible factors (HIFs)2 for proteasomal degradation, implicating a wide spectrum of hypoxia response genes in clear cell renal cell carcinoma oncogenesis (1). pVHL loss also enables robust clear cell renal cell carcinoma cell invasiveness and morphogenesis in response to hepatocyte growth factor (HGF) (2, 3), an important regulator of kidney development and renal homeostasis (4). Interestingly, this does not occur as a consequence of HIF accumulation but rather because pVHL negatively regulates cytoplasmic β-catenin abundance downstream of HGF receptor (Met) activation, and pVHL loss enables β-catenin and HIF-mediated transcriptional initiation of an aggressive invasive program (4, 5).
HGF signaling also contributes to disease progression, tumor invasiveness, and metastasis in kidney cancers other than the clear cell type; in particular, MET kinase domain mutations in a hereditary form of papillary renal carcinoma are primary drivers of that disease, and Met overabundance is common in both hereditary and sporadic forms (1, 6). VHL loss of function is rare in papillary renal carcinoma, but tumor hypoxia is not; hypoxia strongly enhances HGF-mediated invasiveness and metastasis in a variety of model systems, through largely undefined molecular mechanisms (7–13). HGF and hypoxia signaling integration occurs during nephrogenesis (14–16), so this effect may represent the aberrant reinitiation of a developmental program. However, HGF-driven β-catenin transcriptional activity is suppressed when VHL is functional (17), suggesting that the integration of hypoxia and HGF-driven cell invasiveness involves other primary intracellular signaling routes downstream of Met. We report here that multiple pathways, including the mitogen-activated protein kinase (MAPK) and phosphatidylinositol-4,5-bisphosphate 3-kinase (PI3K) pathways, mediate the synergistic invasiveness triggered by HGF and hypoxia, which further entails induction of autophagy and growth suppression.
EXPERIMENTAL PROCEDURES
Reagents
Tissue culture media and supplements were obtained from Invitrogen. Antibodies against phospho-Met (1234/1235), pERK, tERK, pAkt, tAkt, pPKCα/β, tPKCα, and LC3B were obtained from Cell Signaling Technology (Danvers, MA). Anti-Met (C-28) was obtained from Santa Cruz Biotechnology, Inc. PP2A was obtained from DSHB (Iowa City, IA). U0126 and LY294002 PI3K were obtained from Selleckchem.com (Houston, TX). Purified recombinant human HGF was obtained from ProSpec. CoCl2 was obtained from Sigma-Aldrich, and DMOG was from Cayman Chemical Co. (Ann Arbor, MI). Hypoxia chambers were obtained from Billups-Rothenberg (Del Mar, CA).
Cell Culture
ACHN, A549, and MCF7 cells were obtained from ATCC (Manassas, VA). UOK112 cells were generated in the Urologic Oncology Branch (NCI, National Institutes of Health). Cells were cultured in RPMI 1640 medium without sodium pyruvate unless noted, containing 10% FBS and antibiotic-antimycotic. Cells were grown in 5% CO2 at 37 °C, and hypoxic conditions were generated according to the manufacturer's instructions (Billups-Rothenberg). The oxygen level in hypoxic conditions was measured as 1.5 ± 0.1% using an oxygen gas detector (BW Technologies, Calgary, Canada). Throughout this work, the term “hypoxia” refers to this oxygen level.
SDS-PAGE, Immunoblot Analysis, and Two-site Immunoassays
Cells were washed with cold PBS, extracted in Laemmli buffer, sonicated, and heated for 5 min at 95 °C prior to SDS-PAGE and electrophoretic transfer to nitrocellulose membrane. Membranes were blocked with 5% milk in TBST (Tris-buffered saline, 0.1% Tween 20) for 1 h at 25 °C and then incubated for 16 h at 4 °C with primary antibody in TBST, 0.5% milk. Membranes were washed three times with TBST, incubated with horseradish peroxidase-labeled secondary antibody for 1 h at 25 °C, and washed for 3 h with TBS prior to ECL detection (Pierce). Phosphorylated and total Met contents in Triton X-100 cell extracts were determined by an electrochemiluminescent immunoassay read using a SectorImager 2400 (Meso Scale Discovery, Gaithersburg, MD) as described previously (18).
Phosphatase Assays
PP2A phosphatase activity in immunoprecipitates was determined using para-nitrophenyl phosphate as substrate. For immunoprecipitation, cells were extracted with buffer containing 1% Triton X-100 and cleared by centrifugation, and aliquots (250 μg of cell protein) were incubated with 2 μg of PP2A antibody and 20 μl of protein G-Sepharose beads for 16 h at 4 °C. Immunoprecipitates were washed three times with cold lysis buffer and three times with phosphatase buffer (50 mm HEPES, 10 mm MnCl2, 1 mm DTT, and protease inhibitors). The pellet was reconstituted in phosphatase assay buffer, and para-nitrophenyl phosphate was added to a final concentration of 20 mm. The reaction mixture was incubated in 30 °C for 1 h, and absorbance was read at 405 nm.
MTT Assays
Cells were plated at a density of 7.5 × 10³ cells/well in 96-well plates. Cells were treated, and after 24–48 h, 20 μl of 5 mg/ml MTT was added to each well, and plates were incubated at 37 °C for 4 h. The solution was removed, and DMSO was added to dissolve formazan crystals; plates were shaken for 15 min, and absorbance at 590 nm was read with a reference filter of 620 nm.
RNA Isolation and RT-PCR
Total RNA was obtained by using the RNeasy kit (Qiagen, Valencia, CA). RNA concentrations were determined spectroscopically at 260 nm (ND-1000 spectrophotometer, NanoDrop (Wilmington, DE)). RNA (1.0 μg) was subjected to RT with GeneAmp RNA polymerase chain reaction (PCR) kits according to the manufacturer's protocol (Applied Biosystems, Foster City, CA). Real-time PCR was performed according to the manufacturer's protocol using a 7500 real-time PCR system (Applied Biosystems).
Cell Migration, Invasion, and Proliferation Assays
Cell monolayers grown in 35-mm culture dishes in complete growth media were wounded by manual scratching with a pipette tip, washed with PBS, and photographed by phase-contrast microscopy at time 0. Matched wound region pairs were photographed again after 24 h, and the percentage of cell migration was quantified using ImageJ version 1.47 software (National Institutes of Health, Bethesda, MD). Invasion assays were performed using 8-μm pore size BD Biosciences BioCoat Matrigel invasion chambers or Fluoroblok-BioCoat BD Matrigel invasion chambers (San Jose, CA) according to the manufacturer's instructions. Images were captured by light or fluorescence microscopy, and image analysis and quantitation were performed using ImageJ. For proliferation assays, cells were plated in triplicate at a density of 5 × 10⁴ cells/35-mm dish in defined medium. HGF and/or CoCl2 were added on days 1, 2, and 4. Cells were detached and counted using a hemocytometer on day 3 or 6.
Cell Cycle Analysis
ACHN cells were grown without sodium pyruvate and treated with CoCl2 and/or HGF for 24 h. Cells were then harvested, spun, washed, counted, and resuspended in PBS and fixed with methanol prior to storage at −20 °C for 24 h. Thawed cells were spun and resuspended in cold PBS, and propidium iodide (50 μg/ml) was added prior to analysis using a BD Biosciences LSRII flow cytometer and data processing using ModFit LT software.
Statistical Analysis
Significant differences between two groups were determined by Student's t test using GraphPad Prism 5 software, where p < 0.05 was considered statistically significant.
RESULTS
Hypoxia Enhances HGF-induced Cell Invasion but Inhibits Proliferation
We examined the effects of hypoxia on HGF/Met-induced invasion by the human renal papillary carcinoma-derived cell lines ACHN and UOK112, the lung adenocarcinoma cell line A549, and the breast cancer-derived cell line MCF7. Invasion, measured as migration across Matrigel-coated Boyden chambers, was significantly increased by HGF in all cell lines (Fig. 1A). Hypoxia alone (1.5% O2) also induced cell invasion, generally to a lesser degree than HGF, whereas the combined effects of hypoxia and HGF were synergistic (i.e. 8–20-fold greater) in ACHN, UOK112, and A549 cells and at least additively greater in MCF7 (Fig. 1A). Similar effects were observed using the hypoxia mimetic agent CoCl2, which stabilizes HIF1α by competing with iron for binding to prolyl hydroxylase, thereby preventing HIF1α prolyl hydroxylation, pVHL recognition, and proteasomal degradation. HGF and CoCl2 induced cell migration (data not shown) and invasion (Fig. 1B), and the combination significantly enhanced migration and invasion in all cells tested, again less dramatically in MCF7 cells.
FIGURE 1.

Hypoxia enhances HGF-driven invasion and suppresses proliferation. A, cell types indicated were incubated in normoxia (N, left) or hypoxia (H, right) and otherwise left untreated (unfilled bars) or treated with HGF (0.5 nm; light gray bars), hypoxia (dark gray bars), or HGF + hypoxia (black bars) for 24 h in Matrigel-coated Boyden chambers, and cell invasion across the membranes was quantitated photomicrographically. This grayscale scheme is used in the bar graphs throughout the paper; bars represent the mean of triplicate samples ± S.D. (error bars); some error bars are too small to be visible. Data are representative of three independent experiments (*, p < 0.001 versus untreated; **, p < 0.05 HGF versus HGF + hypoxia). B, cell types indicated were incubated in normoxia (N, left) or hypoxia (H, right) and otherwise left untreated (unfilled) or treated with HGF (light gray), CoCl2 (100 μm; dark gray), or HGF + CoCl2 (black) for 24 h in Matrigel-coated Boyden chambers, and cell invasion across the membranes was quantitated photomicrographically. Bars, mean of triplicate samples ± S.D. Data are representative of three independent experiments (*, p < 0.001 versus untreated; **, p < 0.05 HGF versus HGF + hypoxia). C, proliferation of ACHN cells left untreated (circles) or treated with HGF (squares), 100 μm CoCl2 (triangles), or HGF + CoCl2 (inverted triangles). HGF treatments were on days 1 and 4; HGF and/or CoCl2 treatments were on days 5, 8, and 11. Cells were counted on days 0, 3, 6, 9, and 12. D, cells from C were detached after counting and placed in Matrigel-coated Boyden chambers for invasion assays (*, p < 0.05; **, p = 0.006). Bars, mean of triplicate samples ± S.D.; some error bars are too small to be visible. E, cell types indicated below each graph were treated with CoCl2 (100 μm) for 24 h, followed by a 20-min exposure to HGF (0.5 nm) before extraction with non-ionic detergent and measurement of phospho-Met (pMet) by electrochemiluminescent immunoassay. Bars, mean of triplicate samples ± S.D.; some error bars are too small to be visible.
The combination of hypoxia and HGF also affected cell proliferation. ACHN cells were plated (day 0) and left untreated or treated with HGF on days 1, 4, 5, 8, and 11; for the latter 3 days, one group was treated with CoCl2, and another received combined HGF/CoCl2 treatment. A significant increase in proliferation rate associated with HGF treatment relative to all other groups was evident by day 12 (Fig. 1C). CoCl2 alone had no significant effect, whereas cells treated with both HGF and CoCl2 proliferated significantly more slowly relative to those treated with HGF alone, indicating that hypoxia inhibits HGF-induced cell growth (Fig. 1C). Immediately after counting, samples of suspended cells were analyzed for invasiveness and, consistent with prior results, CoCl2 significantly enhanced the HGF-induced cell invasion (Fig. 1D). As anticipated, all of these HGF-driven effects were associated with immediate and significant Met kinase activation (Fig. 1E); Met activation and Met content (ACHN, 118 ng of Met/mg of total protein; A549, 66 ng/mg; MCF7, 0.6 ng/mg) were unaffected by CoCl2 treatment (data not shown).
Hypoxia-enhanced MAPK Pathway Activity Augments HGF-driven Invasion
Activation of the PI3K and MAPK pathways downstream of Met mediates HGF-driven cell survival, migration, invasion, and proliferation. ACHN, A549, UOK112, and MCF7 cells cultured in complete (serum-containing) growth media under hypoxic conditions for 24 h were immunoblotted for HIF1α, pAkt, tAkt, pERK, and tERK to determine the effects of hypoxia on these pathways. Increased HIF1α protein abundance and pERK/tERK ratio were uniformly observed; the pAkt/tAkt ratio was markedly diminished with hypoxia in ACHN, A549, and UOK112 cell lines but not in MCF7 (Fig. 2A, left). The combined effects of HGF-induced Akt and ERK activation and hypoxia were analyzed in ACHN and A549 cells grown in serum-reduced media (Fig. 2A, right). HGF treatment increased the pAkt/tAkt and pERK/tERK ratios under normoxic conditions in both cell lines relative to untreated controls (Fig. 2A, right). HGF and hypoxia had additive effects on the pERK/tERK ratio, whereas hypoxia abrogated HGF effects on the pAkt/tAkt ratio (Fig. 2A, right). Consistent with these results, time courses of CoCl2- or DMOG-induced pseudohypoxia were associated with trends of increasing HIF1α abundance and ERK activation, but decreasing Akt activation, over 24 h (Fig. 2B). At steady state after 24 h of CoCl2 or DMOG treatment followed by 20 min of HGF stimulation, pERK enhancement, and suppression of HGF-induced pAkt in ACHN, A549 and UOK112 cells, as observed by immunoblotting (Fig. 2C, left panels), were determined to be statistically significant by densitometry (Fig. 2C, right panels).
FIGURE 2.
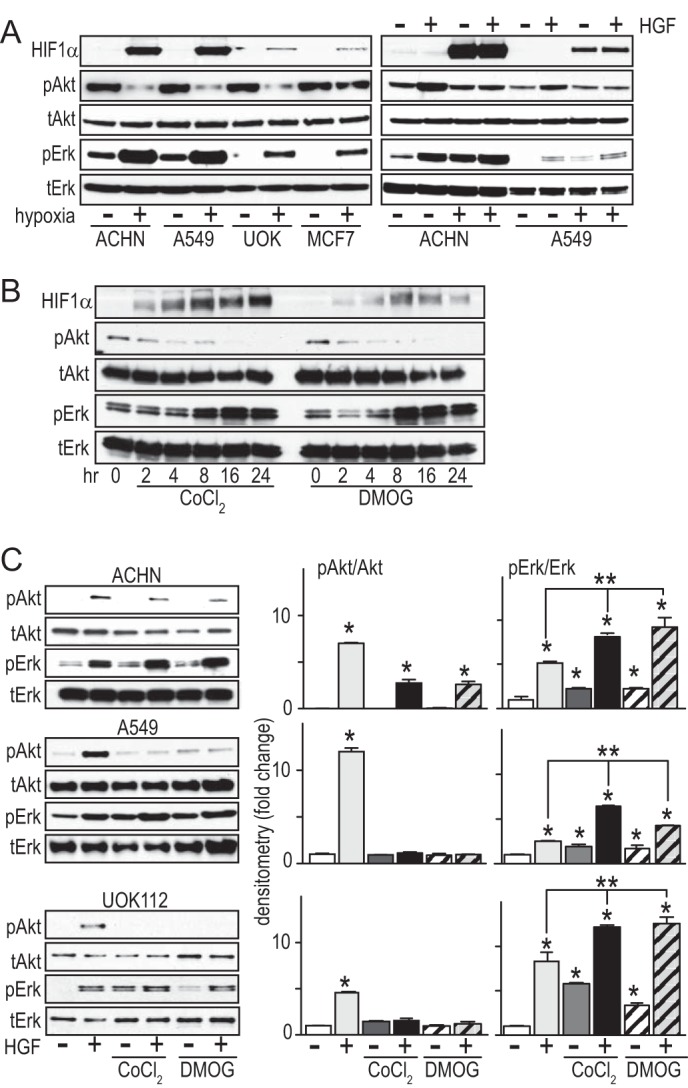
Hypoxia activates the ERK pathway while suppressing Akt. A, left, cells cultured in complete (serum-containing) medium incubated under normoxic (−) or hypoxic (+) conditions for 24 h were immunoblotted for HIF1α, pAkt, Akt, pERK, or ERK, as indicated. Right, cells cultured in serum-reduced medium were incubated under normoxic (−) or hypoxic (+) conditions for 24 h, followed by 20-min exposure to HGF (0.5 nm), and then extracted with nonionic detergent and immunoblotted for HIF1α, pAkt, Akt, pERK, or ERK, as indicated. B, ACHN cells were treated with CoCl2 (100 μm; left) or DMOG (500 μm; right) at the indicated times (h), and lysates were immunoblotted for HIF1α, pAkt, tAkt, pERK, or tERK. C, cells were treated with CoCl2 or DMOG for 24 h, followed by 20-min treatment with HGF as indicated. Left, cell lysates immunoblotted for pAkt, Akt, pERK, or ERK. Right, densitometric quantitation of the immunoblot for the following treatment groups: untreated (white), HGF (light gray), CoCl2 (dark gray), DMOG (striped), HGF + CoCl2 (black), HGF + DMOG (gray striped) (*, p < 0.05). Error bars, S.D.
The functional impact of the differential effects of hypoxia on HGF-induced ERK and PI3K pathway activation was investigated using the pharmacological inhibitors of these pathways U0126 and LY294002, respectively. Migration by ACHN (Fig. 3A) and UOK112 cells (Fig. 3B) incubated for 16 h in CoCl2 with or without HGF was unaffected by LY294002 but significantly inhibited by U0126, suggesting that the independent and combined effects of hypoxia and HGF were at least in part ERK-dependent. Reinforcing these observations, we found that ACHN cells ectopically expressing a constitutively active form of MEK displayed significantly greater 24-h invasiveness than GFP control transfectants, that this effect was further increased by concurrent CoCl2 treatment, and that ACHN cells expressing a dominant negative form of MEK were non-invasive (Fig. 3C).
FIGURE 3.
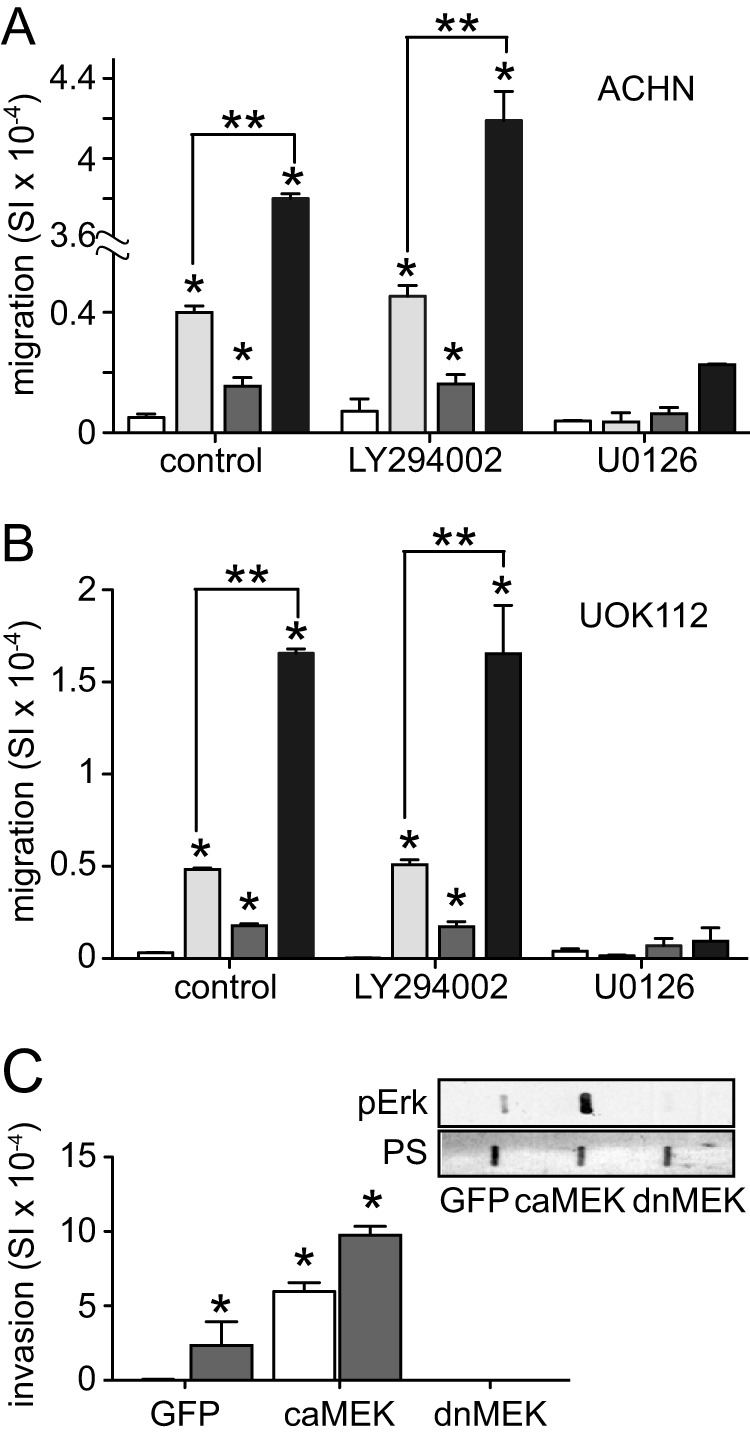
Migration and invasion driven by HGF and enhanced by hypoxia is ERK activation-dependent. A, ACHN cell migration by untreated (control) cells or following treatment with LY294002 (10 μm) or U0126 (1 μm). After 30 min, HGF (0.5 nm; light gray bars), CoCl2 (100 μm; dark gray bars), or both (black bars) were added as indicated for 24 h. Values represent the mean of triplicate samples ± S.D. (error bars). Data are representative of three independent experiments (*, p < 0.05 versus untreated; **, p < 0.001). B, migration by UOK112 cells as described for A. C, invasion by ACHN cells infected with vectors encoding GFP, constitutively active (ca) MEK, or dominant negative (dn) MEK for 48 h in the absence (unfilled) or presence of CoCl2 (dark gray) for 24 h (*, p < 0.001). Lysates prepared from infected cells were also used for dot blots (inset) that were immunodetected for pErk and stained with Ponceau S (PS) to ensure equal loading.
Reactive Oxygen Species (ROS) Mediate Hypoxia-enhanced ERK Activation and HGF-driven Invasion
Intracellular ROS, including free radicals such as superoxide, hydroxyl radical, and H2O2, are often generated at high levels under hypoxic conditions. ROS production in ACHN cells treated with CoCl2 or DMOG for 4–16 h increased significantly over time (Fig. 4A); combined treatment with HGF did not further enhance ROS levels (data not shown). In the added presence of the ROS scavenger sodium pyruvate (NP; 10 mm), CoCl2- or DMOG-induced ROS accumulation was curtailed more than 50% (Fig. 4B). CoCl2- or DMOG-induced ACHN cell invasion and pseudohypoxia enhancement of HGF-driven invasion were significantly diminished by NP treatment, indicating partial dependence of this effect on ROS accumulation (Fig. 4C). ROS accumulation over 24 h was also functionally linked to hypoxia-induced ERK activation and hypoxic suppression of HGF-stimulated Akt activation in ACHN, because both events were blocked by the ROS scavengers NP and diphenyleneiodonium (DPI; Fig. 4D). HGF-induced ERK activation was independent of ROS (Fig. 4D). Similar results were seen when ACHN cells were treated with CoCl2 or DMOG in the absence or presence of NP (Fig. 4, E and F) or DPI (data not shown).
FIGURE 4.

Hypoxia-induced ROS production leads to enhanced ERK activation and increased invasiveness. A, ROS level, expressed as mean -fold increase over untreated cells ± S.D. (error bars), in cells treated with CoCl2 (100 μm; gray) or DMOG (500 μm; striped) at the indicated times or H2O2 (100 μm) for 1 h (unfilled). B, ROS level, expressed as mean -fold increase over untreated cells ± S.D., in cells treated with CoCl2 or DMOG for 24 h in the additional absence or presence of NP (1 mm) for 24 h prior (*, p < 0.005). C, cell invasion was measured in Matrigel-coated Boyden chambers among the following treatment groups: untreated (white), HGF (0.5 nm; light gray), CoCl2 (dark gray), DMOG (striped), HGF + CoCl2 (black), and HGF + DMOG (gray striped). Bars, mean of triplicate samples ± S.D. Data are representative of three independent experiments (*, p < 0.05). D, Cells were incubated in the absence or presence of NP or DPI (5 μm) for 24 h, followed by an additional 24 h under normoxic or hypoxic conditions; cells were then treated with HGF for 20 min as indicated prior to immunoblot analysis for pAkt, Akt, pERK, or ERK. E, ACHN cells were cultured in either the absence or presence of NP prior to CoCl2 or DMOG treatment for 24 h, followed by 20 min of HGF treatment prior to immunoblot analysis for pERK or ERK. F, densitometric quantitation of the immunoblot shown in E: untreated (white), HGF (light gray), CoCl2 (dark gray), DMOG (striped), HGF + CoCl2 (black), HGF + DMOG (gray striped) (*, p < 0.001; **, p < 0.01).
ERK requires both threonine 202 and tyrosine 204 phosphorylation for full activity; members of the subgroup of dual specificity phosphatases (DUSPs) known as MAPK phosphatases (MKPs) are uniquely capable of comprehensively regulating ERK signaling. There are 11 well characterized MKP family members; those frequently associated with ERK inactivation include MKP3, MKP4, and phosphatase of activated cells 1 (PAC1 or DUSP2). Real-time PCR analysis of mRNA abundance for various DUSP family members under hypoxic or normoxic conditions with or without HGF treatment for 24 h showed that under hypoxia, DUSP2 transcript abundance was significantly reduced in ACHN and A549 (Fig. 5A) and moderately reduced in UOK112 and MCF7 (Fig. 5B). In ACHN and A549 cells, HGF treatment dramatically enhanced the hypoxia-associated decrease in DUSP2 expression (Fig. 5A), whereas no further decrease was observed in UOK112 and MCF7 (Fig. 5B). In contrast to the other cell lines tested, MCF7 cells showed significantly increased DUSP1 expression with the combination of HGF and hypoxia, potentially attenuating their invasive response to these conditions. DPI treatment of hypoxic ACHN and A549 cells blocked hypoxia-associated DUSP2 suppression, indicating ROS dependence of this effect (Fig. 5C). DUSP2 protein content was also significantly decreased by hypoxia and similarly ROS-dependent in ACHN and A549 (Fig. 5D).
FIGURE 5.
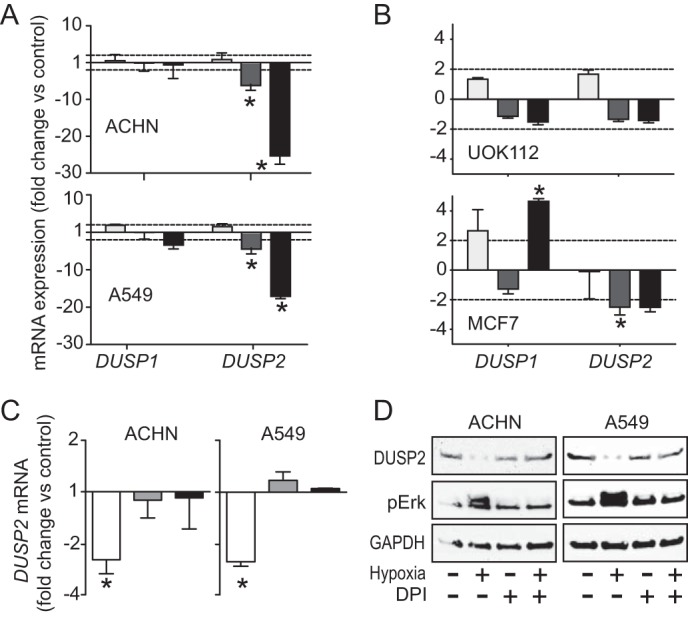
Hypoxia-induced ROS accumulation decreases DUSP2 expression. A, cells were incubated in HGF (0.5 nm; light gray), hypoxia (dark gray), or hypoxia with HGF (black) for 24 h prior to analysis of DUSP1 or DUSP2 mRNA abundance, expressed as mean -fold change versus untreated normoxic cells (n = 3; *, p < 0.01). B, UOK112 and MCF7 cells were incubated in normoxia (light gray), hypoxia (dark gray), or hypoxia with HGF (black) for 24 h prior to analysis of DUSP1 or DUSP2 mRNA abundance, expressed as mean -fold change relative to untreated normoxic cells (n = 3; *, p < 0.01). C, cells were incubated in hypoxia (unfilled), normoxia with DPI treatment (5 μm; gray), or hypoxia with DPI treatment (black) for 24 h prior to analysis of DUSP2 mRNA abundance, expressed as mean -fold change in untreated normoxic cells (n = 3; *, p < 0.01). D, cells were incubated in the absence or presence of DPI for 24 h, followed by an additional 24 h under normoxic or hypoxic conditions prior to immunoblotting for DUSP2, pERK, or GAPDH. Error bars, S.D.
ROS Mediates PKCα and PP2A Activation, Leading to Hypoxic Akt Suppression
Hypoxia suppressed HGF-induced pAkt in all cell lines except MCF7. Investigating the biochemical link between hypoxia and pAkt suppression, lysates from ACHN and A549 cells treated with CoCl2 for 24 h were immunoblotted for total PP2A, phospho-PTEN, or phospho-PDK1, known regulators of Akt phosphorylation, but no changes in the levels of these proteins were observed (data not shown). A prior study (19) showed that cell lines (including A549) treated with the protein kinase C (PKC) activator 12-O-tetradecanoylphorbol-13-acetate displayed decreased pAkt. Consistent with our observations, they also noted that some cell lines (including MCF7) did not display 12-O-tetradecanoylphorbol-13-acetate-mediated pAkt suppression. Oxidative stress has been reported to trigger PKC translocation from the cytosol to the plasma membrane and PKC activation. To test whether hypoxia-induced ROS was activating PKC, ACHN and A549 cells were maintained in normoxic or hypoxic conditions in the absence or presence of DPI for 24 and then treated with HGF for 20 min prior to immunoblot analysis of pPKCα and tPKCα. HGF treatment induced PKCα activation in normoxic cells regardless of DPI (Fig. 6, A and B) or NP treatment (data not shown). Hypoxia also induced PKCα activation in these cell lines, and this was reversed by DPI treatment, suggesting that activation resulted from ROS accumulation (Fig. 6, A and B).
FIGURE 6.
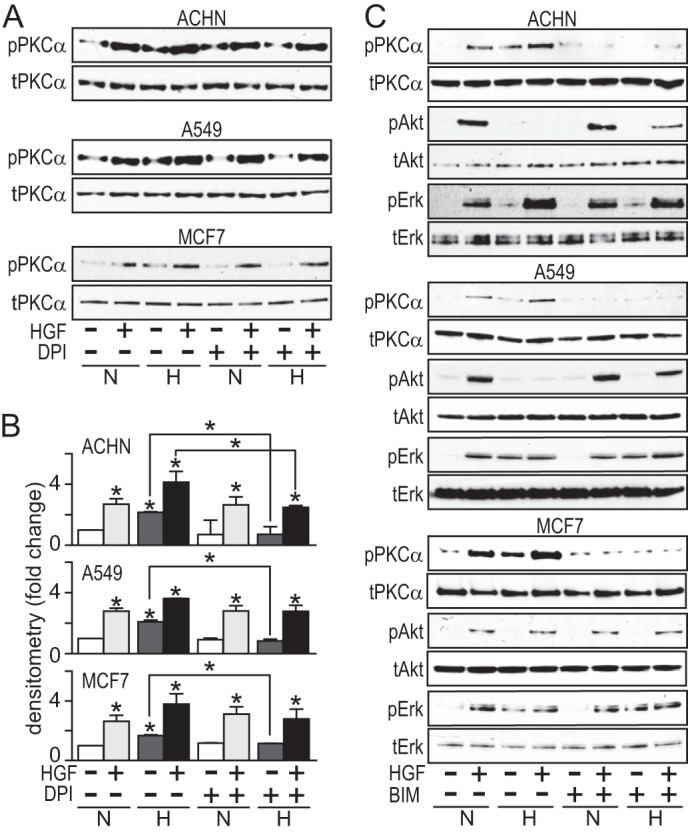
PKCα activation mediates hypoxia-induced Akt suppression. A, cells were incubated in the absence or presence of DPI (5 μm) for 24 h, followed by an additional 24 h under normoxic or hypoxic conditions, and then treated with HGF (0.5 nm) for 20 min, as indicated, prior to immunoblot analysis for pPKCα or PKCα. B, densitometric quantitation of immunoblot shown in A; bars represent the mean of triplicate measurements ± S.D. (error bars); *, p < 0.05 relative to control (immediately above bar) or between groups, as indicated by lines. C, cells were incubated in the absence or presence of BIM (5 nm) for 24 h under normoxic or hypoxic conditions and then treated with HGF (0.5 nm) for 20 min, as indicated, prior to immunoblot analysis for pPKCα, PKCα, pAkt, Akt, pERK, or ERK.
Evidence that ROS-induced PKC activation was linked to hypoxia-associated suppression of HGF-driven Akt activation was obtained using the cell-permeable PKC inhibitor bisindolylmaleimide I (BIM). ACHN, A549, and MCF7 cells were pretreated with BIM, incubated in normoxic or hypoxic conditions, and then treated briefly with HGF. As expected, BIM treatment suppressed all HGF- and hypoxia-associated increases in pPKC, and it also reversed the hypoxia-associated suppression of HGF-driven Akt activation observed in ACHN and A549 (Fig. 6C, top and middle), suggesting that, indeed, ROS-induced PKC activation mediated this effect. Consistent with the results presented in Figs. 1 and 2, hypoxia did not suppress Akt activation in MCF7 cells, and BIM treatment had no effect on Akt activation (Fig. 6C, bottom). BIM treatment did not inhibit ERK activation by HGF, hypoxia, or the combination (Fig. 6C); nor did it inhibit invasion by ACHN or A549 cells (data not shown), indicating that these effects were PKC-independent.
We also investigated the potential role of PP2A in mediating Akt dephosphorylation downstream of PKCα. As noted above, we did not observe any change in the level of PP2A in cells treated with CoCl2 for 24 h; however, prior reports have shown that PKCα is a primary mediator of PP2A activation (20) and that PP2A negatively regulates Akt by direct dephosphorylation in other cell types under different conditions (21). To determine whether PP2A is activated by PKC in hypoxia, cells were pretreated with BIM or DPI and incubated in normoxic or hypoxic conditions for 24 h, followed by brief HGF treatment. PP2A was immunoprecipitated from cell lysates, and phosphatase assays were performed using para-nitrophenyl phosphate as substrate. ACHN and A549 cells showed increased PP2A phosphatase activity under hypoxic conditions (Fig. 7A) or (for A549 only) with CoCl2 treatment (Fig. 7B). Pretreatment with BIM or DPI returned hypoxia-stimulated PP2A activity to control levels, indicating PKC pathway dependence. Neither ACHN nor A549 showed any increase in PTEN activity after 24 h of CoCl2 treatment or brief HGF treatment (data not shown).
FIGURE 7.
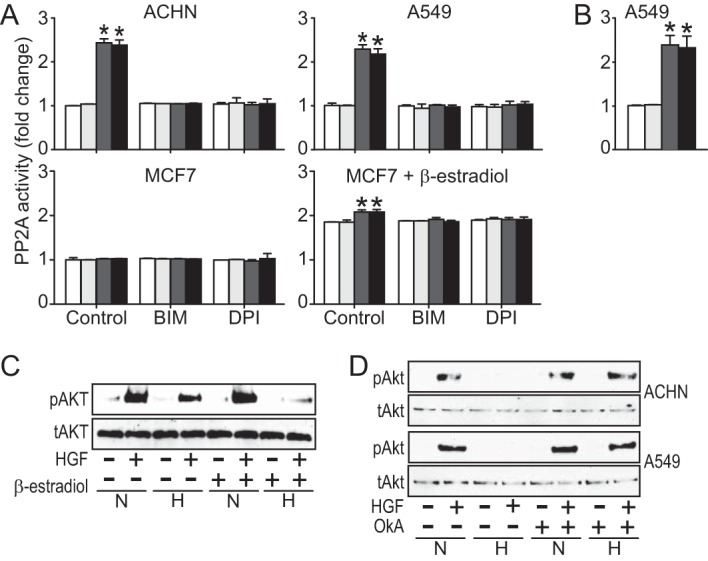
Activation of PP2A by PKCα mediates hypoxia-induced Akt suppression. A, ACHN (top left), A549 (top right), and MCF7 cells (bottom left) were treated without (control) or with BIM (5 nm) or DPI (5 μm) under normoxic (unfilled bars) or hypoxic (dark gray bars) conditions for 24 h prior to brief HGF stimulation (under normoxia (light gray bars) or under hypoxia (black bars)). Another set of MCF7 cells (bottom right) were treated with β-estradiol (10 nm) for 24 h and then with or without BIM or DPI under hypoxic or normoxic conditions for another 24 h prior to brief HGF stimulation. Cell lysates were immunoprecipitated with anti-PP2A antibody, and phosphatase activity was assessed using para-nitrophenyl phosphate as substrate. B, A549 treated as in A but substituting CoCl2 treatment (100 μm) for hypoxia. C, MCF7 cells were incubated in the absence or presence of β-estradiol (10 nm) for 24 h, followed by an additional 24 h under normoxic (N) or hypoxic (H) conditions and then treated with HGF (0.5 nm) for 20 min, as indicated, prior to immunoblot analysis for pAkt or Akt. D, ACHN and A549 cells were incubated in the absence or presence of okadaic acid (1 nm) for 24 h under normoxic (N) or hypoxic (H) conditions and then treated with HGF (0.5 nm) for 20 min, as indicated, prior to immunoblot analysis for pAkt and Akt. Error bars, S.D.
MCF7 breast cancer-derived cells stood apart from the other lines analyzed here in that the combined effects of HGF and hypoxia (or hypoxia mimetics) on migration and invasion were significant but less pronounced (Figs. 1, A and B), and HGF-stimulated Akt activation was neither suppressed by hypoxia (Fig. 2A, left) nor associated with increased PP2A activity (Fig. 7A, lower left), despite ROS-mediated PKCα activation (Fig. 6, A and B). Prior studies have shown that PP2A activation is estrogen-dependent in MCF7 cells (22). Indeed, the addition of β-estradiol also increased PP2A activity in our studies, and under these conditions, it was further enhanced by hypoxia (Fig. 7A, bottom right), an effect that was linked to ROS-mediated PKCα activation by its reversal with DPI or BIM treatment. MCF7 cells treated with or without β-estradiol were then examined for hypoxia-associated Akt suppression by immunoblotting for phosphorylated and total Akt. Control MCF7 cells again displayed HGF-stimulated Akt activation regardless of oxygen level, but hypoxic suppression of Akt activation was observed in the presence of β-estradiol (Fig. 7C); β-estradiol had no effect on pAkt levels in ACHN or A549 (data not shown). Thus, the hypoxia signaling pathway extending to Akt suppression was intact in MCF7 cells but was subject to further regulation by estrogen signaling.
The connection between increased PP2A activity and suppression of HGF-driven Akt activation was further interrogated in ACHN and A594 cells using the PP2A inhibitor okadaic acid. Hypoxia-associated suppression of HGF-induced Akt activation in both cell lines was reversed by okadaic acid treatment to the level observed in normoxic cells (Fig. 7D), strongly implicating PP2A in hypoxic regulation of HGF-activated Akt signaling.
Hypoxic Suppression of HGF-driven Cell Proliferation and Metabolism
The hypoxia mimetic CoCl2 suppressed ACHN cell growth stimulated by HGF (Fig. 1C). This effect was reproduced in UOK112 and A549 cells but not in MCF7 (Fig. 8A), consistent with the distinct requirement for concomitant estrogen signaling, as described above. Similar to these findings, results of MTT assays indicative of mitochondrial metabolic activity performed on ACHN, UOK112, and A549 cells grown in hypoxic or normoxic conditions showed hypoxic suppression of HGF-stimulated metabolism, an effect that was not seen in MCF7 (Fig. 8B, left). MTT analysis of CoCl2-treated ACHN and UOK112 cells followed the same trend seen in cells subjected to hypoxia (Fig. 8B, right). Cell cycle analysis of ACHN cells by flow cytometry revealed that HGF treatment alone increased the S phase cell population, whereas CoCl2 treatment resulted in G1 arrest (Fig. 8C). MTT analysis of ACHN, UOK112 (Fig. 8D), A549, and MCF7 cells (Fig. 8E) grown in normoxic or hypoxic conditions and ACHN grown in CoCl2 (data not shown), treated with U0126 or LY294002, revealed a strong dependence of HGF-induced metabolic increase on PI3K signaling; neither inhibitor affected hypoxic suppression of HGF-stimulated cell metabolism.
FIGURE 8.

Hypoxia blocks cell proliferation and the associated increase in metabolic activity driven by HGF. A, mean cell number over time ± S.D. (error bars) for control (circles) and cells treated with CoCl2 (100 μm; triangles), HGF (0.5 nm; squares), or HGF + CoCl2 (inverted triangles) on days 0, 3, and 6 (*, p < 0.01 versus control; **, p < 0.01 HGF versus HGF + CoCl2). B, left, mitochondrial metabolic activity (mean MTT value relative to control ± S.D., n = 3) in ACHN, UOK112, A549, and MCF7 cells left untreated (unfilled) or treated with HGF (light gray), hypoxia (dark gray), or HGF + hypoxia (black). Right, mitochondrial activity in ACHN and UOK112 cells treated with HGF (light gray), CoCl2 (dark gray), or HGF + CoCl2 (black) (*, p < 0.003). C, cell cycle analysis of ACHN cells; bars, mean percentage of cells in each phase ± S.D. (n = 3) for untreated (unfilled), HGF-treated (light gray), CoCl2-treated (dark gray), or HGF + CoCl2-treated (black) sample groups. Inset, detail of changes in S phase distribution (*, p < 0.0001 versus untreated; **, p = 0.0005 HGF versus HGF + CoCl2). D, mitochondrial activity (mean MTT value -fold over control ± S.D.) in ACHN (top) and UOK112 (bottom) cells left untreated (unfilled) or treated with HGF (light gray), hypoxia (dark gray), or HGF + hypoxia (black) and similar sample groups treated additionally with U0126 (1 μm) or LY294002 (10 μm), as indicated (*, p < 0.0001). E, as described for D except using A549 (left) and MCF7 (right) cells.
ROS and PKCα activation mediated the observed hypoxic suppression of HGF-stimulated metabolism in ACHN cells because this was reversed by either BIM or DPI treatment (Fig. 9A). HGF-stimulated mitochondrial metabolism in MCF7 cells was not suppressed by hypoxia (Fig. 9B, top) unless cells were treated concomitantly with β-estradiol to restore PP2A activation (Fig. 9B, bottom); under these conditions, either BIM or DPI treatment reversed the observed hypoxic suppression. Similarly, HGF-mediated cell growth in MCF7 cells was not suppressed by hypoxia (Fig. 9C, left) unless cells were treated with β-estradiol to restore PP2A activation (Fig. 9C, right).
FIGURE 9.
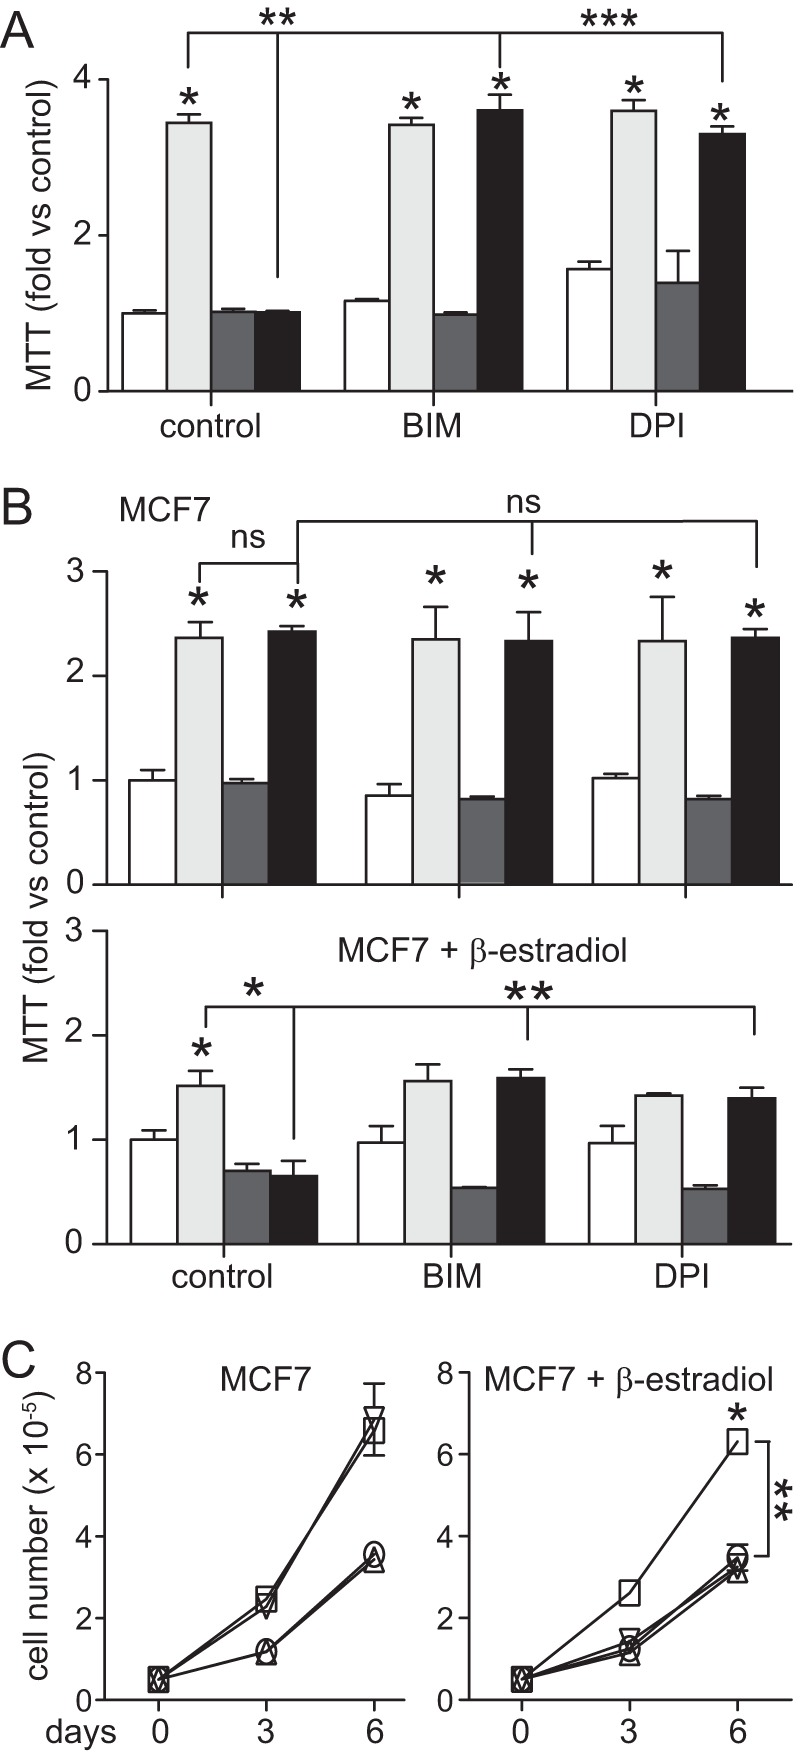
Hypoxia-induced metabolic suppression in papillary renal carcinoma cells is mediated by ROS and PKCα and requires ER pathway co-activation in MCF7 breast cancer cells. A, mitochondrial activity in ACHN left untreated (unfilled) or treated with HGF (0.5 nm; light gray), hypoxia (dark gray), or HGF + hypoxia (black) and similar sets treated additionally with BIM (5 nm) or DPI (5 μm), as indicated (*, p < 0.0001 versus control; **, p < 0.0001 HGF versus HGF/hypoxia; ***, p < 0.0001 HGF/hypoxia versus BIM/HGF/hypoxia and DPI/HGF/hypoxia). Bars, mean of triplicate samples ± S.D. (error bars) (n = 3); some error bars are too small to be visible. B, mitochondrial activity in MCF7 cells incubated in the absence (top) or presence (bottom) of β-estradiol (10 nm) for 24 h, followed by an additional 24 h under normoxic or hypoxic conditions with or without HGF and additionally with BIM or DPI; the bars are as described for A (*, p < 0.001 versus control; **, p < 0.001 hypoxia versus BIM/HGF/hypoxia and DPI/HGF/hypoxia). C, proliferation of MCF7 cells incubated in the absence (left) or presence (right) of β-estradiol, expressed as mean cell number over time ± S.D. (n = 3) for control (circles) and groups treated with CoCl2 (triangles), HGF (squares), or HGF + CoCl2 (inverted triangles) on days 0, 3, and 6 (*, p < 0.01 versus control; **, p < 0.01 HGF versus HGF + CoCl2).
Autophagy Induction Critically Supports Invasiveness Driven by HGF with Hypoxia
Hypoxia has been shown to induce autophagy in multiple cell lines and tissues. When autophagy is initiated, cytoplasmic microtubule-associated protein 1 light chain 3 (LC3-I), is cleaved, lipidated, and inserted as LC3-II into autophagosome membranes (23), where it becomes associated with the ubiquitin-binding protein sequestosome 1 (SQSTM1, p62). Lysosomal degradation of autophagosomes leads to decreased SQSTM1 abundance during autophagy. A549 and UOK112 cells grown in hypoxia displayed decreased SQSTM1 and increased LC3-II accumulation (Fig. 10A); LC3-II was also increased in ACHN cells treated with CoCl2 or DMOG (Fig. 10B). Increased recruitment of LC3 to autophagosomes can be visualized microscopically as an increased number of LC3 puncta (24, 25). Fluorescence immunostaining for LC3 in ACHN and UOK112 revealed accumulation of LC-3 puncta with 24-h CoCl2 treatment, whereas untreated and HGF-treated cells did not (Fig. 10C).
FIGURE 10.
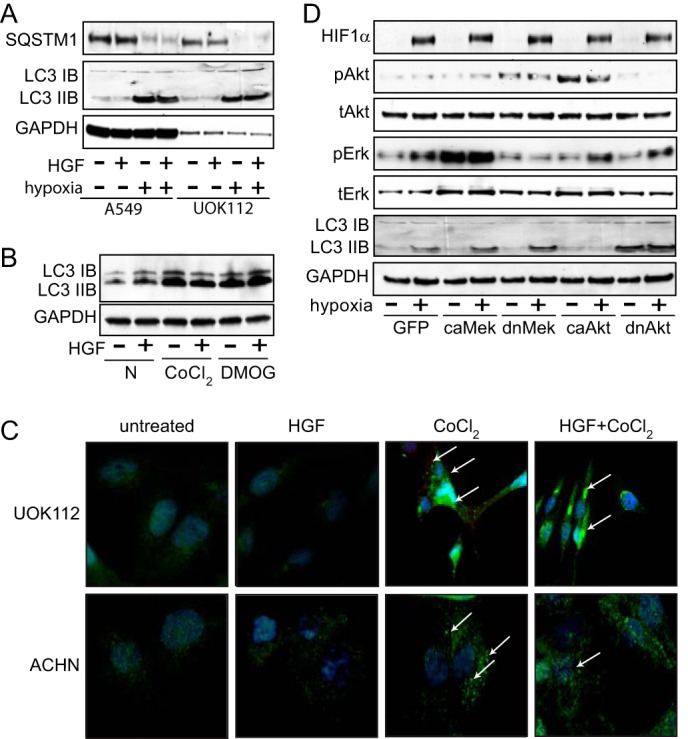
Hypoxic Akt suppression induces autophagy. A, A549 or UOK112 lysates prepared from cells incubated in normoxic or hypoxic conditions for 24 h in the absence or presence of HGF (0.5 nm) were immunoblotted for SQSTM1, LC3B, or GAPDH. B, extracts prepared from ACHN cells left untreated or treated with CoCl2 (100 μm) or DMOG (500 μm) for 24 h, followed by 20 min of HGF treatment, were immunoblotted for LC3B or GAPDH. C, immunofluorescence microscopic localization of LC3 in UOK112 and ACHN cells left untreated or treated with HGF, CoCl2, or HGF + CoCl2 for 24 h. D, ACHN cells were infected with GFP or constitutively active (ca) MEK, constitutively active Akt, dominant negative (dn) MEK, or dominant negative Akt for 48 h and then incubated in normoxic or hypoxic conditions for 24 h prior to immunoblot analysis for HIF1α, pAkt, Akt, pERK, ERK, LC3B, or GAPDH.
Prior studies have shown that enhanced tumorigenesis by constitutively active Akt is linked to inhibition of autophagy (26) and that inhibition of Akt promotes autophagy (27). To determine whether hypoxia-associated Akt inhibition initiated autophagy, ACHN cells harboring lentiviral expression constructs encoding constitutively active (ca) or dominant negative (dn) forms of MEK or Akt were incubated under normoxic or hypoxic conditions for a 24-h incubation in serum-reduced media (Fig. 10D). Hypoxic GFP-infected control cells displayed increased pERK, unaltered pAkt, and increased LC3-II formation, indicating autophagy induction (Fig. 10D, left). Ectopic expression of constitutively active or dominant negative MEK exerted the anticipated effects on ERK activation but did not alter hypoxia-induced LC3-II formation (Fig. 10D, middle), suggesting that autophagy initiated by hypoxia is MAPK cascade-independent. In contrast, cells expressing constitutively active or dominant negative Akt displayed the expected effects on pAkt, and, consistent with the prior studies mentioned, constitutive Akt activation blocked hypoxia-induced LC3-II formation, whereas constitutive Akt suppression led to increased LC3-II formation even in normoxia (Fig. 10D, right). These results indicate that hypoxia-associated Akt suppression initiates autophagy.
In ACHN cells, the autophagosome inhibitor chloroquine had little effect on invasion driven by either HGF or CoCl2 alone but significantly suppressed invasion driven by combined HGF and CoCl2 treatment (Fig. 11A). In a follow-up, ACHN and A549 cells were transfected with expression constructs for EGFP (control), or EGFP-tagged wild type LC3 or mutant LC3 (LC3DG120A), which blocks autophagosome formation by preventing the cleavage of pro-LC3 required for the formation of LC3-I and LC3-II. MTT assays performed on these transfectants over a 2-day period confirmed that hypoxia suppressed metabolism and that disruption of autophagosome formation by the LC3 mutant form significantly reversed this effect (Fig. 11B). Cell invasion by these transfectants across Matrigel-coated Boyden chambers in the presence or absence of HGF and/or hypoxia followed the expected pattern of control < hypoxia < HGF < HGF + hypoxia, but the combined effect of HGF and hypoxia was reduced 66% in the mutant LC3 transfectants relative to wild type transfectants (Fig. 11C). Thus, autophagosome formation provided critical support for invasiveness driven by the combination of HGF and hypoxia.
FIGURE 11.

Hypoxia-induced autophagy critically supports HGF-driven cell invasion. A, invasion by ACHN cells left untreated (unfilled) or treated with HGF (0.5 nm; light gray), CoCl2 (100 μm; dark gray), or HGF + CoCl2 (black), in the absence or presence of chloroquine (50 μm) for 24 h (*, p < 0.05). B, mitochondrial activity (mean MTT value relative to control ± S.D. (error bars), n = 3) in ACHN (top) and A549 (bottom) cells on day 1 (left) or day 2 (right) after transfection with plasmids for EGFP, LC3wt-GFP or mutLC3-GFP expression (*, p < 0.05). C, mean ACHN (top) or A549 (bottom) cell invasion as measured using Matrigel-coated Fluoroblok Boyden chambers (±S.D., n = 3) by normoxic untreated cells (unfilled bar at left in each group, too low to be completely visible), HGF-treated (light gray), hypoxic (dark gray), or HGF-treated hypoxic cells (black) that had been transfected with EGFP, LC3wt-GFP, or mutLC3-GFP. Invading cells were visualized by fluorescence microscopy (*, p < 0.005 versus untreated normoxic cells; **, p < 0.0002; ***, p < 0.01).
Invasive Synergy Driven by Epidermal Growth Factor and Hypoxia
We found that in papillary renal carcinoma cells, invasive synergy and growth arrest was also driven by hypoxia in combination with epidermal growth factor (EGF; Fig. 12). In ACHN and A549 cells, the pattern of enhanced ERK activation by hypoxia combined with EGF stimulation, as well as PKCα activation and associated hypoxic suppression of Akt activation, was readily observed (Fig. 12A). These signaling events similarly resulted in hypoxic suppression of EGF-driven cell proliferation (Fig. 12B) and synergistic invasiveness by ACHN cells (Fig. 12C). Given the similar primary signaling cascades and common effectors of HGF and EGF, we speculate that other details of hypoxia and growth factor signaling integration, such as ROS-mediated PP2A activation and DUSP2 suppression, exist downstream of EGF as well.
FIGURE 12.

Invasive synergy and suppression of proliferation driven by EGF and hypoxia. A, cells incubated under normoxic (−) or hypoxic (+) conditions for 24 h, followed by a 20-min exposure to EGF (50 ng/ml), were extracted with nonionic detergent and immunoblotted for HIF1α, phospho-EGF receptor (pEGFR), EGF receptor (EGFR), pPKCα, PKCα, pAkt, Akt, pERK, or ERK, as indicated. B, cell growth (mean cell number over time ± S.D. (error bars); n = 3) for control (circles) and groups treated with CoCl2 (triangles), EGF (squares), or EGF + CoCl2 (inverted triangles), as measured on days 0, 3, and 6 (*, p < 0.05). C, invasion by ACHN cells incubated in normoxia (unfilled, left, too low to be completely visible), EGF (light gray), hypoxia (dark gray), or EGF with hypoxia (black) for 24 h; bars, mean ± S.D.; n = 3; *, p < 0.01 versus control.
DISCUSSION
Hypoxia plays a key role in many aspects of cancer biology, including angiogenesis, epithelial-mesenchymal transition, tumor invasion, and metastasis (28–33). In patients with invasive breast cancer, loss of vascular pericytes from hypoxia was associated with Met activation, epithelial-to-mesenchymal transition, and increased metastasis (31). Similar hypoxia-related shifts from rapid tumor growth to increased metastasis have been reported for uveal melanoma (7), cervical cancer (8), and oral squamous carcinoma cells (12). This is also frequently seen in patients who have undergone radiation treatment for various cancers, where treated areas show increased hypoxia and decreased tumor density but increased metastasis (28, 32). As shown here and in prior studies, the combination of hypoxia and HGF/Met signaling strongly promotes tumor cell invasiveness and metastasis (10, 11, 13), motivating us to make a thorough and cohesive investigation of the integration of these signaling pathways.
ROS production can induce and/or activate several members of the MAPK pathway (34–37). In some of these models, ROS production was associated with hypoxia, and inhibition of MAPK activation with antioxidants functionally implicated ROS in this process, but cell motility or invasion was not interrogated (35, 38). HIF1α-mediated ROS accumulation has been causally linked to increased breast cancer cell invasion, but MAPK activation was not assessed (39). We show here that hypoxia, as well as CoCl2- and DMOG-induced pseudohypoxia, led to increased ROS, Erk1/2 activation, and invasion in four tumor cell lines. ROS accumulation and ERK activation and invasion were suppressed by ROS scavengers and by pharmacologic or dominant negative MEK inhibition, whereas constitutive MEK activation enhanced invasion. The portion of this hypoxia pathway above ERK was independent of Met abundance or activation in all four cell lines and thus additive to HGF-induced ERK activation, which is critical for HGF-driven invasion, as shown here and supported by prior work (40–43). The observed hypoxic suppression of DUSP2 transcript and protein content is likely to provide, wholly or in part, hypoxic ERK activation and invasiveness. A prior report showed that DUSP2 expression was reduced or absent in many human cancers, inversely correlated with that of HIF1α and with cancer malignancy, and causally linked to increased ERK activation and chemoresistance in tumor cell lines (6). Although invasion was not analyzed in that study, other reports have shown that overexpression of family members DUSP1 or DUSP6 reduced tumor cell invasion (44, 45). We assert that the coordinated changes in HIF1α, ROS, phospho-ERK, and DUSP2 shown here define the primary signaling pathway by which hypoxia promotes invasion in papillary RCC cells and that ERK is the critical node for synergistic invasiveness induced by HGF and hypoxia (Fig. 13).
FIGURE 13.
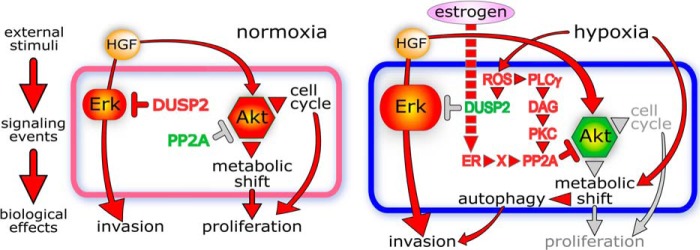
Schematic depiction of synergistic signaling of tumor cell invasiveness by HGF and hypoxia. Left, normoxic HGF induction of cell invasion and proliferation mediated predominantly by the ERK and Akt pathways, respectively. Right, integration of HGF and hypoxia signaling pathways leading to synergistic invasion, induction of autophagy, and suppression of proliferation. Red molecules are active, and red arrows/arrowheads indicate activated pathways; red rotated T indicates active inhibition; green molecules indicate decreased expression or activity; gray arrows or rotated T indicate silenced pathways.
Akt is a master regulator of cell metabolism and HGF-driven cell proliferation; the integration of this pathway with the hypoxia signaling pathway is complex. In normoxic conditions, HGF-induced Akt activation is essential for cell proliferation but independent of invasion. In hypoxia, substantial suppression of HGF-induced Akt activation resulted in cell cycle arrest and decreased proliferation. This occurred through ROS-mediated PLCγ activation, DAG production, and consequent PKC activation and, in turn, increased PP2A activity, Akt dephosphorylation, and inactivation. Hypoxic Akt suppression was associated with induction of autophagy, a protective mechanism that enhances cell viability in adverse conditions (46–48). Disruption of autophagosome formation by chloroquine or by ectopic expression of an uncleavable LC3 mutant significantly reduced hypoxia-enhanced, HGF-induced cell invasion, indicating that autophagosomes provide critical support for invasive synergy in a hypoxia-attenuated metabolic state. Moreover, constitutive Akt activation blocked LC3 proteolytic conversion, implying that Akt suppression is also important. Thus, Akt activation state is not completely unrelated to the invasive synergy mediated by the integration of HGF and hypoxia signaling; its role is passive in that suppression is necessary.
Interestingly, our results show that adaptation to hypoxia is estrogen receptor (ER)-regulated in breast cancer-derived MCF-7 cells. Hypoxia did not induce autophagy in MCF7 (Fig. 9B, left) and failed to suppress HGF-stimulated Akt activation (Fig. 3A). ER activation enabled hypoxia to induce suppression of HGF-stimulated pAkt (Fig. 8C), autophagy induction manifested as dramatically reduced metabolism (Fig. 10B), and growth suppression (Fig. 10C). Thus, the failure of MCF7 to adapt to hypoxia through induction of autophagy is due not to an absence of the signaling pathway but to its suppression in the absence of ER activation. ER-enabled metabolic suppression by hypoxia was dependent on ROS production and PKC activation (Fig. 10B), but ER-driven PP2A activation was more complex; the majority of this increase was independent of ROS and PKC, but a lesser although statistically significant portion was BIM- and DPI-sensitive (Fig. 8A). PP2A activation by ER under normoxic conditions has been reported and was coincident with ER-PP2A physical association (49). The observation that ER-mediated PP2A activation only leads to decreased pAkt in the presence of hypoxia (Fig. 8D) suggests that either this minor additional increase in PP2A activity is functionally relevant, or another hypoxia-related event is needed for PP2A to dephosphorylate Akt beyond increased catalytic activity; both possibilities are illustrated schematically in Fig. 13. A recent study showed that primary cells derived from ER-negative breast tumors grew significantly faster than those from ER-positive tumors and, together with other attributes, authentically reflected rates of disease progression and outcome (50). Our analysis of MCF7 suggests that failure to activate the ER pathway, mimicking ER-negative breast tumors, would lead to increased Akt activation and cell survival and proliferation even in a hypoxic microenvironment. Overall, our results illustrate the plasticity of invasive and proliferative tumor states, cohesively outline the convergence of hypoxia and growth factor signaling pathways leading to enhanced tumor cell invasiveness, and provide signaling profiles that may help distinguish rapidly growing tumors from those with greater likelihood for metastasis.
This work was supported, in whole or in part, by the National Institutes of Health Intramural Research Program, NCI, Center for Cancer Research.
- HIF
- hypoxia-inducible factor
- HGF
- hepatocyte growth factor
- DMOG
- N-(methoxyoxoacetyl)-glycine methyl ester
- DUSP
- dual specificity phosphatase
- MKP
- MAPK phosphatase
- BIM
- bisindolylmaleimide I
- ER
- estrogen receptor
- MTT
- 3-(4,5-dimethylthiazol-2-yl)-2,5-diphenyltetrazolium bromide
- DPI
- diphenyleneiodonium
- NP
- sodium pyruvate
- ROS
- reactive oxygen species
- EGFP
- enhanced green fluorescent protein
- pERK and tERK
- phosphorylated and total ERK, respectively
- pAkt and tAkt
- phosphorylated and total Akt, respectively
- pPKC and tPKC
- phosphorylated and total PKC, respectively.
REFERENCES
- 1. Linehan W. M., Bratslavsky G., Pinto P. A., Schmidt L. S., Neckers L., Bottaro D. P., Srinivasan R. (2010) Molecular diagnosis and therapy of kidney cancer. Annu. Rev. Med. 61, 329–343 [DOI] [PMC free article] [PubMed] [Google Scholar]
- 2. Koochekpour S., Jeffers M., Wang P. H., Gong C., Taylor G. A., Roessler L. M., Stearman R., Vasselli J. R., Stetler-Stevenson W. G., Kaelin W. G., Jr., Linehan W. M., Klausner R. D., Gnarra J. R., Vande Woude G. F. (1999) The von Hippel-Lindau tumor suppressor gene inhibits hepatocyte growth factor/scatter factor-induced invasion and branching morphogenesis in renal carcinoma cells. Mol. Cell. Biol. 19, 5902–5912 [DOI] [PMC free article] [PubMed] [Google Scholar]
- 3. Peruzzi B., Athauda G., Bottaro D. P. (2006) The von Hippel-Lindau tumor suppressor gene product represses oncogenic beta-catenin signaling in renal carcinoma cells. Proc. Natl. Acad. Sci. U.S.A. 103, 14531–14536 [DOI] [PMC free article] [PubMed] [Google Scholar]
- 4. Rubin J. S., Bottaro D. P. (2011) HGF basis sequence: mouse. UCSD Molecule Pages 10.6072/H0.MP.A004032.01 [DOI] [Google Scholar]
- 5. Chitalia V. C., Foy R. L., Bachschmid M. M., Zeng L., Panchenko M. V., Zhou M. I., Bharti A., Seldin D. C., Lecker S. H., Dominguez I., Cohen H. T. (2008) Jade-1 inhibits Wnt signalling by ubiquitylating beta-catenin and mediates Wnt pathway inhibition by pVHL. Nat. Cell Biol. 10, 1208–1216 [DOI] [PMC free article] [PubMed] [Google Scholar]
- 6. Choueiri T. K., Vaishampayan U., Rosenberg J. E., Logan T. F., Harzstark A. L., Bukowski R. M., Rini B. I., Srinivas S., Stein M. N., Adams L. M., Ottesen L. H., Laubscher K. H., Sherman L., McDermott D. F., Haas N. B., Flaherty K. T., Ross R., Eisenberg P., Meltzer P. S., Merino M. J., Bottaro D. P., Linehan W. M., Srinivasan R. (2013) Phase II and biomarker study of the dual MET/VEGFR2 inhibitor foretinib in patients with papillary renal cell carcinoma. J. Clin. Oncol. 31, 181–186 [DOI] [PMC free article] [PubMed] [Google Scholar]
- 7. Asnaghi L., Lin M. H., Lim K. S., Lim K. J., Bar E. E., Geberhart C. G. (2013) Hypoxia-inducible factor 1a (HIF1α) has a prometastatic effect in uveal melanoma. American Association for Cancer Research Annual Meeting, Washington, D. C., April 6–10, 2013, Abstract 3776 [Google Scholar]
- 8. Chaudary N., Mujcic H., Wouters B. G., Hill R. P. (2013) Hypoxia and metastasis in an orthotopic cervix cancer xenograft model. Radiother. Oncol. 108, 506–510 [DOI] [PubMed] [Google Scholar]
- 9. Cooke V. G., LeBleu V. S., Keskin D., Khan Z., O'Connell J. T., Teng Y., Duncan M. B., Xie L., Maeda G., Vong S., Sugimoto H., Rocha R. M., Damascena A., Brentani R. R., Kalluri R. (2012) Pericyte depletion results in hypoxia-associated epithelial-to-mesenchymal transition and metastasis mediated by Met signaling pathway. Cancer Cell 21, 66–81 [DOI] [PMC free article] [PubMed] [Google Scholar]
- 10. Hara S., Nakashiro K., Klosek S. K., Ishikawa T., Shintani S., Hamakawa H. (2006) Hypoxia enhances c-Met/HGF receptor expression and signaling by activating HIF-1α in human salivary gland cancer cells. Oral Oncol. 42, 593–598 [DOI] [PubMed] [Google Scholar]
- 11. Ide T., Kitajima Y., Miyoshi A., Ohtsuka T., Mitsuno M., Ohtaka K., Koga Y., Miyazaki K. (2006) Tumor-stromal cell interaction under hypoxia increases the invasiveness of pancreatic cancer cells through the hepatocyte growth factor/c-Met pathway. Int. J. Cancer 119, 2750–2759 [DOI] [PubMed] [Google Scholar]
- 12. Monnier Y., Farmer P., Bieler G., Imaizumi N., Sengstag T., Alghisi G. C., Stehle J. C., Ciarloni L., Andrejevic-Blant S., Moeckli R., Mirimanoff R. O., Goodman S. L., Delorenzi M., Rüegg C. (2008) CYR61 and αVβ5 integrin cooperate to promote invasion and metastasis of tumors growing in preirradiated stroma. Cancer Res. 68, 7323–7331 [DOI] [PubMed] [Google Scholar]
- 13. Pennacchietti S., Michieli P., Galluzzo M., Mazzone M., Giordano S., Comoglio P. M. (2003) Hypoxia promotes invasive growth by transcriptional activation of the Met protooncogene. Cancer Cell 3, 347–361 [DOI] [PubMed] [Google Scholar]
- 14. Bernhardt W. M., Schmitt R., Rosenberger C., Münchenhagen P. M., Gröne H. J., Frei U., Warnecke C., Bachmann S., Wiesener M. S., Willam C., Eckardt K. U. (2006) Expression of hypoxia-inducible transcription factors in developing human and rat kidneys. Kidney Int. 69, 114–122 [DOI] [PubMed] [Google Scholar]
- 15. van Adelsberg J., Sehgal S., Kukes A., Brady C., Barasch J., Yang J., Huan Y. (2001) Activation of hepatocyte growth factor (HGF) by endogenous HGF activator is required for metanephric kidney morphogenesis in vitro. J. Biol. Chem. 276, 15099–15106 [DOI] [PubMed] [Google Scholar]
- 16. Peruzzi B., Bottaro D. P. (2006) Targeting the c-Met signaling pathway in cancer. Clin. Cancer Res. 12, 3657–3660 [DOI] [PubMed] [Google Scholar]
- 17. Peruzzi B., Bottaro D. P. (2006) β-Catenin signaling: linking renal cell carcinoma and polycystic kidney disease. Cell Cycle 5, 2839–2841 [DOI] [PubMed] [Google Scholar]
- 18. Athauda G., Giubellino A., Coleman J. A., Horak C., Steeg P. S., Lee M. J., Trepel J., Wimberly J., Sun J., Coxon A., Burgess T. L., Bottaro D. P. (2006) c-Met ectodomain shedding rate correlates with malignant potential. Clin. Cancer Res. 12, 4154–4162 [DOI] [PubMed] [Google Scholar]
- 19. Ben-Ami I., Yao Z., Naor Z., Seger R. (2011) Gq protein-induced apoptosis is mediated by AKT kinase inhibition that leads to protein kinase C-induced c-Jun N-terminal kinase activation. J. Biol. Chem. 286, 31022–31031 [DOI] [PMC free article] [PubMed] [Google Scholar] [Retracted]
- 20. Guan L., Song K., Pysz M. A., Curry K. J., Hizli A. A., Danielpour D., Black A. R., Black J. D. (2007) Protein kinase C-mediated down-regulation of cyclin D1 involves activation of the translational repressor 4E-BP1 via a phosphoinositide 3-kinase/Akt-independent, protein phosphatase 2A-dependent mechanism in intestinal epithelial cells. J. Biol. Chem. 282, 14213–14225 [DOI] [PubMed] [Google Scholar]
- 21. Liao Y., Hung M. C. (2010) Physiological regulation of Akt activity and stability. Am. J. Transl. Res. 2, 19–42 [PMC free article] [PubMed] [Google Scholar]
- 22. Gopalakrishna R., Gundimeda U., Fontana J. A., Clarke R. (1999) Differential distribution of protein phosphatase 2A in human breast carcinoma cell lines and its relation to estrogen receptor status. Cancer Lett. 136, 143–151 [DOI] [PubMed] [Google Scholar]
- 23. Tanida I., Ueno T., Kominami E. (2004) LC3 conjugation system in mammalian autophagy. Int. J. Biochem. Cell Biol. 36, 2503–2518 [DOI] [PMC free article] [PubMed] [Google Scholar]
- 24. Kabeya Y., Mizushima N., Ueno T., Yamamoto A., Kirisako T., Noda T., Kominami E., Ohsumi Y., Yoshimori T. (2000) LC3, a mammalian homologue of yeast Apg8p, is localized in autophagosome membranes after processing. EMBO J. 19, 5720–5728 [DOI] [PMC free article] [PubMed] [Google Scholar]
- 25. Maiuri M. C., Zalckvar E., Kimchi A., Kroemer G. (2007) Self-eating and self-killing: cross-talk between autophagy and apoptosis. Nat. Rev. Mol. Cell Biol. 8, 741–752 [DOI] [PubMed] [Google Scholar]
- 26. Klionsky D. J. (2007) Autophagy: from phenomenology to molecular understanding in less than a decade. Nat. Rev. Mol. Cell Biol. 8, 931–937 [DOI] [PubMed] [Google Scholar]
- 27. Degtyarev M., De Mazière A., Orr C., Lin J., Lee B. B., Tien J. Y., Prior W. W., van Dijk S., Wu H., Gray D. C., Davis D. P., Stern H. M., Murray L. J., Hoeflich K. P., Klumperman J., Friedman L. S., Lin K. (2008) Akt inhibition promotes autophagy and sensitizes PTEN-null tumors to lysosomotropic agents. J. Cell Biol. 183, 101–116 [DOI] [PMC free article] [PubMed] [Google Scholar]
- 28. Esteban M. A., Tran M. G., Harten S. K., Hill P., Castellanos M. C., Chandra A., Raval R., O'brien T, S., Maxwell P. H. (2006) Regulation of E-cadherin expression by VHL and hypoxia-inducible factor. Cancer Res. 66, 3567–3575 [DOI] [PubMed] [Google Scholar]
- 29. Krishnamachary B., Zagzag D., Nagasawa H., Rainey K., Okuyama H., Baek J. H., Semenza G. L. (2006) Hypoxia-inducible factor-1-dependent repression of E-cadherin in von Hippel-Lindau tumor suppressor-null renal cell carcinoma mediated by TCF3, ZFHX1A, and ZFHX1B. Cancer Res. 66, 2725–2731 [DOI] [PubMed] [Google Scholar]
- 30. Lee K., Zhang H., Qian D. Z., Rey S., Liu J. O., Semenza G. L. (2009) Acriflavine inhibits HIF-1 dimerization, tumor growth, and vascularization. Proc. Natl. Acad. Sci. U.S.A. 106, 17910–17915 [DOI] [PMC free article] [PubMed] [Google Scholar] [Retracted]
- 31. Liao D., Johnson R. S. (2007) Hypoxia: a key regulator of angiogenesis in cancer. Cancer Metastasis Rev. 26, 281–290 [DOI] [PubMed] [Google Scholar]
- 32. Mak P., Leav I., Pursell B., Bae D., Yang X., Taglienti C. A., Gouvin L. M., Sharma V. M., Mercurio A. M. (2010) ERβ impedes prostate cancer EMT by destabilizing HIF-1α and inhibiting VEGF-mediated snail nuclear localization: implications for Gleason grading. Cancer Cell 17, 319–332 [DOI] [PMC free article] [PubMed] [Google Scholar]
- 33. Wu M. Z., Tsai Y. P., Yang M. H., Huang C. H., Chang S. Y., Chang C. C., Teng S. C., Wu K. J. (2011) Interplay between HDAC3 and WDR5 is essential for hypoxia-induced epithelial-mesenchymal transition. Mol. Cell 43, 811–822 [DOI] [PubMed] [Google Scholar]
- 34. Kim S. D., Moon C. K., Eun S. Y., Ryu P. D., Jo S. A. (2005) Identification of ASK1, MKK4, JNK, c-Jun, and caspase-3 as a signaling cascade involved in cadmium-induced neuronal cell apoptosis. Biochem. Biophys. Res. Commun. 328, 326–334 [DOI] [PubMed] [Google Scholar]
- 35. McCubrey J. A., Lahair M. M., Franklin R. A. (2006) Reactive oxygen species-induced activation of the MAP kinase signaling pathways. Antioxid. Redox. Signal. 8, 1775–1789 [DOI] [PubMed] [Google Scholar]
- 36. Ouyang M., Shen X. (2006) Critical role of ASK1 in the 6-hydroxydopamine-induced apoptosis in human neuroblastoma SH-SY5Y cells. J. Neurochem. 97, 234–244 [DOI] [PubMed] [Google Scholar]
- 37. Yeo J. E., Kim J. H., Kang S. K. (2008) Selenium attenuates ROS-mediated apoptotic cell death of injured spinal cord through prevention of mitochondria dysfunction: in vitro and in vivo study. Cell Physiol. Biochem. 21, 225–238 [DOI] [PubMed] [Google Scholar]
- 38. Torres M., Forman H. J. (2003) Redox signaling and the MAP kinase pathways. Biofactors 17, 287–296 [DOI] [PubMed] [Google Scholar]
- 39. Ma J., Zhang Q., Chen S., Fang B., Yang Q., Chen C., Miele L., Sarkar F. H., Xia J., Wang Z. (2013) Mitochondrial dysfunction promotes breast cancer cell migration and invasion through HIF1α accumulation via increased production of reactive oxygen species. PLoS One 8, e69485. [DOI] [PMC free article] [PubMed] [Google Scholar] [Retracted]
- 40. Abella J. V., Peschard P., Naujokas M. A., Lin T., Saucier C., Urbé S., Park M. (2005) Met/hepatocyte growth factor receptor ubiquitination suppresses transformation and is required for Hrs phosphorylation. Mol. Cell. Biol. 25, 9632–9645 [DOI] [PMC free article] [PubMed] [Google Scholar]
- 41. Janda E., Lehmann K., Killisch I., Jechlinger M., Herzig M., Downward J., Beug H., Grünert S. (2002) Ras and TGFβ cooperatively regulate epithelial cell plasticity and metastasis: dissection of Ras signaling pathways. J. Cell Biol. 156, 299–313 [DOI] [PMC free article] [PubMed] [Google Scholar]
- 42. Maina F., Panté G., Helmbacher F., Andres R., Porthin A., Davies A. M., Ponzetto C., Klein R. (2001) Coupling Met to specific pathways results in distinct developmental outcomes. Mol. Cell 7, 1293–1306 [DOI] [PubMed] [Google Scholar]
- 43. Tanimura S., Chatani Y., Hoshino R., Sato M., Watanabe S., Kataoka T., Nakamura T., Kohno M. (1998) Activation of the 41/43 kDa mitogen-activated protein kinase signaling pathway is required for hepatocyte growth factor-induced cell scattering. Oncogene 17, 57–65 [DOI] [PubMed] [Google Scholar]
- 44. Tai C. J., Wu A. T., Chiou J. F., Jan H. J., Wei H. J., Hsu C. H., Lin C. T., Chiu W. T., Wu C. W., Lee H. M., Deng W. P. (2010) The investigation of mitogen-activated protein kinase phosphatase-1 as a potential pharmacological target in non-small cell lung carcinomas, assisted by non-invasive molecular imaging. BMC Cancer 10, 95. [DOI] [PMC free article] [PubMed] [Google Scholar]
- 45. Wong V. C., Chen H., Ko J. M., Chan K. W., Chan Y. P., Law S., Chua D., Kwong D. L., Lung H. L., Srivastava G., Tang J. C., Tsao S. W., Zabarovsky E. R., Stanbridge E. J., Lung M. L. (2012) Tumor suppressor dual-specificity phosphatase 6 (DUSP6) impairs cell invasion and epithelial-mesenchymal transition (EMT)-associated phenotype. Int. J. Cancer 130, 83–95 [DOI] [PubMed] [Google Scholar]
- 46. Abedin M. J., Wang D., McDonnell M. A., Lehmann U., Kelekar A. (2007) Autophagy delays apoptotic death in breast cancer cells following DNA damage. Cell Death Differ. 14, 500–510 [DOI] [PubMed] [Google Scholar]
- 47. Pursiheimo J. P., Rantanen K., Heikkinen P. T., Johansen T., Jaakkola P. M. (2009) Hypoxia-activated autophagy accelerates degradation of SQSTM1/p62. Oncogene 28, 334–344 [DOI] [PubMed] [Google Scholar]
- 48. Zhang H., Bosch-Marce M., Shimoda L. A., Tan Y. S., Baek J. H., Wesley J. B., Gonzalez F. J., Semenza G. L. (2008) Mitochondrial autophagy is an HIF-1-dependent adaptive metabolic response to hypoxia. J. Biol. Chem. 283, 10892–10903 [DOI] [PMC free article] [PubMed] [Google Scholar] [Retracted]
- 49. Ueda K., Lu Q., Baur W., Aronovitz M. J., Karas R. H. (2013) Rapid estrogen receptor signaling mediates estrogen-induced inhibition of vascular smooth muscle cell proliferation. Arterioscler. Thromb. Vasc. Biol. 33, 1837–1843 [DOI] [PMC free article] [PubMed] [Google Scholar]
- 50. DeRose Y. S., Wang G., Lin Y. C., Bernard P. S., Buys S. S., Ebbert M. T., Factor R., Matsen C., Milash B. A., Nelson E., Neumayer L., Randall R. L., Stijleman I. J., Welm B. E., Welm A. L. (2011) Tumor grafts derived from women with breast cancer authentically reflect tumor pathology, growth, metastasis and disease outcomes. Nat. Med. 17, 1514–1520 [DOI] [PMC free article] [PubMed] [Google Scholar]