

Background: Resistance to glucocorticoid agonists is a major challenge in the treatment of pediatric leukemia.
Results: TBL1XR1 knockdown decreases glucocorticoid signaling and response in leukemia cells.
Conclusion: Deletions in TBL1XR1 at relapse may drive resistance to glucocorticoid agonists.
Significance: Identifying drivers of glucocorticoid resistance in leukemia may allow for the identification of novel therapies for the treatment of recurrent disease.
Keywords: Cancer Biology, Chemoresistance, Glucocorticoid, Leukemia, Transcription Corepressor, Acute Lymphoblastic Leukemia, Relapsed Childhood Leukemia, TBL1XR1 Deletions
Abstract
Although great advances have been made in the treatment of pediatric acute lymphoblastic leukemia, up to one of five patients will relapse, and their prognosis thereafter is dismal. We have previously identified recurrent deletions in TBL1XR1, which encodes for an F-box like protein responsible for regulating the nuclear hormone repressor complex stability. Here we model TBL1XR1 deletions in B-precursor ALL cell lines and show that TBL1XR1 knockdown results in reduced glucocorticoid receptor recruitment to glucocorticoid responsive genes and ultimately decreased glucocorticoid signaling caused by increased levels of nuclear hormone repressor 1 and HDAC3. Reduction in glucocorticoid signaling in TBL1XR1-depleted lines resulted in resistance to glucocorticoid agonists, but not to other chemotherapeutic agents. Importantly, we show that treatment with the HDAC inhibitor SAHA restores sensitivity to prednisolone in TBL1XR1-depleted cells. Altogether, our data indicate that loss of TBL1XR1 is a novel driver of glucocorticoid resistance in ALL and that epigenetic therapy may have future application in restoring drug sensitivity at relapse.
Introduction
Acute lymphoblastic leukemia (ALL)2 is the most common form of childhood cancer, and although survival rates have improved markedly, up to one of five patients relapse, many of whom will not survive long term (1). Relapsed leukemic cells demonstrate intrinsic chemoresistance compared with leukemic cells at diagnosis, indicating the selection of genetic and cellular traits through evolutionary pressures associated with chemotherapy (2). A mainstay of treatment in ALL is glucocorticoid agonists. In particular, relapsed leukemic cells have been shown to be 357 and 24 times more resistant to prednisolone and dexamethasone, respectively (2). This increase in resistance is greater than any other class of agents used in the treatment of ALL (2). Furthermore, resistance to glucocorticoids at diagnosis is associated with a poor prognosis in childhood ALL and has been demonstrated to be an independent prognostic factor for relapse (3–5). Therefore, it is important to discover the underlying biological pathways that are responsible for the acquisition of glucocorticoid (GC) resistance in ALL.
We and others have described recurrent deletions with concordant decreased gene expression in TBL1XR1 at relapse (6, 7). TBL1XR1 deletions are enriched at relapse compared with diagnosis (6–8), and importantly TBL1XR1 deletions at diagnosis occur more frequently in patients that ultimately relapse (9). TBL1XR1 is a member of the nuclear receptor corepressor (NCoR) complex and is responsible for the degradation of NCoR (10, 11). The degradation of the NCoR complex by TBL1XR1 is required for gene activation by many liganded nuclear receptors, as well as other transcription factors (10–14). Relapse-specific mutations in NCoR1 (15), as well as increased expression of the enzymatically active members of the NCoR complex, histone deacetylases (HDACs), have also been described in relapsed ALL (6). Increased expression of HDAC3, HDAC4, HDAC7, and HDAC9 correlate with a poor prognosis when noted at diagnosis (16, 17). Given that multiple members of the NCoR complex are misregulated at relapse, it is likely that the activity of this complex plays a role in the development of recurrent disease.
Glucocorticoids are members of the steroid hormone family that mediates the transcriptional effects of the glucocorticoid receptor (GR) (18). The bulk of inactive GR is sequestered in the cytoplasm, bound by chaperone proteins. Upon hormone binding, the GR receptor translocates into the nucleus and is recruited to glucocorticoid responsive elements (GREs), where it then activates or represses transcription (19, 20). Unlike other classes of nuclear hormone receptors, GR activity has not yet been shown to be mediated through the nuclear corepressor (NCoR) complex (21).
We hypothesized that TBL1XR1 may result in increased resistance to chemotherapy, specifically GC agonists and therefore be a driver of relapse in ALL. We show that decreased expression of TBL1XR1 results in resistance to glucocorticoid agonist, prednisolone, but not to other classes of chemotherapy tested. The increased prednisolone resistance is caused by a decrease in GR recruitment at gene regulatory regions, resulting in decreased glucocorticoid signaling. The decrease in GR recruitment is driven by increased levels of NCoR1 residing on the promoters of prednisolone responsive genes with increased recruitment of HDAC3, resulting in altered GR-mediated transcription. Furthermore, pretreatment with the HDAC inhibitor suberoylanilidehydroxamic acid (SAHA) resensitizes TBL1XR1-deficient cells to prednisolone by restoring GC signaling. Altogether, these data suggest that TBL1XR1 is a novel regulator of glucocorticoid signaling and a driver of drug resistance in ALL.
MATERIALS AND METHODS
Cells and Reagents
The B-lineage leukemia cell lines RS4;11, Reh (ATCC), and UOCB1 (22) were grown in RPMI1640 medium, and HEK293T cells (ATCC) were grown in DMEM. All cell lines were supplemented with 10% FBS, 10 mm HEPES buffer, 1% penicillin/streptomycin under 5% CO2 at 37 °C. SAHA (10009929; Cayman Chemical, Ann Arbor, MI) and etoposide (E1383; Sigma-Aldrich) were prepared in DMSO. Doxorubicin (D1515; Sigma-Aldrich) was prepared in double-distilled water. Prednisolone (Pharmacia) was suspended in 0.9% NaCl. 6-Thioguanine (A4882; Sigma-Aldrich) was prepared in 1 m NaOH. Drugs were diluted in RPMI and added to the cultured cells at the indicated concentrations for 24–48 h.
Lentivirus Preparation and Cell Infections
pLKO.1 lentiviral constructs encoding shRNA against TBL1XR1 (shRNA1: TRCN0000060744 and shRNA2: TRCN0000060746), NCoR1 (TRCN0000060654), or nontargeting shRNA (SHC016) along with packaging vectors coding for VSV-G, Gag-Pol, and Rev were transfected into 293T packaging cells, and viral supernatant was collected according to standard protocols. Cells were cultured with virus containing media with 8 μg/ml of Polybrene (TR-1003-G; Millipore) overnight after 90 min centrifugation at 1500 rpm. RS4;11, Reh, and UOCB1 cells were selected with 2–4 μg/ml of puromycin for 72 h.
Quantitative RT-PCR Analysis
Total RNA was extracted using the RNeasy mini kit (Qiagen), and RT-PCR was performed using the I-Script II complementary DNA synthesis kit (Bio-Rad) and the PerfeCTA SYBR Green FastMix (Quanta Biosciences). Synthesis of PCR products was monitored by the Stratagene Mx3005P and normalized to β2-microglobulin levels. The data were plotted relative to mRNA levels in control samples using the ΔΔCt method. Primers were designed to cross two adjacent exon regions to measure mature RNA levels or to cross an exon/intron boundary to assess nascent RNA levels (23). Statistical significance was calculated using Student's t test.
Immunoblotting
The cells were lysed in radioimmune precipitation assay buffer (50 mm Tris-HCl, pH 7.4, 150 mm NaCl 1% Nonidet P-40, 0.25% sodium deoxycholate, and 1× complete protease inhibitor mixture; Roche) for 10 min on ice and then spun at 13,000 rpm for 10 min at 4 °C. Protein was subjected to electrophoresis and transferred to PDVF membrane. The primary antibodies were diluted as follows: GR (Abcam; ab3579) 1 μg/ml, NCoR1 (Millipore; CS207360) 5 μg/ml, TBL1XR1 (Santa Cruz; sc-100908) 1:500, HDAC3 (Abcam; ab7030) 6.7 μg/ml, cleaved PARP (Cell Signaling; 9541S) 1:1000, PARP1 (Cell Signaling; 9532), tubulin (Abcam; ab4074), Actin (Abcam; Ac-15) 1:10,000, and HP1γ (Cell Signaling; 2619s) 1:1000. The membranes were then incubated with secondary antibodies, horseradish peroxidase-conjugated anti-mouse, or anti-rabbit IgG (GE Healthcare) 1:10,000 diluted in 4% nonfat dry milk PBS for 1 h at room temperature. Signals were visualized using ECL (GE Healthcare).
Cell Viability Assays
CellTiter-Glo Luminescent cell viability assays (Promega) were performed on cell lines exposed to chemotherapy. The cells were seeded in a 96-well plate and incubated with prednisolone (200, 350, 400, 450, 500, 550, and 600 μg/ml), etoposide (0.2, 0.6, 0.8, 1, 4, and 8 μg/ml), doxorubicin (25, 50, 75, 100, 250, and 500 nm), or 6-thioguanine (0.1, 0.5, 1, 2.5, 25, 250, and 500 μg/ml) added to the medium for 24–48 h. For time course experiments, RS4;11 control and TBL1XR1 knockdown cells were incubated with 0, 0.005, 0.01, 0.05, 0.1, 0.5, 300, or 500 μg/ml prednisolone for 24, 48, or 72 h. For HDAC inhibitor experiments, the cells were seeded in a 96-well plate and incubated with 1 μm SAHA for 24 h followed by prednisolone treatment for an additional 24 h. Following this, CellTiter-Glo reagent was added, and luminescence was recorded using a Flex Station 3 plate reader (Molecular Devices). Each doxorubicin, etoposide, and 6-thioguanine viability assay was repeated twice in replicates of three. Prednisolone and SAHA assays were repeated three times in replicates of three. Statistical significance was calculated using Student's t test.
Apoptosis Assays
After a 24-h incubation with prednisolone, apoptosis was determined by annexin V-PE and 7-amino-actinomycin D staining (annexin V-PE apoptosis detection kit; BD Pharmingen, San Diego, CA) followed by flow cytometry using the FACSCalibur (Becton Dickinson, Franklin Lakes, NJ). The percentage of annexin V/7-amino-actinomycin D-positive and -negative cells were analyzed by FlowJo software (version 7.2.5; Tree Star Inc., Ashland, OR). Each experiment was repeated three times. Statistical significance was calculated using Student's t test.
Microarray Analysis
RNA was isolated from nontargeting and TBL1XR1 knockdown cell lines after treatment with vehicle or prednisolone for 8 h from three independent experiments using the RNeasy mini kit (Qiagen). Quality was verified with an Agilent 2100 Bioanalyzer. In vitro transcription was completed with biotinylated UTP and CTP for labeling using the ENZO BioArray high yield RNA transcript labeling kit (Enzo Diagnostics). Labeled cRNA was fragmented and hybridized to Affymetrix U133Plus2 microarrays according to the Affymetrix protocol. Raw Affymetrix CEL files were processed with GeneSpringGX 11.5 (Agilent Technologies, Inc., Santa Clara, CA) using the standard Affymetrix probe-modeling algorithm RMA. Background correction and quantile normalization were applied. Only gene probe sets with signals higher than 20 in at least one condition were further considered. Gene expression alterations between pairs of prednisolone-treated cells and vehicle-treated control cells were determined by employing a paired t test analysis on three and two paired samples in the nontargeting and TBL1XR1 knockdown lines, respectively. Multiple testing correction analysis revealed little difference, likely because of experimental limitations that result from a small sample size. t test analysis without correction was used to identify differences. In nontargeting cells, gene probe sets that were significantly altered (p ≤ 0.05) and that displayed a 2-fold induction/repression in response to prednisolone were selected. The difference between the average log-fold changes in nontargeting and TBL1XR1 knockdown cells was calculated. Only probe sets that displayed a difference of at least 25% (Δ log-fold change ≥ 0.322) between the nontargeting, and TBL1XR1 knockdown lines were considered in this analysis. Heat maps were produced using GENE-E software.
Small Scale Biochemical Cell Fractionation
Ten million cells were treated with vehicle or 500 μg/ml prednisolone for 3 h and collected for small scale biochemical cell fractionation including cytosolic, soluble nuclear, and chromatin-bound fractions as previously described (25).
Chromatin Immunoprecipitation
ChIP was carried out following the protocol provided by EZ-ChIP (Millipore) with few modifications. Briefly, control and TBL1XR1 knockdown Reh cells (1 × 10⁶ cells per immunoprecipitation) were treated with vehicle or prednisolone (500 μg/ml) for three h. Proteins were then cross-linked to DNA with 1% formaldehyde (10 min at 37 °C), followed by cell lysis with 1% SDS buffer. The cell lysates were sonicated to shear DNA to the length of 200–1,000 base pairs using the Bioruptor (Diagenode) for 20 cycles of 30 s on and 30 s off. Magnetic protein G Dyna beads (life Technologies; 10007D) were used for the preclearing of chromatin and immunoprecipitation using the following antibodies: GR (Abcam; ab3579), NCoR1 (Millipore; CS207360), TBL1XR1 (Abcam; ab24551), and HDAC3 (Abcam; ab7030). For the negative control, species-specific IgG was used. DNA from protein-associated complexes, and corresponding input samples (nonimmunoprecipitated DNA) were recovered using the QIAquick PCR purification kit (Qiagen) and assayed by real time PCR under standard conditions. Primers were targeted to the previously annotated GREs on GILZ ((A in Fig. 7b) 8694 and (B in Fig. 7b) 5131 base pairs downstream from transcription start site) and TXNIP ((C in Fig. 7b) 141 base pairs upstream from the transcription start site and (D in Fig. 7b) 3463 base pairs downstream from the transcriptional start site) genes.
FIGURE 7.

a, schematic representation of the GILZ and TXNIP gene with bent arrows representing the transcription start site, open boxes represent GRE sites interrogated by ChIP PCR, and amplicons represented by capital letters. b, ChIP was performed on the regulatory regions of GILZ and TXNIP genes using GR, TBL1XR1, NCoR1, and HDAC3 antibodies in RS4;11 after a 3-h stimulation with 500 μg/ml prednsiolone (Pred). Each graph shows the enrichment over input normalized relative to the species specific IgG background. Error bars represent standard deviations.
Analysis of ex Vivo Treated Clinical Samples
Written informed assent or consent was obtained from patients or their parents/guardians (as appropriate). The research and use of these samples were approved by the institutional review board at St. Jude Children's Research Hospital. DNA was isolated at the time of diagnosis from lymphoblasts from patient bone marrow aspirates. Genome-wide copy number status was determined using either Affymetrix 500K or Affymetrix SNP6 arrays and Affymetrix Power Tools copy number pipeline in accordance with the manufacturer's protocol (Affymetrix, Santa Clara, CA). All microarrays were performed by the St. Jude Children's Research Hospital, Hartwell Center for Bioinformatics & Biotechnology. Statistical analyses were performed using R, and exact Wilcoxon Mann-Whitney rank sum tests were used for significance testing. Ex vivo drug sensitivity assays were performed as previously described (26). In brief, leukemia cells were isolated at diagnosis from patient bone marrow aspirates. If the leukemia cell percentage from diagnostic bone marrow samples was less than 90%, magnetic activated cell sorting (Miltenyl Biotec, Auburn, CA) was performed to further enrich for leukemia cells. If red cell contamination was greater than 30%, red blood cell lysis was performed. The cells were centrifuged at 300 × g for 5 min and resuspended at a concentration of 2,000,000 cells/ml. Eighty microliters of this leukemia cell suspension was then plated into each experimental well of round-bottomed 96-well plates. Twenty microliters of decreasing concentrations of prednisolone were added, and the plates were incubated for 96 h in a humidified incubator containing 5% CO2 at 37 °C. For the final 6 h, 10 μl of 5 mg/ml 3–4,5-dimethylthiazol-2,5-diphenyl tetrazolium bromide was added to each experimental well. LC50 values were determined as previously described (26).
RESULTS
TBL1XR1 Is Deleted with Decreased Gene Expression at Relapse in Primary ALL Samples
We have previously established an integrated genomics profile of relapsed ALL (6). Through this study, we and others have identified focal deletions in TBL1XR1 in ∼10.7% of patients at relapse (6, 7). Our study identified six patients harboring a TBL1XR1 deletion in a total of 56 patients. These deletions vary in location either covering the TBL1XR1 gene or the region immediately upstream of the gene (Fig. 1). Gene expression data were available on a subset (46 of 56) of these patients (8). Importantly, the two of three patients with relapse-specific deletions had gene expression data. We observed a significant decrease in TBL1XR1 gene expression at relapse compared diagnosis (Table 1). The overall expression of TBL1XR1 at relapse compared with diagnosis was not changed (ratio 1.084 ± 0.0540) in a cohort of 49 matched pairs (46 with overlapping copy number data plus an additional 3 patients with only gene expression data) (data not shown) (6). Furthermore, CpG promoter methylation of the TBL1XR1 gene is not altered at relapse compared with diagnosis (data not shown) (6). This suggests that decreased gene expression at relapse is only seen in the subset of patients harboring a TBL1XR1 deletion and that other mechanisms to decrease expression are not operative. Previous reports indicate that at diagnosis TBL1XR1 deletions are enriched in the EVT6-RUNX1 subtype (8), and two of our six patients harbor this translocation (Table 1).
FIGURE 1.

Genomic profile of chromosome 3 (regions) in 6 B precursor ALL diagnosis and relapse pairs harboring TBL1XR1 deletion identified by SNP6 array. TBL1XR1 gene exon-intron structure was drawn to scale. Exons are represented by short vertical bars. TBL1XR1 is located at chromosome 3 at positions 176738542–176915048. TSS indicates transcription state site. The blue areas indicate deleted regions, and the red areas indicate regions of copy number gain.
TABLE 1.
Patients with relapse-specific or shared TBL1XR1 deletions and the fold change in gene expression of TBL1XR1 at relapsed compared to diagnosis from microarray analysis as well as cytogenetic features of patients
| Patient | Relapse specific or shared | Expression data | Fold change at relapse | Cytogenetics |
|---|---|---|---|---|
| 1 | Shared | Yes | 0.9501 | TEL-AML |
| 2 | Shared | Yes | 1.6577 | Hyperdiploid-trisomy 4,10 |
| 3 | Relapse | Yes | 0.7365 | TEL-AML |
| 4 | Relapse | No | NAa | Normal |
| 5 | Shared | No | NA | Normal |
| 6 | Relapse | Yes | 0.7767 | Normal |
a NA, not applicable.
TBL1XR1 Knockdown Increases Transcriptional Repression by the NCoR Complex
To determine the role of TBL1XR1 in relapsed ALL, we developed RS4;11, Reh, and UOCB1 B-precursor ALL cell lines that express either a control nontargeting shRNA or an shRNA targeting TBL1XR1. We have chosen to use three cell lines of diverse genetic backgrounds to explore the role of TBL1XR1 deletions in chemoresistance. RS4;11 and UOCB1 cells have also been previously used to characterize pathways that mediate prednisolone sensitivity (27, 28). It should be noted that although Reh cells have been characterized as having undetectable levels of GR (29), we have previously shown that Reh cells respond to steroid treatment comparably to primary patient samples, as well as other ALL cell lines, and express GR (30). We authenticated our parental Reh cell lines through short tandem repeat analysis by ATCC, and cytogenetic analysis confirmed the t(12;21), EVT6/RUNX1 translocation by cytogenetic analysis (data not shown). Lastly, the expression of GR was again confirmed and was comparable to other cell lines (Fig. 2).
FIGURE 2.
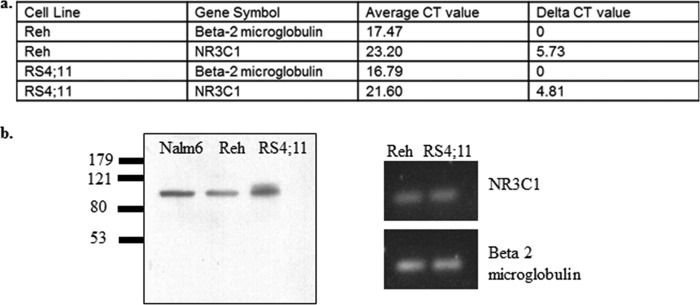
a, RT-PCR values for loading control β2-microglobulin and NR3C1 in Reh and RS4;11 cells. b, Western blot for GR in B-precursor ALL cell lines: Nalm6, Reh, and RS4;11.
We confirmed knockdown of TBL1XR1 at the protein level in RS4;11 (Fig. 3a), Reh (Fig. 3b), and UOCB1 (Fig. 3c). Knockdown of TBL1XR1 had no effect on TBL1, a highly homologous F-box like protein also capable of regulating corepressor expression (11) (data not shown). Because TBL1XR1 plays a role in the degradation of NCoR proteins (11), we determined the levels of NCoR and its associated protein HDAC3 in nontargeting and TBL1XR1 knockdown cell lines by Western blot. The TBL1XR1 knockdown lines had higher levels of NCoR1 protein but no difference in overall HDAC3 levels compared with the nontargeting cell lines (Fig. 3, a–c). No significant change in NCOR1 mRNA expression was observed in the TBL1XR1 knockdown cell lines compared with control, which is consistent with its function as an F-box-like protein involved in the recruitment of the ubiquitin proteasome system (Ref. 31 and data not shown).
FIGURE 3.

a–c, Western blot of TBL1XR1, NCoR1, and HDAC3 in cells with nontargeting shRNA (NT) and cells with TBL1XR1 targeting shRNA in RS4;11 cells (a), Reh cells (b), and UOCB1 cells (c). d–f, RT-PCR on known NCoR complex target genes c-Myc and Hes1 in RS4;11 cells (d), Reh cells (e), and UOCB1 cells (f).
TBL1XR1 knockdown in the Reh and UOCB1 cell lines resulted in a decreased gene expression of c-Myc and Hes1, two genes known to be regulated by the NCoR complex (10) (Fig. 3, e and f). The TBL1XR1 knockdown RS4;11 cell line also had a decreased expression of c-Myc compared with control cell line (Fig. 3d). Hes1 was not highly expressed in RS4;11 cells at baseline, so no further repression was observed upon TBL1XR1 knockdown (data not shown). These data indicate that knockdown of TBL1XR1 results in increased NCoR complex transcriptional repression as a result of enhanced NCoR1 protein stability.
TBL1XR1 Knockdown Results in Resistance to Prednisolone-induced Apoptosis
We next assessed the impact of TBL1XR1 knockdown on drug sensitivity. Knockdown of TBL1XR1 resulted in increased cell viability compared with nontargeting RS4;11, Reh, and UOCB1 cells upon prednisolone treatment over a range of drug concentrations (Fig. 4, a–c). This effect was not observed with other chemotherapeutic agents commonly used in ALL therapy, indicating that the loss of TBL1XR1 was specifically involved in prednisolone resistance (Fig. 4, a–c). Similar results were obtained with a second shRNA (data not shown), suggesting that the effect on prednisolone sensitivity was due to TBL1XR1 knockdown and not an off target effect. We also measured the effect of prednisolone on cell viability in control and TBL1XR1 knockdown RS4;11 cell lines over a range of prednisolone exposure (24, 48, and 72 h). An even greater difference in cell viability was seen between the knockdown and control lines upon treatment with prednisolone for 48 or 72 h compared with the differences observed at a 24-h time point (Fig. 4d). Furthermore, we measured levels of apoptosis upon prednisolone treatment in TBL1XR1 knockdown cell lines and observed significantly less apoptosis compared with the nontargeting RS4;11 (Fig. 4e) and Reh (Fig. 4g) lines. TBL1XR1 knockdown lines also had lower levels of cleaved PARP upon prednisolone treatment compared with control RS4;11 (Fig. 4f) and Reh (Fig. 4h) lines. Decreased levels of cleaved PARP was also observed upon treatment with higher doses of prednisolone (350 and 500 μg/ml) in the TBL1XR1 knockdown lines compared with the controls (data not shown). Overall, these results indicate that decreased expression of TBL1XR1 results in resistance to prednisolone-induced apoptosis in vitro.
FIGURE 4.

Nontargeting shRNA (NT) and TBL1XR1 targeting shRNA cells were treated with increasing concentrations of prednisolone, doxorubicin, and etoposide for 24 h or thioguanine for 48 h. a–d, cell viability was measured by Cell Titer Glo assay. a–d, RS4;11 cells (a), Reh cells (b), UOCB1 cells (c), RS4;11 control (d, NT), and TBL1XR1 knockdown lines were treated with prednisolone at indicated concentrations for 24, 48, or 72 h, and then cell viability was determined by Cell Titer Glo assay. e and g, Nontargeting shRNA (NT) and TBL1XR1 targeting shRNAs were treated with prednisolone for 24 h, and levels of apoptosis were determined by flow cytometry RS4;11 cells (e) and Reh cells (g). f and h, levels of apoptosis were confirmed by Western blot for downstream apoptotic marker cleaved PARP in NT cells, as well as TBL1XR1 knockdown cells in the presence or absence of 200 μg/ml of prednisolone RS4;11 cells (f) and Reh cells (h). Error bars represent standard deviations of two or three replicate experiments. *, significant change with a p value less than or equal to 0.05.
Loss of TBL1XR1 Alters Prednisolone-induced Gene Expression
Because GC agonists are known to induce and repress transcription of many genes (32), we assessed global gene expression in control and TBL1XR1 knockdown Reh cell lines treated with vehicle or 500 μg/ml of prednisolone for 8 h. Gene induction or repression by prednisolone was determined by taking a ratio of prednisolone treated to nontreated gene expression in both the nontargeting and TBL1XR1 knockdown. 507 gene probe sets (representing 374 genes) were induced, and 239 gene probe sets (representing 183 genes) were repressed at least 2-fold (p ≤ 0.05) upon prednisolone treatment in nontargeting lines (supplemental Table S1). Of these 507 prednisolone-induced gene probe sets, 91 probes (representing 74 genes) displayed a reduced induction upon prednisolone treatment in the TBL1XR1 knockdown cells (Fig. 5a and supplemental Table S2). Several of these genes were identified by gene ontology analysis to be pro-apoptotic including: TRIB3, DDIT3, ATF5, GILZ, TXNIP, HIPK3, and BCAP29 (Fig. 5b). In comparison, 68 probe sets (representing 60 genes) were found to have an increased prednisolone-dependent induction in TBL1XR1 knockdown cells (Fig. 5a and supplemental Table S2). Notably, only one of these 60 genes, JMY, was classified as a pro-apoptotic gene (Fig. 5b). JMY is known to regulate apoptosis through p53 (33), whereas most studies show that steroids like prednisolone induce apoptosis through a p53-independent mechanism (34).
FIGURE 5.

a, heat map of altered genes induced/repressed by at least 2-fold (log fold change ≥±1) in prednisolone-treated cells as compare with vehicle-treated cells. Red indicates genes that are induced by prednisolone and blue indicates genes that were repressed upon prednisolone exposure. Log fold change values corresponding to nontargeting (NT) and TBL1XR1 cells are represented by the left and right columns, respectively. All of the genes represented in the heat map have at least 25% difference (Δ fold change) in their transcriptional response to prednisolone between NT and TBL1XR1 knockdown lines. b, fold induction or repression represented in a log scale of genes involved in apoptosis in the NT and TBL1XR1 knockdown lines. c, e, and g, fold induction of steady state RNA levels of prednisolone-induced genes ST6GALNAC3, IL21R, CCPG1, GILZ, and TXNIP in control and TBL1XR1 knockdown, RS4;11 (c), Reh (e), and (g) UOCB1 cells treated with 500 μg/ml prednisolone for 8 h. d, f, and h, fold induction of nascent RNA levels of GILZ and TXNIP in control and TBL1XR1 knockdown RS4;11 (d), Reh (f), and UOCB1 (h) cells treated with 500 μg/ml prednisolone for 8 h. i, induction of BLC2L11 (Bim gene) in Reh, RS4;11, and UOCB1 control and knockdown cell lines. Error bars represent standard deviations. *, significant change with a p value less than or equal to 0.05. Experiments were replicated at least three times.
Among the 239 gene probes sets repressed in response to prednisolone treatment, 82 probe sets (representing 66 genes) had an increased repression in TBL1XR1 knockdown cells (Fig. 5a and supplemental Table S2). Several of these genes are known pro-apoptotic genes including CYCS, TIA1, and BCLAF1 (Fig. 5b). Only 12 gene probe sets (representing 10 genes) were found to have a reduced prednisolone-dependent repression in TBL1XR1 knockdown cells (Fig. 5a and supplemental Table S2), none of which was found to be playing a known role in apoptosis.
We validated several top candidates from microarray results by RT-PCR in Reh as well as RS4;11 and UOCB1 cell lines. The RS4;11, and Reh TBL1XR1 knockdown cells had significantly lower induction of ST6GALNAC3, IL21R, CCPG1, GILZ, and TXNIP compared with the nontargeting cells (Fig. 5, c and e). The UOCB1 TBL1XR1 knockdown lines had significantly lower induction of IL21R, CCPG1, GILZ, and TXNIP compared with the nontargeting cells (Fig. 5g). UOCB1 cells did not express ST6GALNAC3, even upon prednisolone treatment (data not shown). To assess whether TBL1XR1 knockdown was directly effecting GC signaling, we tested the levels of newly transcribed RNA of GILZ and TXNIP (23) (Fig. 5, d, f, and h). The RS4;11, Reh, and UOCB1 TBL1XR1 knockdown cells had less induction of newly transcribed GILZ and TXNIP mRNA (Fig. 5, d, f, and h). Altogether, these data suggest that a decreased level of TBL1XR1 affects a significant subset of genes modulated by prednisolone treatment. Decreased induction of prednisolone-responsive genes upon TBL1XR1 knockdown was also observed upon a shorter 3-h prednisolone exposure (data not shown). Decreased expression of pro-apoptotic protein BIM has been associated with glucocorticoid resistance in ALL (35, 36). BIM induction by prednisolone was not effected by TBL1XR1 knockdown (Fig. 5i). The equal induction of BIM between the control and knockdown lines may account for the remaining prednisolone-induced apoptosis still observed in the TBL1XR1 knockdown cell lines.
Loss of TBL1XR1 Inhibits the Ability of GR to Bind Chromatin
To explore the mechanism by which TBL1XR1 alters GC signaling, we first determined the effect of TBL1XR1 depletion on GR recruitment to total bulk chromatin. As expected, we observed a low baseline level of GR associated with the chromatin fraction that was significantly increased upon prednisolone treatment in control TBL1XR1 expressing RS4;11 (Fig. 6a). In TBL1XR1 knockdown cells, little to no GR was detected in the chromatin-associated fractions in vehicle or prednisolone treatment conditions, despite similar levels of overall cellular GR protein between control and TBL1XR1 knockdown RS4;11 lines (Fig. 6b). Similar levels of GR were also found in TBL1XR1 knockdown and control Reh and UOCB1 cell lines (data not shown). We also observed that TBL1XR1 is associated with chromatin in nontargeting cells but was decreased upon addition of prednisolone (Fig. 6a). Because TBL1XR1 depletion resulted in increased levels of total NCoR1 protein, we also measured the levels of NCoR1 and HDAC3 on bulk chromatin. There was a low level of NCoR1 in the nontargeting cells, whereas NCoR1 levels were increased in the TBL1XR1 knockdown lines. We did not detect NCoR1 in the RS4;11 whole cell lysate, because low levels of basal NCoR1 were detected in RS4;11 cells (Fig. 1a), and only a small number of cells were loaded as a control. The levels of HDAC3 associated with chromatin remained the same in the TBL1XR1 knockdown lines (Fig. 6a). Low levels of tubulin and PARP1 detected in the chromatin-enriched fractions indicate minimal contamination in the chromatin-enriched fractions. These results suggest that a decreased GR recruitment in the absence of TBL1XR1 is associated with increased levels of NCoR1 on chromatin. Similar results were found in the Reh lines (data not shown).
FIGURE 6.
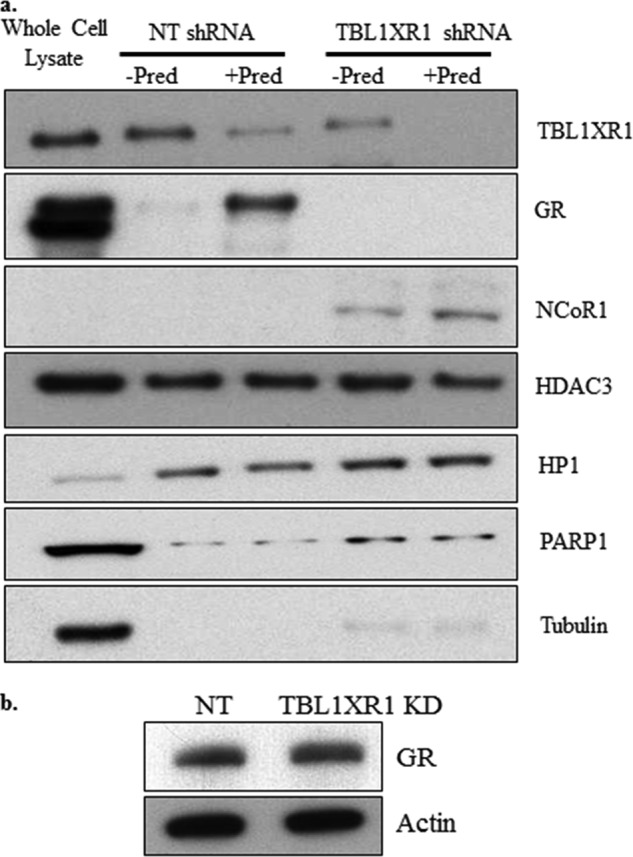
a, nontargeting shRNA (NT) and TBL1XR1 targeting shRNA RS4;11 were treated with 500 μg/ml of prednisolone for 3 h. Chromatin-enriched fractions were extracted followed by immunoblotting to analyze the levels of chromatin-bound TBL1XR1, GR, NCoR1, and HDAC3 proteins. Heterochromatin protein HP1 was used as a loading control for the chromatin-bound fraction, tubulin was used as a control for the cytosolic fraction, and PARP1 was used as a control for the soluble nuclear fraction. 2.5% of 4 million cells (100,000 cells represented on the gel) was loaded for the whole cell lysate, whereas 50% of the chromatin-enriched fraction of 4 million total cells (2 million cells represented on the gel) was loaded for the chromatin fractions. Each Western blot is from one representative experiment. The experiment was repeated at least twice in each cell line with similar results. b, Western blot for the GR in nontargeting shRNA (NT) and TBL1XR1 knockdown RS4;11 lines.
Furthermore, ChIP assays were performed in the RS4;11 (Fig. 7b) lines to determine the level of enrichment at various GRE regions of GILZ and TXNIP genes. We chose to examine these genes because we observed decreased levels of GILZ and TXNIP nascent RNA in the TBL1XR1 knockdown cell lines, and these genes have been shown to play a functional role in prednisolone induced apoptosis (37, 38). Consistent with chromatin fractionation results, TBL1XR1 was detected on all the GREs at baseline, which decreased markedly with prednisolone exposure in the control cells, whereas minimal levels of TBL1XR1 were associated with GRE in TBL1XR1 knockdown cells, which further decreased upon prednisolone exposure (Fig. 7b). In the control cells, we observed a low level of GR on all of the GREs at baseline, which was significantly enriched upon prednisolone treatment. In contrast, low to undetectable levels of GR were detected in TBL1XR1-depleted cells without prednisolone treatment, and no further recruitment of GR was observed upon prednisolone treatment in the TBL1XR1 knockdown cells (Fig. 7b). Likewise, an increased level of NCoR1 was found on all the GRE regions in the TBL1XR1 knockdown cells, which decreased with prednisolone exposure. However, unlike chromatin fractionation results that measured global levels of chromatin-associated HDAC3, we observed a similar trend in HDAC3 recruitment to GREs as NCoR1 recruitment in all conditions (Fig. 7b). Overall, these data suggest that under normal physiologic conditions, TBL1XR1 is essential for GR recruitment to GRE regions through its ability to regulate NCoR1 and HDAC3 levels at GRE regions. TBL1XR1 knockdown leads to increased levels of the NCoR1 and HDAC3 complex at GREs, thereby limiting GR binding to GREs and resulting in altered glucocorticoid signaling and resistance to GC agonists. Similar results were found in the Reh cell line (data not shown).
Inhibition of the NCoR Complex Restores Sensitivity to Prednisolone
Our data suggest that TBL1XR1 knockdown results in resistance to prednisolone by increasing the levels of NCoR1. To demonstrate that the prednisolone resistance obtained in the TBL1XR1 knockdown lines was NCoR1-dependent, we knocked down NCoR1 in the TBL1XR1 knockdown lines (Fig. 8, a and b). We then measured cell viability in these lines upon prednisolone treatment (Fig. 8c). As shown previously, knockdown of TBL1XR1 alone resulted in increased viability upon prednisolone treatment compared with control cells. However, this effect was abrogated upon reduction in NCoR1 (Fig. 8c). The knockdown of NCoR1 also restored the prednisolone-induced up-regulation of GILZ in the TBL1XR1-depleted cell lines (Fig. 8d). These data suggest that the prednisolone resistance obtained in the TBL1XR1 knockdown cells is specifically dependent on the increased levels of NCoR1.
FIGURE 8.

a, RT-PCR of TBL1XR1 and NCoR1 in nontargeting shRNA (NT), TBL1XR1 targeting shRNA, and TBL1XR1 and NCoR1 targeting shRNA Reh cells. b, Western blot for TBL1XR1 and NCoR1 in nontargeting shRNA (NT), TBL1XR1 targeting shRNA, TBL1XR1, and NCoR1 targeting shRNA Reh cells. c, the Reh cell lines were treated with prednisolone for 24 h, and cell viability was measured by Cell Titer Glo assay. d, RT-PCR of steady state mRNA levels of GILZ in the indicated cell lines. e, nontargeting and TBL1XR1 knockdown Reh cells were treated with indicated amounts of SAHA for 48 h, and cell viability was measured by Cell Titer Glo assay. f, nontargeting shRNA (NT) and TBL1XR1 targeting shRNA Reh cells were pretreated with 1 m SAHA for 24 h followed by a 24-h treatment with prednisolone. Cell viability was measured by Cell Titer Glo assay. g, cells were pretreated with 1 μm SAHA for 24 h and then treated with 350 μg/ml of prednisolone for 8 h. RT-PCR of steady state mRNA levels of GILZ in the indicated cell lines. Error bars represent standard deviations of three replicate experiments. *, significant change with a p value less or equal to 0.05. NS designates no significant change.
Given the potentially important role of HDACs in the NCoR complex-mediated GC signaling, we evaluated whether HDAC inhibition would restore drug sensitivity. Upon treatment with HDAC inhibitor SAHA alone, an equal loss in cell viability in the nontargeting and TBL1XR1 knockdown cell lines was observed (Fig. 8e), and as shown previously, TBL1XR1 knockdown cells were more viable upon prednisolone treatment (Fig. 8f). However, upon pretreatment with SAHA followed by prednisolone, there was equivalent loss of viability in controls versus TBL1XR1 knockdown cells (Fig. 8f). Furthermore, pretreatment with SAHA followed by prednisolone exposure restored the induction of GILZ to similar levels as control cells in the TBL1XR1 knockdown cell lines upon treatment with 350 μg/ml prednisolone (Fig. 8g). A lower concentration of prednisolone was used in this experiment to avoid high levels of cell death associated with treating SAHA-pretreated cells with higher doses of prednisolone. It is not surprising that treatment with SAHA leads to decreased cell viability because SAHA has previously been shown to be toxic to leukemic cells (30, 36); however, the restoration of GILZ induction in the TBL1XR1 knockdown cells does suggest that the impact of SAHA is mediated in part by the rescue of glucocorticoid signaling. These results are in agreement with the NCoR1 depletion studies showing the pivotal role of NCoR1 (and its associated HDACs) in mediating the GC resistance associated with loss of TBL1XR1.
DISCUSSION
Here we report a new mechanism for steroid resistance in ALL whereby lower levels of TBL1XR1 result in decreased GR association with chromatin and occupancy at GREs upon exposure to GCs. We observe a significant change in the GC-dependent gene expression signature in TBL1XR1 knockdown cells compared with the nontargeting lines. It is noteworthy that not all glucocorticoid-responsive genes appear to be impacted by TBL1XR1. Gene ontology analysis revealed that subsets of these genes are involved in apoptosis including GILZ and TXNIP which have previously been shown to lead to resistance to GC agonists in leukemia (37, 38). It is likely that even the partial reduction observed upon knockdown of TBL1XR1 is sufficient for prednisolone resistance in our cells. Upon TBL1XR1 depletion, GR is largely absent on bulk chromatin and specific gene regulatory sites of GILZ and TXNIP. Although we observed a significant reduction of prednisolone-induced gene expression some induction remained. The induction of BIM upon prednisolone exposure is not reduced by TBL1XR1 knockdown. Because BIM induction is important for prednisolone-induced apoptosis (35, 36), BIM induction may account for remaining levels of prednisolone-induced apoptosis observed in the TBL1XR1 knockdown lines.
TBL1XR1 is responsible for maintaining appropriate levels of the corepressor NCoR1 (11, 31), and decreased levels of TBL1XR1 result in a reciprocal increased level of NCoR1. TBL1XR1 has been linked to the activation of many transcription factors but has not been previously associated with the regulation of GR (11). Although NCoR1 has been shown to bind directly to GR when bound by antagonists, such as RU486, the effect of NCoR on GR-agonist dependent transcriptional activation has not been reported (21). We demonstrate that the loss of TBL1XR1 enhances NCoR1 and HADC3 recruitment to gene regulatory regions (e.g. GILZ and TXNIP), thereby altering chromatin accessibility and decreasing GR occupancy at its target genes. Interestingly, global levels of HDAC3 associated with chromatin was not altered by TBL1XR1 knockdown; however, we did observe altered levels of HDAC3 enriched on GRE regions of GILZ and TXNIP by ChIP. It is possible that the differential HDAC recruitment to GR target genes is responsible for the subset of genes differentially induced or repressed in the TBL1XR1 knockdown cell lines upon prednisolone stimulation. Importantly, pretreatment with an HDAC inhibitor re-established GILZ transcriptional expression by prednisolone and reinstated chemosensitivity to prednisolone in cells depleted of TBL1XR1. Previous studies have also shown that chemosensitivity can be enhanced by pretreatment with epigenetic modifiers, and a clinical trial of SAHA (clinical trial NCT01483690) and decitabine combination therapy together with a backbone of conventional therapy is underway to directly assess the therapeutic potential of this approach in relapsed ALL (30, 36).
Our observations coupled with previous studies indicate that defects in the transcriptional complex that mediates GC signaling may be common events in chemoresistance. Deletions and mutations in NR3C1, the glucocorticoid receptor, are rare, but deletions in BTG1, a coactivator of NR3C1, are observed in ∼10–14% of patients at relapse and are associated with GC resistance (6–8, 28, 39, 40). Evidence for the role of these genes in the development of relapse was described by Mullighan et al. (7) in a study showing that deletions in TBL1XR1, BTG1, and NR3C1 are selected for during the clonal evolution of ALL that results in relapsed disease. TBL1XR1 deletions are poor prognostic markers (9) and are enriched during the evolution of relapsed disease (7), indicating a role in GC resistance and eventual relapse.
BTG1 and TBL1XR1 deletions have been described only in B precursor ALL and not in T cell ALL, thus far (6, 8, 28, 41, 42). This suggests that distinct biological mechanisms may be utilized by the different cell types for acquiring steroid resistance. The number of patients harboring a deletion in TBL1XR1 is small (10% of relapsed ALL), which is consistent with many other genetic abnormalities characterized in relapsed ALL (6). The majority of deletions in TBL1XR1, BTG1, or NR3C1 were mutually exclusive in our patient cohort, with a total of 15 deletions characterized in 14 patients constituting 25% of the total relapse patient population (6). This suggests that at relapse many genetic lesions may alter the transcriptional complex responsible for glucocorticoid signaling, ultimately resulting in resistance to glucocorticoid agonists. Our TBL1XR1 knockdown experiments in an in vitro system demonstrate the functional significance of TBL1XR1 deletions observed in these large cohorts of relapse ALL patients.
Even though TBL1XR1 deletions at diagnosis are associated with an increased risk of relapse, we did not observe a correlation between ex vivo GC resistance and TBL1XR1 deletion in an independent cohort of 320 patients where 3 patients harbored a deletion in TBL1XR1 at diagnosis (data not shown). Given the small number of patients harboring a TBL1XR1 deletion in this independent cohort, it is difficult to access the statistical power of this data. These results are identical to those published previously related to BTG1 deletions (28). Thus, it is possible that acquisition of chemoresistance in primary samples is cell context-dependent and related to the acquisition of additional defects that result in relapse. Furthermore, TBL1XR1 deletions are enriched in the EVT6-RUNX1 subtype (8), which has a favorable prognosis that may contribute to the lack of resistance observed in newly diagnosed patients (43).
In summary, deletion of TBL1XR1 leads to the development of prednisolone resistance in ALL by decreasing the recruitment of GR to GREs through the up-regulation of the NCoR complex. Through our work and that of others, it has become apparent that resistance to glucocorticoids in childhood leukemia and potentially other hematological malignancies (44, 45) is largely mediated by alterations in components of transcription regulating complexes targeted to regulatory sites of GR responsive genes.
Acknowledgments
We thank Drs. Herbert Samuels and Lawrence Gardner for many helpful discussions, reagents, and critical review of this work. We also thank Dr. MaryAnn Perle for cytogenetic confirmation of Reh cells.
This work was supported, in whole or in part, by National Institutes of Health Grants R01 CA140729 and 2P30CA016087-33 (to W. L. C.), T32 GM066704 (to C. L. J.), F32 CA141762 (to S. W. P.), and R37 CA36401 (to W. E. E.). This work was also supported by funds from the Ira Sohn Conference Foundation (to T. B.) and St. Baldrick's Foundation (to D. S. B.).

This article contains supplemental Tables S1 and S2.
- ALL
- acute lymphoblastic leukemia
- GC
- glucocorticoid
- NCoR
- nuclear hormone repressor
- HDAC
- histone deacetylase
- GR
- glucocorticoid receptor
- GRE
- glucocorticoid response element
- SAHA
- suberoylanilidehydroxamic acid.
REFERENCES
- 1. Carroll W. L., Raetz E. A. (2012) Clinical and laboratory biology of childhood acute lymphoblastic leukemia. J. Pediat. 160, 10–18 [DOI] [PubMed] [Google Scholar]
- 2. Klumper E., Pieters R., Veerman A. J., Huismans D. R., Loonen A. H., Hählen K., Kaspers G. J., van Wering E. R., Hartmann R., Henze G. (1995) In vitro cellular drug resistance in children with relapsed/refractory acute lymphoblastic leukemia. Blood 86, 3861–3868 [PubMed] [Google Scholar]
- 3. Pieters R., den Boer M. L., Durian M., Janka G., Schmiegelow K., Kaspers G. J., van Wering E. R., Veerman A. J. (1998) Relation between age, immunophenotype and in vitro drug resistance in 395 children with acute lymphoblastic leukemia: implications for treatment of infants. Leukemia 12, 1344–1348 [DOI] [PubMed] [Google Scholar]
- 4. Schmiegelow K., Nyvold C., Seyfarth J., Pieters R., Rottier M. M., Knabe N., Ryder L. P., Madsen H. O., Svejgaard A., Kaspers G. J. (2001) Post-induction residual leukemia in childhood acute lymphoblastic leukemia quantified by PCR correlates with in vitro prednisolone resistance. Leukemia 15, 1066–1071 [DOI] [PubMed] [Google Scholar]
- 5. Tissing W. J., Meijerink J. P., den Boer M. L., Pieters R. (2003) Molecular determinants of glucocorticoid sensitivity and resistance in acute lymphoblastic leukemia. Leukemia 17, 17–25 [DOI] [PubMed] [Google Scholar]
- 6. Hogan L. E., Meyer J. A., Yang J., Wang J., Wong N., Yang W., Condos G., Hunger S. P., Raetz E., Saffery R., Relling M. V., Bhojwani D., Morrison D. J., Carroll W. L. (2011) Integrated genomic analysis of relapsed childhood acute lymphoblastic leukemia reveals therapeutic strategies. Blood 118, 5218–5226 [DOI] [PMC free article] [PubMed] [Google Scholar]
- 7. Mullighan C. G., Phillips L. A., Su X., Ma J., Miller C. B., Shurtleff S. A., Downing J. R. (2008) Genomic analysis of the clonal origins of relapsed acute lymphoblastic leukemia. Science 322, 1377–1380 [DOI] [PMC free article] [PubMed] [Google Scholar]
- 8. Mullighan C. G., Goorha S., Radtke I., Miller C. B., Coustan-Smith E., Dalton J. D., Girtman K., Mathew S., Ma J., Pounds S. B., Su X., Pui C.-H., Relling M. V., Evans W. E., Shurtleff S. A., Downing J. R. (2007) Genome-wide analysis of genetic alterations in acute lymphoblastic leukaemia. Nature 446, 758–764 [DOI] [PubMed] [Google Scholar]
- 9. Olsson L., Castor A., Behrendtz M., Biloglav A., Forestier E., Paulsson K., Johansson B. (2014) Deletions of IKZF1 and SPRED1 are associated with poor prognosis in a population-based series of pediatric B-cell precursor acute lymphoblastic leukemia diagnosed between 1992 and 2011. Leukemia 28, 302–310 [DOI] [PubMed] [Google Scholar]
- 10. Perissi V., Aggarwal A., Glass C. K., Rose D. W., Rosenfeld M. G. (2004) A corepressor/coactivator exchange complex required for transcriptional activation by nuclear receptors and other regulated transcription factors. Cell 116, 511–526 [DOI] [PubMed] [Google Scholar]
- 11. Perissi V., Scafoglio C., Zhang J., Ohgi K. A., Rose D. W., Glass C. K., Rosenfeld M. G. (2008) TBL1 and TBLR1 phosphorylation on regulated gene promoters overcomes dual CtBP and NCoR/SMRT transcriptional repression checkpoints. Mol. Cell 29, 755–766 [DOI] [PMC free article] [PubMed] [Google Scholar]
- 12. Choi H.-K., Choi K.-C., Yoo J.-Y., Song M., Ko S. J., Kim C. H., Ahn J.-H., Chun K.-H., Yook J. I., Yoon H.-G. (2011) Reversible SUMOylation of TBL1-TBLR1 regulates β-catenin-mediated Wnt signaling. Mol. Cell 43, 203–216 [DOI] [PubMed] [Google Scholar]
- 13. Ogawa S., Lozach J., Jepsen K., Sawka-Verhelle D., Perissi V., Sasik R., Rose D. W., Johnson R. S., Rosenfeld M. G., Glass C. K. (2004) A nuclear receptor corepressor transcriptional checkpoint controlling activator protein 1-dependent gene networks required for macrophage activation. Proc. Natl. Acad. Sci. U.S.A. 101, 14461–14466 [DOI] [PMC free article] [PubMed] [Google Scholar]
- 14. Ahmad K. F., Melnick A., Lax S., Bouchard D., Liu J., Kiang C.-L., Mayer S., Takahashi S., Licht J. D., Privé G. G. (2003) Mechanism of SMRT corepressor recruitment by the BCL6 BTB domain. Mol. Cell 12, 1551–1564 [DOI] [PubMed] [Google Scholar]
- 15. Mullighan C. G., Zhang J., Kasper L. H., Lerach S., Payne-Turner D., Phillips L. A., Heatley S. L., Holmfeldt L., Collins-Underwood J. R., Ma J., Buetow K. H., Pui C. H., Baker S. D., Brindle P. K., Downing J. R. (2011) CREBBP mutations in relapsed acute lymphoblastic leukaemia. Nature 471, 235–239 [DOI] [PMC free article] [PubMed] [Google Scholar]
- 16. Moreno D. A., Scrideli C. A., Cortez M. A., de Paula Queiroz R., Valera E. T., da Silva Silveira V., Yunes J. A., Brandalise S. R., Tone L. G. (2010) Differential expression of HDAC3, HDAC7 and HDAC9 is associated with prognosis and survival in childhood acute lymphoblastic leukaemia. Br. J. Haematol. 150, 665–673 [DOI] [PubMed] [Google Scholar]
- 17. Gruhn B., Naumann T., Gruner D., Walther M., Wittig S., Becker S., Beck J. F., Sonnemann J. (2013) The expression of histone deacetylase 4 is associated with prednisone poor-response in childhood acute lymphoblastic leukemia. Leuk. Res. 37, 1200–1207 [DOI] [PubMed] [Google Scholar]
- 18. Schlossmacher G., Stevens A., White A. (2011) Glucocorticoid receptor-mediated apoptosis: mechanisms of resistance in cancer cells. J. Endocrinol. 211, 17–25 [DOI] [PubMed] [Google Scholar]
- 19. Yamamoto K. R. (1985) Steroid receptor regulated transcription of specific genes and gene networks. Annu. Rev. Genet. 19, 209–252 [DOI] [PubMed] [Google Scholar]
- 20. Cadepond F., Schweizer-Groyer G., Segard-Maurel I., Jibard N., Hollenberg S. M., Giguère V., Evans R. M., Baulieu E. E. (1991) Heat shock protein 90 as a critical factor in maintaining glucocorticosteroid receptor in a nonfunctional state. J. Biol. Chem. 266, 5834–5841 [PubMed] [Google Scholar]
- 21. Ghisletti S., Huang W., Jepsen K., Benner C., Hardiman G., Rosenfeld M. G., Glass C. K. (2009) Cooperative NCoR/SMRT interactions establish a corepressor-based strategy for integration of inflammatory and anti-inflammatory signaling pathways. Genes Dev. 23, 681–693 [DOI] [PMC free article] [PubMed] [Google Scholar]
- 22. Zhang L. Q., Downie P. A., Goodell W. R., McCabe N. R., LeBeau M. M., Morgan R., Sklar J., Raimondi S. C., Miley D., Goldberg A. (1993) Establishment of cell lines from B-cell precursor acute lymphoblastic leukemia. Leukemia 7, 1865–1874 [PubMed] [Google Scholar]
- 23. John S., Johnson T. A., Sung M. H., Biddie S. C., Trump S., Koch-Paiz C. A., Davis S. R., Walker R., Meltzer P. S., Hager G. L. (2009) Kinetic complexity of the global response to glucocorticoid receptor action. Endocrinology 150, 1766–1774 [DOI] [PMC free article] [PubMed] [Google Scholar]
- 24. Deleted in proof.
- 25. Wysocka J., Reilly P. T., Herr W. (2001) Loss of HCF-1: chromatin association precedes temperature-induced growth arrest of tsBN67 cells. Mol. Cell. Biol. 21, 3820–3829 [DOI] [PMC free article] [PubMed] [Google Scholar]
- 26. Holleman A., Cheok M. H., den Boer M. L., Yang W., Veerman A. J., Kazemier K. M., Pei D., Cheng C., Pui C. H., Relling M. V., Janka-Schaub G. E., Pieters R., Evans W. E. (2004) Gene-expression patterns in drug-resistant acute lymphoblastic leukemia cells and response to treatment. New Engl. J. Med. 351, 533–542 [DOI] [PubMed] [Google Scholar]
- 27. Dandekar S. C., Faye Pais E. R., Bhatla T., Jones C. L., Bourgeois W., Hunger S. P., Raetz E. A., Hermiston M. L., Dasgupta R., Morrison D. J., Carroll W. L. (2013) Inhibition of the Wnt pathway leads to improved chemosensitivity in pediatric acute lymphoblastic leukemia. Blood [DOI] [PMC free article] [PubMed] [Google Scholar]
- 28. van Galen J. C., Kuiper R. P., van Emst L., Levers M., Tijchon E., Scheijen B., Waanders E., van Reijmersdal S. V., Gilissen C., van Kessel A. G., Hoogerbrugge P. M., van Leeuwen F. N. (2010) BTG1 regulates glucocorticoid receptor autoinduction in acute lymphoblastic leukemia. Blood 115, 4810–4819 [DOI] [PubMed] [Google Scholar]
- 29. Bachmann P. S., Gorman R., Papa R. A., Bardell J. E., Ford J., Kees U. R., Marshall G. M., Lock R. B. (2007) Divergent mechanisms of glucocorticoid resistance in experimental models of pediatric acute lymphoblastic leukemia. Cancer Res. 67, 4482–4490 [DOI] [PubMed] [Google Scholar]
- 30. Bhatla T., Wang J., Morrison D. J., Raetz E. A., Burke M. J., Brown P., Carroll W. L. (2012) Epigenetic reprogramming reverses the relapse-specific gene expression signature and restores chemosensitivity in childhood B-lymphoblastic leukemia. Blood 119, 5201–5210 [DOI] [PMC free article] [PubMed] [Google Scholar]
- 31. Zhang X. M., Chang Q., Zeng L., Gu J., Brown S., Basch R. S. (2006) TBLR1 regulates the expression of nuclear hormone receptor co-repressors. BMC Cell Biol. 7, 31. [DOI] [PMC free article] [PubMed] [Google Scholar]
- 32. Tissing W. J., den Boer M. L., Meijerink J. P., Menezes R. X., Swagemakers S., van der Spek P. J., Sallan S. E., Armstrong S. A., Pieters R. (2007) Genomewide identification of prednisolone-responsive genes in acute lymphoblastic leukemia cells. Blood 109, 3929–3935 [DOI] [PubMed] [Google Scholar]
- 33. Shikama N., Lee C. W., France S., Delavaine L., Lyon J., Krstic-Demonacos M., La Thangue N. B. (1999) A novel cofactor for p300 that regulates the p53 response. Mol. Cell 4, 365–376 [DOI] [PubMed] [Google Scholar]
- 34. Greenstein S., Ghias K., Krett N. L., Rosen S. T. (2002) Mechanisms of glucocorticoid-mediated apoptosis in hematological malignancies. Clin. Cancer Res. 8, 1681–1694 [PubMed] [Google Scholar]
- 35. Zhao Y. N., Guo X., Ma Z. G., Gu L., Ge J., Li Q. (2011) Pro-apoptotic protein BIM in apoptosis of glucocorticoid-sensitive and -resistant acute lymphoblastic leukemia CEM cells. Med. Oncol. 28, 1609–1617 [DOI] [PubMed] [Google Scholar]
- 36. Bachmann P. S., Piazza R. G., Janes M. E., Wong N. C., Davies C., Mogavero A., Bhadri V. A., Szymanska B., Geninson G., Magistroni V., Cazzaniga G., Biondi A., Miranda-Saavedra D., Göttgens B., Saffery R., Craig J. M., Marshall G. M., Gambacorti-Passerini C., Pimanda J. E., Lock R. B. (2010) Epigenetic silencing of BIM in glucocorticoid poor-responsive pediatric acute lymphoblastic leukemia, and its reversal by histone deacetylase inhibition. Blood 116, 3013–3022 [DOI] [PubMed] [Google Scholar]
- 37. Asselin-Labat M. L., David M., Biola-Vidamment A., Lecoeuche D., Zennaro M. C., Bertoglio J., Pallardy M. (2004) GILZ, a new target for the transcription factor FoxO3, protects T lymphocytes from interleukin-2 withdrawal-induced apoptosis. Blood 104, 215–223 [DOI] [PubMed] [Google Scholar]
- 38. Wang Z., Rong Y. P., Malone M. H., Davis M. C., Zhong F., Distelhorst C. W. (2006) Thioredoxin-interacting protein (txnip) is a glucocorticoid-regulated primary response gene involved in mediating glucocorticoid-induced apoptosis. Oncogene 25, 1903–1913 [DOI] [PubMed] [Google Scholar]
- 39. Kaspers G. J., Pieters R., Klumper E., De Waal F. C., Veerman A. J. (1994) Glucocorticoid resistance in childhood leukemia. Leuk. Lymphoma 13, 187–201 [DOI] [PubMed] [Google Scholar]
- 40. Beesley A. H., Weller R. E., Senanayake S., Welch M., Kees U. R. (2009) Receptor mutation is not a common mechanism of naturally occurring glucocorticoid resistance in leukaemia cell lines. Leuk. Res. 33, 321–325 [DOI] [PubMed] [Google Scholar]
- 41. Waanders E., Scheijen B., van der Meer L. T., van Reijmersdal S. V., van Emst L., Kroeze Y., Sonneveld E., Hoogerbrugge P. M., van Kessel A. G., van Leeuwen F. N., Kuiper R. P. (2012) The origin and nature of tightly clustered BTG1 deletions in precursor B-cell acute lymphoblastic leukemia support a model of multiclonal evolution. PLoS Genet. 8, e1002533. [DOI] [PMC free article] [PubMed] [Google Scholar]
- 42. Tijchon E., Havinga J., van Leeuwen F. N., Scheijen B. (2013) B-lineage transcription factors and cooperating gene lesions required for leukemia development. Leukemia 27, 541–552 [DOI] [PubMed] [Google Scholar]
- 43. Schultz K. R., Pullen D. J., Sather H. N., Shuster J. J., Devidas M., Borowitz M. J., Carroll A. J., Heerema N. A., Rubnitz J. E., Loh M. L., Raetz E. A., Winick N. J., Hunger S. P., Carroll W. L., Gaynon P. S., Camitta B. M. (2007) Risk- and response-based classification of childhood B-precursor acute lymphoblastic leukemia: a combined analysis of prognostic markers from the Pediatric Oncology Group (POG) and Children's Cancer Group (CCG). Blood 109, 926–935 [DOI] [PMC free article] [PubMed] [Google Scholar]
- 44. Gonzalez-Aguilar A., Idbaih A., Boisselier B., Habbita N., Rossetto M., Laurenge A., Bruno A., Jouvet A., Polivka M., Adam C., Figarella-Branger D., Miquel C., Vital A., Ghesquières H., Gressin R., Delwail V., Taillandier L., Chinot O., Soubeyran P., Gyan E., Choquet S., Houillier C., Soussain C., Tanguy M.-L., Marie Y., Mokhtari K., Hoang-Xuan K. (2012) Recurrent mutations of MYD88 and TBL1XR1 in primary central nervous system lymphomas. Clin. Cancer Res. 18, 5203–5211 [DOI] [PubMed] [Google Scholar]
- 45. Pasqualucci L., Trifonov V., Fabbri G., Ma J., Rossi D., Chiarenza A., Wells V. A., Grunn A., Messina M., Elliot O., Chan J., Bhagat G., Chadburn A., Gaidano G., Mullighan C. G., Rabadan R., Dalla-Favera R. (2011) Analysis of the coding genome of diffuse large B-cell lymphoma. Nat. Genet. 43, 830–837 [DOI] [PMC free article] [PubMed] [Google Scholar]