

Background: RPE cells derive fatty acids from phagocytized photoreceptor outer segments.
Results: RPE cells metabolize palmitate to produce β-hydroxybutyrate (β-HB), a ketone body the retina can use as a metabolic substrate.
Conclusion: RPE cells produce β-HB as a potential substrate for photoreceptor cells in the outer retina.
Significance: This is a novel form of RPE-retina interaction that may be important for retinal cell health and function.
Keywords: β-Hydroxybutyrate Dehydrogenase, Fatty Acid Metabolism, Fatty Acid Oxidation, Retinal Metabolism, Transporter, MCT7, Pigment Epithelium
Abstract
Every day, shortly after light onset, photoreceptor cells shed approximately a tenth of their outer segment. The adjacent retinal pigment epithelial (RPE) cells phagocytize and digest shed photoreceptor outer segment, which provides a rich source of fatty acids that could be utilized as an energy substrate. From a microarray analysis, we found that RPE cells express particularly high levels of the mitochondrial HMG-CoA synthase 2 (Hmgcs2) compared with all other tissues (except the liver and colon), leading to the hypothesis that RPE cells, like hepatocytes, can produce β-hydroxybutyrate (β-HB) from fatty acids. Using primary human fetal RPE (hfRPE) cells cultured on Transwell filters with separate apical and basal chambers, we demonstrate that hfRPE cells can metabolize palmitate, a saturated fatty acid that constitutes ≈15% of all lipids in the photoreceptor outer segment, to produce β-HB. Importantly, we found that hfRPE cells preferentially release β-HB into the apical chamber and that this process is mediated primarily by monocarboxylate transporter isoform 1 (MCT1). Using a GC-MS analysis of 13C-labeled metabolites, we showed that retinal cells can take up and metabolize 13C-labeled β-HB into various TCA cycle intermediates and amino acids. Collectively, our data support a novel mechanism of RPE-retina metabolic coupling in which RPE cells metabolize fatty acids to produce β-HB, which is transported to the retina for use as a metabolic substrate.
Introduction
In the outer retina, the retinal pigment epithelial (RPE)3 and photoreceptor cells are linked physically and metabolically, and this symbiotic relationship supports normal visual function. Every day, photoreceptor cells shed ∼10% of their outer segment (OS), which is phagocytized by the underlying RPE (1). This shed photoreceptor OS (POS) is highly enriched in saturated (14:0, 16:0, and 18:0) and unsaturated fatty acids (18:1, 18:2, 18:3, 20:4, and 22:6) (2). Early radioactive tracer studies revealed that frog RPE incorporates docosahexaenoic and arachidonic acids from the POS into triglycerides and phospholipids (3, 4). Studies with cultured porcine RPE also demonstrated that the RPE can metabolize saturated fatty acids via β-oxidation (5).
Although the RPE can metabolize fatty acids to produce ATP, it has not been known whether, like the liver, they can use fatty acids to produce ketones. Analysis of the publicly available mouse microarray data (GSE10246, Ref. 6) revealed that mouse RPE expresses particularly high levels of mitochondrial HMG-CoA synthase 2 (Hmgcs2), the key enzyme required for ketone production (7). Hmgcs2 mRNA is also abundant in two other tissues, liver and colon, both of which are known sites of ketogenesis (8). Because overexpression of Hmgcs2 alone can induce fatty acid β-oxidation and ketogenesis in a cell line that normally lacks these activities (9), the high expression of Hmgcs2 in the RPE suggests that it can produce ketones.
In fasted animals, fatty acids taken up by the liver are catabolized via β-oxidation to generate acetyl-CoA. Although acetyl-CoA readily enters the TCA cycle, a fraction is shunted into the ketogenic pathway, which consists of a series of four reactions that ultimately produce β-hydroxybutyrate (β-HB) (8). In the liver, the rate of β-HB production is dependent on the activity and expression of Hmgcs2. The Hmgcs2 promoter contains several regulatory elements: cAMP response element, nuclear receptor response element (interacts with peroxisome proliferator-activated receptors (PPARs) and retinoid X receptor), and GC box (interacts with the zinc finger protein binding site) (8). During starvation, an influx of fatty acids into the liver induces activation of PPAR (10), which, in turn, promotes ketogenesis through the up-regulation of Hmgcs2 expression; of genes involved in fatty acid transport, including acyl-CoA synthetase and fatty acid-binding protein; of genes involved in fatty acid metabolism peroxisomal acyl-coenzyme A oxidase and acyl-CoA dehydrogenase; and of genes involved in carnitine transport (carnitine palmitoyltransferase and organic cation/carnitine transporter (OCTN2, encoded by SLC22A5)). The RPE expresses all three isoforms of PPARs (α, δ, and γ), and PPAR-γ expression was induced in RPE by phagocytosis of POS (11). These findings suggest that an influx of fatty acids into the RPE from POS phagocytosis can act as a signal for PPAR-mediated activation of fatty acid metabolism.
β-HB produced in the liver is transported out of the hepatocytes into the bloodstream. The transporter for β-HB was identified recently in the zebrafish model to be monocarboxylate transporter isoform 7 (MCT7, encoded by Slc16a6) (12). MCT7 expression in the RPE and retina has not been reported, but a search of microarray data published recently of individual mouse retina cell types (from the work of Siegert et al. (13)) revealed that MCT7 is expressed in photoreceptor cells, suggesting that photoreceptor cells can take up and metabolize β-HB. Consistent with this notion, Northern blot analysis showed that MCT7 (previously known as MCT6) transcript is particularly enriched in the brain (14), where the role of ketones as energy substrates is well established. In addition to MCT7, Halestrap and Meredith (15) demonstrated that MCT1 can transport β-HB, albeit at a relatively high Km of 10–12 mm. The Km of β-HB transport by MCT7 is unknown. In the eye, MCT1 is enriched in the apical processes of RPE and in the inner segment of photoreceptor cells (16). However, the role of MCT1 and MCT7 in β-HB transport in the RPE and retina remains to be determined.
In this study, we examined whether the RPE produces β-HB through β-oxidation of fatty acids and whether the ketones produced can be taken up and metabolized by photoreceptor cells. By using a cultured human fetal RPE (hfRPE) model system, we showed that RPE cells can metabolize fatty acids to produce β-HB, which was released preferentially into the apical compartment. Our data support a model of metabolic coupling in which RPE cells metabolize fatty acids derived from shed POS to produce β-HB, which is subsequently transported to the retina to be used as a substrate for oxidative metabolism.
EXPERIMENTAL PROCEDURES
hfRPE Culture Model
Fetal human eyes were obtained from Advanced Bioscience Resources (Alameda, CA) from random donors between 18–22 weeks of gestation. The eyes were delivered overnight, and tissues were dissected less than 26 h after enucleation. The use of hfRPE cells in this work conforms to the guidelines set by the National Institutes of Health institutional review board. hfRPE monolayers were cultured on T25 flasks (passage 0) as described previously (17). T25 flasks of confluent hfRPE cells were provided by Drs. Sheldon Miller and Arvydas Maminishkis. Briefly, hfRPE cells were trypsinized from a T25 flask and seeded onto 12-well Transwells at ≈1.25 × 10⁵ cells/well (passage 1). Passage 1 hfRPE cells were cultured for 3–4 weeks to reach maturity (transepithelial resistance > 500 Ω·cm2) prior to experimentation. Transepithelial resistance was measured with an epithelial Volt-Ohm meter (WPI, Sarasota, FL) at room temperature.
Animals
All procedures used in preparation for all experiments involving mice were performed according to the guidelines set forth by the Institutional Animal Care and Use Committee at Thomas Jefferson University. All mice used in this study were of the C57BL/6NTac line from Taconic.
Western Blot Analysis
Mouse tissue samples were isolated and subsequently homogenized in lysis buffer (Triton-X (1%), HEPES (25 mm, pH 7.4), NaCl (150 mm), MgCl2 (5 mm), n-octyl-β-d-glucoside (60 mm), and 1× proteinase inhibitor mixture (Sigma, catalog no. P8340)). hfRPE cells on Transwell filters were lysed and homogenized using the same procedure (18). 10 μg of total protein lysates was loaded onto a NuPAGE® 4–12% Tris acetate gel (Invitrogen) for electrophoresis. Proteins were subsequently transferred onto PVDF membranes using an XCell IITM blot module (Invitrogen). Nonspecific binding sites were blocked with TBS (+ 0.1% Tween 20) containing 5% w/v BSA. Hmgcs2 antibody (catalog no. ab137043) was purchased from Abcam (Cambridge, MA).
Papain Dissociation of Single Retinal Cells from Mouse Retina
The mouse was sacrificed, and its retina was isolated in ice-cold PBS. Next, the retina was dissociated into single retinal cells using a papain dissociation system (Worthington Biochemical Corp., catalog no. LK003150) according to the protocol of the manufacturer. Briefly, the retina was incubated in a 1.5-ml centrifuge tube containing 1 ml of papain solution (containing 950 μl of papain and 50 μl of DNase) for 1 h at 37 °C. Next, albumin-ovomucoid inhibitor solution (10×) and DNase were added to the retina to stop the reaction. A wide-bore flamed tip Pasteur pipette (without applying any pressure, the pipette leaks water at a rate of ∼1 drop/s) was used to gently triturate the retina three times.
Magnetic Bead-mediated Purification of CD73+ Rod Photoreceptor Cells
Dynabead protein G (0.75 mg, catalog no. 10003D, Invitrogen) was washed with PBS with Tween 20 (0.02%) and subsequently incubated with 1 μg of rat anti-mouse CD73 antibody (clone TY/23, catalog no. 550738, BD Biosciences) in rotation overnight at 4 °C. The next day, the Dynabead protein G conjugated with CD73 antibody was washed with PBS, and the Dynabeads-CD73Ab complex was added to 1 ml of the triturated retinal cell suspension. The mixture was incubated at room temperature with rotation for 30 min to allow the Dynabeads-CD73Ab complex to bind cells. Unbound cells were removed, and the Dynabead-CD73Ab-cell complex was washed with PBS three times before TRIzol was added to extract RNA. RNA was also isolated from unbound cells using TRIzol.
Reverse Transcription and Real-time PCR (qPCR)
RNA (0.5 μg/sample) was reverse-transcribed using random hexamers, oligo(dT)20 primers, and SuperScript III (Invitrogen). qPCR reactions were performed using Power SYBR Green Supermix (Invitrogen) in 20-μl reactions (5 ng cDNA/RxN). qPCR was performed using an ABI Prism 7000 sequence detection system. Primer sequences were obtained from a publicly available database (19). Custom oligos were purchased from Eurofins MGW Operon (Huntsville, AL). Data are presented as Δ-Ct relative to an endogenous control, Rplp1, and as a heat map generated in MultiExperiment Viewer version 4.8.1. Yellow represents high expression (small Δ-Ct), and blue represents low expression (large Δ-Ct).
Microarray Analysis
The GSE10246 raw microarray dataset (GNF Mouse GeneAtlas V3, Affymetrix Mouse Genome 430 2.0 array, Ref. 6) was downloaded from NCBI GEO. Each probe ID (ID_REF) in the dataset was matched with the most recent annotation file, GPL1261-14790, which is available from the Affymetrix web site. The median fluorescence value of all probes for each gene was determined, and these values were converted to the Log2 scale. Each tissue sample in the microarray was in duplicates, and the average of the Log2 (median fluorescence values) of each tissue duplicates was used for generating the heat map. The heat map was generated in MultiExperiment Viewer version 4.8.1. Yellow represents high expression (high Log2(intensity)) and blue represents low expression (low Log2(intensity)). Single photoreceptor and Müller cell microarray data by Roesch et al. (20) was downloaded from the journal web site. First, the annotation and gene names for the probe set were updated using a more recent annotation file downloaded from the Affymetrix web site (Mouse430 Annotations, Release 32, June 9, 2011). Next, the gene expression data were normalized to the average fraction of Rplp10, Rps12, Rps24, Rpl4, and Rps4x across all samples. The normalized values were converted to the Log2 scale and used in the graph. Genes with Log2 intensity values below 5 (equivalent to intensity of 32) were considered absent. For analysis of retinal gene expression data by Siegert et al. (13), the normalized microarray data were downloaded from the web site. Of the photoreceptor samples (b2.1st, b2.2nd, b2.single, Chmb4, and d4), b2.1st, b2.2nd, and b2.single were rods (expressing rhodopsin but not opsins), and Chmb4 and d4 were cones (expressing opsins but not rhodopsin). Lhx4 of the bipolar cell samples was excluded because Lhx4 is also expressed in photoreceptor cells. Similarly, only Rgs5- and Fbxo32-positive amacrine cell samples and parvalbumin (PV)-, Drd4-, Grik4-, and Opn4-positive ganglion cell samples were used because they were not expressed in any other retinal cell types. As indicated by Siegert et al. (13), the threshold for expression was 20.
Ringer's Solution and Metabolic Substrate Preparation
The recipe for hfRPE Ringer's solution is on the basis of the hfRPE cell culture medium (NaCl (116.5 mm), NaHCO3 (26.2 mm), KCl (5 mm), MgCl2 (0.5 mm), CaCl2 (1.8 mm), l-carnitine (1 mm), and HEPES-N-methyl-d-glucamine (12 mm HEPES dissolved in deionized H2O in a separate beaker and titrated to pH 7.4 with a base, N-methyl-d-glucamine)). The Ringer's solution for Seahorse experiments contains 26.2 mm sodium gluconate and no NaHCO3. The solution was not equilibrated with CO2. For experiments with mouse RPE and retina, we used Krebs/HCO3-Ringer's solution (NaCl (98.5 mm), NaHCO3 (25.9 mm), KCl (4.9 mm), KH2PO4 (1.2 mm), MgSO4·7H2O (1.2 mm), CaCl2 (2.6 mm), l-carnitine (1 mm), and HEPES-N-methyl-d-glucamine (20 mm HEPES dissolved in DI H2O in a separate beaker and titrated to pH 7.4 with N-methyl-d-glucamine)). Glucose or other substrates were excluded from the Ringer's solution and added prior to the experiment. Before sterile filtration, Ringer's solution was equilibrated by gassing the solution with 5% CO2 (balance air). When fully equilibrated with 5% CO2, the final pH of the Ringer's solution was 7.4, and the osmolalities of the hfRPE Ringer's solution and Krebs/HCO3 Ringer's solution (after addition of 5 mm glucose) were 305 mosmol/kg and 300 mosmol/kg, respectively. To prepare BSA-conjugated palmitate, we first prepared a 200 mm sodium palmitate stock by dissolving sodium palmitate powder in 50% methanol (balance H2O) and incubated it at 70 °C for 5 min. Sodium palmitate stock was then diluted 100-fold in a 150 mm NaCl solution containing 2% BSA. The mixture was incubated at 37 °C for 1 h to achieve BSA-palmitate conjugation. The 2 mm palmitate-conjugate working solution was stored at −20 °C until the day of the experiment. The BSA vehicle control was prepared by diluting 50% methanol 100-fold in 150 mm NaCl + 2% BSA solution. On the day of the experiment, the 2 mm palmitate-conjugate stock was added to Ringer's solution at a 1:10-fold dilution to achieve a palmitate concentration of 200 μm. For GC-MS analyses of fatty acid metabolism, [1-13C1]sodium palmitate (catalog no. CLM-174-1) was purchased from Cambridge Isotope Laboratories (Tewksbury, MA).
Measurement of RPE Oxidative Metabolism Using a Seahorse XF24 Bioanalyzer
hfRPE cells were seeded in a XF24 cell culture microplate at 80,000 cells/well and cultured over 10 days in complete hfRPE medium. On the day of the experiment, hfRPE cells were switched to CO2/HCO3-free HEPES-buffered Ringer's solution containing 5 mm glucose. The plate was immediately transferred to the Seahorse XF24 analyzer, and baseline oxygen consumption rates (OCRs) were obtained. Next, Ringer's solution containing BSA-vehicle or BSA-palmitate was injected into each well, and subsequent changes in OCR were recorded.
Measurement of β-HB and Total Ketone Production and Release
hfRPE Ringer's solution containing substrates was added to the apical or basal chambers of hfRPE cells on Transwell filters. Ringer's solution (70 μl) was collected from apical and basal chambers at the 2- and 3-h time points. For mouse RPE explants, the mouse was sacrificed, RPE choroid was microdissected from each eye, and transferred to a Krebs/HCO3 Ringer's solution (at 37 °C and 5% CO2) containing no substrate or glucose and palmitate (200 μm) in each well in a 96-well plate (80 μl/well). β-HB was measured using a β-hydroxybutyrate LiquiColor reagent kit (StanBio, Boerne, TX, catalog no. 2440-058). In this assay, reagent A and reagent B were mixed in a 6:1 ratio, and 200 μl of the mixture was added to 25 μl of samples (or β-HB standards) in each well. The assay plate was incubated at 37 °C for 10 min before absorbance at 505 nm was measured. The limit of detection for the assay was obtained by taking the mean of the blank samples plus 2× standard deviation of the blank samples, giving a confidence level of 95%. For the β-HB assay, the limit of detection was 43 pmol, which is equivalent to 1.7 μm in 25 μl. Total ketone (acetoacetate plus β-HB) was measured using an Autokit total ketone body assay (Wako Life Sciences Inc., Richmond, VA, catalog nos. 415-73301 and 411-73401). In this assay, reagent 1 and reagent 2 were mixed in a 1:3 ratio, and 200 μl of the mixture was added to 30 μl of the samples (or β-HB standards) in each well. Immediately, absorbances at 404 and 650 nm (reference) were measured at 5-min intervals over four time points. The rate of increase (404–650 nm) in absorbance was used for measuring total ketone production. The limit of detection for this assay was 5 pmol (equivalent to 0.17 μm in a 30-μl volume). Data were presented as absolute amount (nanomoles) of β-HB or ketones released by 1 cm2 of hfRPE monolayer into the apical or basal chambers after taking into account the differences in apical versus basal chamber volumes: 500 and 1500 μl respectively. In both assays, Ringer's solution containing no substrate, glucose (5 mm), palmitate (200 μm), or glucose and palmitate (200 μm) all gave blank readouts. We also verified that both assays did not detect other substrates that were present in the hfRPE supernatant, including glucose, lactate, and pyruvate.
Measurement of Transepithelial Lactate and Ketone Transport
hfRPE on Transwells were transferred to a new 12-well plate and washed with glucose-free hfRPE Ringer's solution (apical and basal chambers) once. Next, the apical chamber was replaced with Ringer's solution containing either dimethyl sulfoxide, AR-C155858 (10 μm, a specific MCT1 inhibitor (21)), α-cyano-4-hydroxycinnamate (α-CHC, 5 mm, another MCT1 inhibitor (22)), or both AR-C155858 (10 μm) and α-CHC (5 mm) and incubated at 37 °C and 5% CO2 for 15 min. In a separate 12-well plate, 1.5 ml of glucose-free Ringer's solution was added to each well and preincubated at 37 °C and 5% CO2 for 15 min. Ringer's solution in the basal chamber was removed, and the apical chambers of each Transwell were replaced with glucose-free Ringer's solution containing 5 mm lactate with or without AR-C155858 and α-CHC. Next, each Transwell was transferred to the 12-well plate containing 1.5 ml glucose-free medium. Ringer's solution at the basal chamber was collected at the 30- and 60-min time points for evaluation of lactate concentration using a commercially available assay kit (Trinity Biotech, catalog no. 735-10). Glucose was excluded from the Ringer's solution because the RPE rapidly produces lactate from glucose. After the experiment, the transepithelial resistance of the hfRPE remained above 300 Ω·cm2, indicating that the hfRPE barrier was intact. For β-HB transport experiments, glucose was included in the Ringer's solution. First, hfRPE on Transwells was washed with Ringer's solution (apical and basal chambers) once. Next, the apical chamber was replaced with Ringer's solution containing either dimethyl sulfoxide or AR-C155858 and incubated for 15 min at 37 °C and 5% CO2. Next, each Transwell was transferred to a new 12-well plate with 1.5 ml of Ringer's solution (basal chamber) containing 5 mm β-HB or 0 mm (blank control), and Ringer's solution in the apical chamber was collected at the 15- and 30-min time points for β-HB analysis using a StanBio assay kit. AR-C155858 is colorless and does not interfere with the β-HB assay.
GC-MS Analysis of Metabolites
A mouse was sacrificed, and the retinas were isolated in ice-cold Krebs/HCO3 Ringer's solution containing unlabeled glucose. Each retina was cut into three pieces, transferred to fresh Ringer's solution preincubated at 37 °C and 5% CO2, and placed immediately into Krebs/HCO3 Ringer's solution containing 2,4-13C2 β-HB (5 mm) and unlabeled glucose (5 mm). After incubation (15, 30, or 60 min), the retina pieces were transferred to ice-cold 0.9% NaCl solution (using a transfer pipette) for 10 s, picked up with clean forceps, placed directly into a 1.5-ml centrifuge tube, and frozen immediately in dry ice. Samples were stored at −80 °C until processing. The procedure for processing the retina or RPE supernatants for GC-MS analysis has been established previously (23, 24). An Agilent 7890/5975C GC/MS system (Agilent Technologies, Santa Clara, CA) with an Agilent HP-5MS column (30 m × 0.25 mm × 0.25 μm film) column was used for GC separation and analysis of metabolites, and the settings for this system have been published previously (23, 24). Labeled metabolite data were presented as relative ion abundances or as percent 13C-labeled metabolites, which was calculated by dividing the labeled ions with total ion intensity. Calibration of β-HB was performed using various concentrations of 2,4-13C2 β-HB. For mass isotopomer analysis, single-labeled metabolites were presented as M1, double-labeled metabolites were presented as M2, and so forth. The labels are irrespective of carbon position. The measured distribution of mass isotopomers was corrected for natural abundance using defined intensities from known standards after each experiment. The natural abundance of the tracers and derivatization reagents was corrected using IsoCor software. [U-13C]sodium lactate (catalog no. 485926) and 2,4-13C2 β-HB (catalog no. 674117) were purchased from Sigma-Aldrich (St. Louis, MO).
RESULTS
The RPE Expresses Key Enzymes in Ketogenesis
The RPE plays an essential role in outer segment renewal by phagocytosis and digestion of shed outer segment tips. This process provides the RPE with a source of lipids that may be metabolized via β-oxidation to generate acetyl CoA. To determine whether cultured hfRPE cells are capable of metabolizing fatty acids, we seeded hfRPE cells on Seahorse XF24 microplates at high density and cultured them over 10 days to achieve differentiation, as indicated by the formation of fluid-filled domes. For the Seahorse experiments, hfRPE cells were first incubated in HEPES-buffered, CO2/HCO3-free Ringer's solution containing carnitine (2 mm) and glucose (5 mm), and the first four measurements of the OCR were obtained. Next, BSA-conjugated palmitate was added to each well at various concentrations (0, 100, 200, and 400 μm), and the OCR was measured. As shown in Fig. 1, the OCR was increased by 30% in hfRPRE incubated with 200 and 400 μm palmitate, whereas hfRPE cells given BSA vehicle control showed a decrease in OCR by ≈10%. Two-way analysis of variance using Dunnett's multiple comparisons test showed that the palmitate-induced increase in OCR was statistically significant. These palmitate-induced changes in OCR were not observed in the absence of carnitine, an important cofactor for fatty acid metabolism (data not shown).
FIGURE 1.
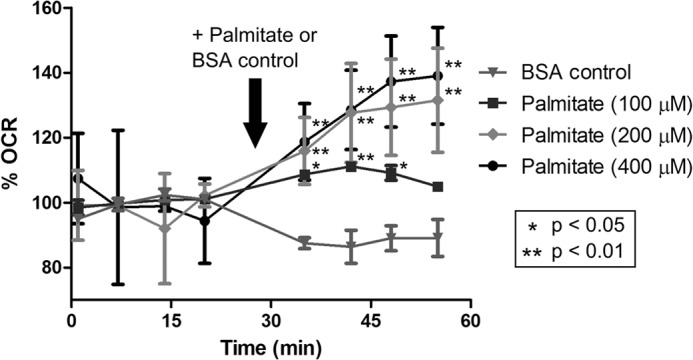
hfRPE cells metabolize palmitate as an oxidative substrate. hfRPE cells were incubated in CO2/HCO3-free Ringer's solution containing carnitine (2 mm) and glucose (5 mm), and the OCR was measured at 6.5-min intervals to obtain baseline readings. Next, BSA-conjugated palmitate at various concentrations (n = 3 each) was added to each well, and the OCR was measured over the next four time points. OCR values were normalized to the median values of the baseline readings (set to 100%) for each sample.
Although RPE cells can metabolize lipids as a source of ATP, it is not known whether they can oxidize lipids to produce ketones, a well established product of lipid metabolism in the liver. Ketone (acetoacetate and β-HB) production occurs in the mitochondria when acetyl-CoA generated from lipid β-oxidation is shunted to the HMG-CoA pathway (Fig. 2A). To explore the ketogenic potential of RPE cells, we analyzed a publicly available microarray dataset (GSE10246, Ref. 6) to compare gene expression of key enzymes in ketogenesis (i.e. acetyl-CoA acetyltransferase 1 (Acat), Hmgcs2, HMG-CoA lyase (Hmgcl), β-HB dehydrogenase (Bdh), and 3-oxoacid-CoA transferase (Oxct)) in mouse RPE compared with other tissues (i.e. retina, brain, heart, intestine, kidney, liver, muscle, and testis). Our analysis revealed that the rate-limiting enzyme in the HMG-CoA pathway, the mitochondrial HMG-CoA synthase (Hmgcs2), was exclusively and highly expressed in the RPE, liver, and colon with high Log2 intensities of 10.3, 14.1, and 12.3, respectively (Fig. 2B). Hmgcs2 expression of all other tissues in the array was low, with Log2 intensities ranging from 3–6. To verify these microarray data, we performed qRT-PCR (Fig. 2C) and Western blot (Fig. 2D) analyses to compare Hmgcs2 mRNA and protein expression in the mouse RPE to various other tissues. Consistent with the microarray data, we found that only the RPE and liver express Hmgcs2 protein.
FIGURE 2.

The RPE expresses Hmgcs2, the key enzyme for ketogenesis. A, acetyl-CoA derived from β-oxidation of fatty acids can be shunted into the HMG-CoA pathway, which is regulated by Hmgcs2 activity. ACAT, acetyl-CoA acetyltransferase; BDH, 3-hydroxybutyrate dehydrogenase; HMGL, HMG-CoA lyase; OXCT, 3-oxoacid-CoA transferase. B, GSE10246 microarray (6) analysis for all enzymes in ketogenesis in mouse RPE versus other tissues. Aacs, acetoacetyl-CoA synthetase. Also shown are qRT-PCR (C) and Western blot (D) analyses for Hmgcs2 expression in mouse RPE versus other tissues.
The high level of expression of Hmgcs2 in the RPE suggests that the RPE, like the liver, is capable of producing ketones. To test whether RPE cells can indeed produce ketones, we turned to a primary hfRPE culture model established by Miller and co-workers (17). In this system, hfRPE cells establish a polarized monolayer on Transwell filters and release macromolecules into separate apical and basolateral compartments. Thus, ketone production and their subsequent release into the apical or basal chambers could be evaluated directly. First, we verified that Hmgcs2 protein was indeed expressed in hfRPE cells (Fig. 3A). Next, we incubated hfRPE cells (both apical and basal chambers) with Ringer's solution containing no substrate, glucose (5 mm), BSA-palmitate (200 μm), or both glucose (5 mm) and BSA-palmitate (200 μm). Samples of Ringer's solution from apical and basal chambers were collected at the 2- and 3-h time points and subsequently analyzed for β-HB using a commercially available assay kit. As shown in Fig. 3B, hfRPE cells fed glucose or palmitate alone produced low but detectable levels of β-HB compared with the no substrate control. Importantly, hfRPE cells incubated with Ringer's solution containing both glucose and palmitate produced and released significantly more β-HB into the apical chamber (2.80 ± 0.34 nmol/cm2 RPE in 3 h) than those given glucose (1.81 ± 0.35 nmol/cm2 RPE in 3 h, p = 0.025) or palmitate (1.73 ± 0.17 nmol/cm2 RPE in 3 h, p = 0.015) alone. Although β-HB was readily detected in the apical chamber, β-HB in the basal chamber was below the detection limit of the assay and, therefore, was considered not significant and excluded from the analysis.
FIGURE 3.

Human and mouse RPE produce β-HB that is preferentially released apically. A, Western blot analysis of hfRPE total lysates for Hmgcs2 protein expression. B, hfRPE cells were incubated (in both apical (Ap) and basal chambers) with glucose, palmitate, or both, and the apical supernatant was evaluated for β-HB content using a StanBio β-HB kit. NS, not significant. C, hfRPE cells were incubated in Ringer's solution containing glucose, palmitate, or both, and the apical and basal (Ba) supernatant was evaluated for total ketone (β-HB and acetoacetate) content using a Wako total ketone kit. D, hfRPE cells were incubated with [1-13C]palmitate with or without unlabeled glucose for 3 h, and 13C incorporation into TCA cycle metabolites and β-HB incorporation into the cells was evaluated using GC-MS. E, hfRPE cells were incubated with [1-13C]palmitate with or without unlabeled glucose for 3 h, and the apical and basal supernatant was analyzed for 13C β-HB levels. F, freshly isolated mouse RPE was incubated in Ringer's solution containing palmitate and glucose for 3 h, and the supernatant was analyzed for β-HB levels using a StanBio β-HB kit. Data were analyzed using Student's t test. * indicates statistical significance with p value < 0.05.
In addition to the β-HB kit, we used a total ketone assay kit that can detect β-HB (plus acetoacetate) at the picomole range (limit of detection, 5 pmol). Using this kit, we detected ketones in the basal compartment at concentrations well above the detection limit, thus allowing us to quantify total ketones released into the apical and basal chambers (Fig. 3C). From this experiment, we verified that hfRPE cells metabolized palmitate to produce ketones (consistent with data from the β-HB assay). Importantly we found that hfRPE cells preferentially release ketones into the apical chamber (palmitate and glucose, 2.2 ± 0.2 nmol/cm2 RPE) versus the basal chamber (palmitate and glucose, 1.0 ± 0.2 nmol/cm2 RPE).
To further examine the metabolism of fatty acids by hfRPE, we incubated hfRPE cells with 13C-labeled sodium palmitate (BSA-conjugated [1-13C]sodium palmitate, 200 μm) in the presence or absence of 5 mm unlabeled glucose for 3 h and analyzed them for 13C incorporation into various metabolites in the TCA cycle and β-HB using GC-MS. As shown in Fig. 3D, hfRPE cells incorporated the first (and only) 13C-labeled carbon from palmitate into citrate, glutamate, and, importantly, β-HB. There were significant variations in the data, primarily because of the low levels of 13C metabolites detected. In addition to intracellular metabolites, we also analyzed the Ringer's solution in the apical and basolateral compartments of these hfRPE for 13C metabolites. We found that hfRPE cells incubated with [1-13C]palmitate alone released significantly more (7-fold) labeled β-HB (75.2 ± 49.7 pmol/cm2 RPE in a 500-μl volume over 3 h) into the apical chamber compared with the basal chamber (10.5 ± 18.3 pmol/cm2 RPE in a 1500-μl volume over 3 h) (Fig. 3E). Similarly, hfRPE cells incubated with [1-13C]palmitate and unlabeled glucose released more labeled β-HB into its apical chamber (157.3 ± 49.0 pmol/cm2 RPE) compared with its basal chamber (58.8 ± 23.7 pmol/cm2 RPE). These values were lower (≈15-fold) compared with β-HB detected using assay kits (Figs. 3, B and C). Considering that each palmitate can be β-oxidized into eight acetyl-CoAs, that only one was 13C-labeled (1:7 ratio), and that the ratio of 13C-labeled versus unlabeled β-HB was 1:15, it can be estimated that 50% of palmitate-derived acetyl-CoA entered the ketogenesis pathway to produce β-HB, whereas the rest entered the TCA cycle to produce glutamate and ATP (as demonstrated by the GC-MS data in Fig. 3D and the Seahorse data in Fig. 1). Collectively, our findings demonstrate that hfRPE cells metabolize fatty acids to produce β-HB that was released preferentially across its apical membrane.
Because hfRPE cells can produce β-HB, we proceeded to evaluate β-HB production in mouse RPE. In these experiments, mice (≈postnatal day (P) 60) were euthanized. The eyes were enucleated and dissected, and freshly isolated RPE-choroid was transferred immediately to Krebs/HCO3 Ringer's solution containing palmitate (200 μm in the presence of 5 mm glucose) or no substrate at 37 °C and in 5% CO2 over a 3-h period. As shown in Fig. 3F, we found that mouse RPE explants incubated with palmitate (and glucose) consistently produced ≈2-fold more β-HB than mouse RPE without any substrate (n = 4; p < 0.01; limit of detection, 0.43 nmol).
The Retina Metabolizes Ketones
The preferential release of β-HB across the RPE apical membrane suggests that RPE cells produce ketones that can be utilized by the retina as a metabolic substrate. It is known that cell types that regularly use β-HB as a source of energy also express high levels of 3-oxoacid CoA transferase 1 (OXCT1), which catalyzes the conversion of acetoacetate to acetoacetyl-CoA, a key step in β-HB catabolism. From the qPCR analysis of CD73+ rods versus CD73− retinal cells and other ocular tissues and microarray data from Siegert et al. (13), we showed that mouse photoreceptor cells are highly enriched in oxct1 mRNA (Fig. 4). To evaluate whether β-HB is metabolized by the retina at the physiological level, we incubated a freshly isolated mouse retina with 2,4-13C2 β-HB for1 h in the presence of 5 mm unlabeled glucose and found that the mouse retina incorporated labeled carbons from 13C β-HB into metabolites in the TCA cycle (citrate, fumarate, and malate) and amino acids (glutamate and aspartate) (Fig. 5, A and B), demonstrating that the retina is capable of utilizing β-HB as an energy substrate. Importantly, a large fraction of the β-HB-derived acetyl-CoA that enters the TCA cycle was converted into glutamate (as indicated by low 13C incorporation into TCA intermediates (succinate, fumarate, malate, and aspartate)) (Fig. 5B). Mass isotopomer analysis showed that 13C-labeled β-HB was metabolized into citrate in the TCA cycle within 15 min (Fig. 5C). Furthermore, it took less than 15 min for each molecule of β-HB to be metabolized into glutamate (single-labeled glutamate (M1) was detected in 15 min but not double-labeled glutamate (M2), Fig. 5D) and between 30–60 min for β-HB to be metabolized into aspartate (double-labeled aspartate (M2) was detected in 60 min but not in 15 and 30 min, Fig. 5E).
FIGURE 4.
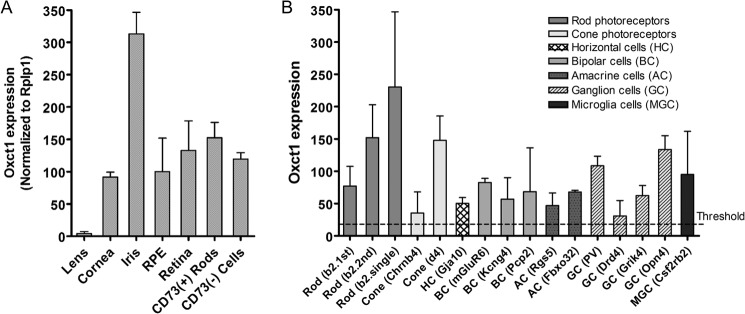
Photoreceptor cells express OXCT1. A, qRT-PCR analysis for Oxct1 expression in Dynabead®-purified CD73-positive versus CD73-negative rod photoreceptor cells and other mouse ocular tissues. Expression levels in various tissues are relative to the RPE (set to 100%). B, microarray data (13) analysis for Oxct1 expression in rod and cone photoreceptor cells versus other retinal cell types. PV, parvalbumin.
FIGURE 5.

The mouse retina metabolizes 13C β-HB to produce TCA cycle metabolites and amino acids. A, schematic of 2,4-13C2 β-HB metabolism through one TCA cycle (ending at oxaloacetate). For each metabolite, the 13C carbon is highlighted in gray at the expected carbon position. Each 2-13C acetyl-CoA that enters the TCA cycle will produce single labeled metabolites. In the second turn, new 2-13C acetyl-CoA will add to a 2-13C1 oxaloacetate to produce 2,4-13C2 citrate, and so on. OXCT, 3-oxoacid-CoA transferase; ACAT, acetyl-CoA acetyltransferase; BDH, 3-hydroxybutyrate dehydrogenase; CoA-SH, coenzyme A; CS, citrate synthase. B, a freshly isolated mouse retina was incubated in Krebs/HCO3 Ringer's solution containing 2,4-13C2 β-HB over 15, 30, or 60 min, and the whole tissue was analyzed for 13C-labeled metabolites using GC-MS. Shown is the percent 13C-labeled versus unlabeled citrate (C), glutamate (D), and aspartate (E) isotopomers in a mouse retina incubated with 2,4-13C2 β-HB for 15, 30, or 60 min. M1 represents single 13C-labeled metabolites (irrespective of carbon position), M2 represents double 13C-labeled metabolites, and so forth. Data are presented as percent of 13C-labeled metabolite relative to the total (both labeled and unlabeled) within the sample.
The RPE and Retina Transports Ketones via MCTs
The fact that β-HB (with pKa of 4.39) is ionized at physiological pH and the observation that β-HB is released by the RPE and can be taken up and metabolized in the retina suggest the presence of facilitated transporters that mediate the transfer of these metabolites across the RPE and retinal cell membranes. Two promising candidates for facilitated ketone transporter are MCT isoforms 1 (MCT1, encoded by Slc16a1) and 7 (MCT7, encoded by Slc16a6), both of which are known to transport β-HB (12, 15). Although MCT1 is expressed exclusively at the RPE apical membrane and enriched at the photoreceptor inner segment (16), MCT7 expression in the RPE and retina has not been studied. Microarray analysis (GSE10246, Ref. 6) revealed that MCT7 was highly expressed in the RPE and retina (Fig. 6A) compared with all other tissues (e.g. brain, heart, intestine, kidney, liver, and muscle). Analysis of single cell microarray data (20) comparing rod photoreceptor cells (adult) versus Müller cells (adult) and other retinal cells revealed that MCT7 is particularly enriched in rod photoreceptor cells (Fig. 6B). Corroborating this finding is a publicly available microarray dataset by Siegert et al. (13), who achieved mRNA profiling of almost all retinal cell types (rod and cone photoreceptor cells and horizontal, bipolar, amacrine, ganglion, and microglia cells) in the murine model. Some of their data are represented in Fig. 6C, which shows that Slc16a6 was highly expressed in rod (b2.first, b2.second, and b2.single) and cone (Chrnb4 and d4) photoreceptor cells as well as microglia (Csf2rb2) but not in any other retinal cell types tested (horizontal, bipolar, amacrine, and ganglion cells). To confirm the microarray data, we used a Dynabead®-conjugated CD73 antibody to pull down CD73+ rod photoreceptor cells (from papain-dissociated mouse retina) for qRT-PCR analysis. CD73 is a cell surface antigen that is specifically expressed on rod photoreceptor cells and can be used to select rods from a mixed pool of retinal cells (25). We verified that the CD73+ rods express Crx, rhodopsin (Rho), and Pde6a but not cone opsin (short wavelength, Opn-sw), RPE65 (an RPE marker), or slc6a1 (a bipolar cell marker) (Fig. 6D). Importantly, we found that these CD73+ retinal cells are enriched in MCT1 and MCT7 (Fig. 6D), consistent with the microarray data analyses. Collectively, our data support a model in which β-HB released from the RPE into the interphotoreceptor space is transported into the retina via MCT1 and MCT7.
FIGURE 6.

MCT1 and MCT7 are expressed specifically in photoreceptor cells. A, GSE10246 microarray (6) analysis of all MCT isoforms in the RPE and retina versus other tissues. B, microarray data (20) analysis of single mouse rod photoreceptor and Müller cells for Mct1 and Mct7 expression. C, microarray data (13) analysis for Mct7 expression in rod and cone photoreceptor cells versus other retinal cell types. D, qRT-PCR analysis of photoreceptor specific genes (Crx, Rho, Pde6a, and Opn1-sw) and Mct1 and Mct7 expression in Dynabead®-purified CD73-positive versus CD73-negative rod photoreceptor cells and other mouse ocular tissues.
To further test this model, we directly evaluated β-HB transport across the RPE and retina. Although there is currently no known inhibitor for MCT7, we were able to test the role of MCT1 in β-HB transport across the RPE using an MCT1/2 inhibitor (AR-C155858, Ref. 21). Fully differentiated and polarized hfRPE cells on Transwell filters (RT > 500 Ω·cm2) were used in these transport experiments. Glucose-free Ringer's solution containing lactate (5 mm) was added to the apical bath in the presence or absence of AR-C155858 (10 μm, apical chamber) or another well established MCT1 inhibitor, α-CHC (5 mm). Ringer's solution in the basal chamber (which initially contained no lactate) was then analyzed for lactate concentration at the 30- and 60-min time points. Over this 1-h timespan, RT remained well above 500 Ω·cm2, indicating that the barrier properties of the hfRPE cells were intact throughout the experiment. As shown in Fig. 7A, both AR-C155858 and α-CHC (a competitive inhibitor of MCT1) significantly decreased transepithelial lactate transport by ∼40–50%. AR-C155858 together with α-CHC decreased lactate transport by 65–70%. Next, we evaluated the role of MCT1 in β-HB transport across the RPE. In this experiment, Ringer's solution containing β-HB (5 mm) was added to the hfRPE basal chamber, and Ringer's solution in the apical chamber was analyzed for β-HB at the 15- and 30-min time points. As shown in Fig. 7B, AR-C155858 significantly inhibited β-HB transport by ∼75–80%, indicating that MCT1 plays a major role in β-HB transport across the RPE apical membrane. Because MCT1 is also known to transport acetoacetate (15), we evaluated acetoacetate transport across the RPE using the same strategy. Ringer's solution containing lithium acetoacetate (5 mm) was added to the hfRPE basal chamber, and Ringer's solution in the apical chamber was analyzed at the 15- and 30-min time points for acetoacetate using a total ketone kit. Fig. 7C shows that hfRPE can mediate transepithelial acetoacetate transport, and, like β-HB transport, this process was inhibited significantly by AR-C155858, suggesting that the RPE can potentially release acetoacetate as a metabolic substrate for the retina.
FIGURE 7.
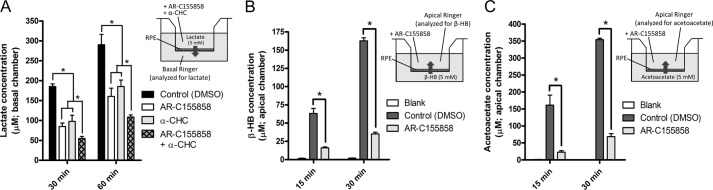
hfRPE cells transport β-HB across their apical membranes via MCT1. A, apical-to-basal transport of lactate across hfRPE cells on Transwells in the presence of AR-C155858 (10 μm), α-CHC (5 mm), or both in the apical bath. DMSO, dimethyl sulfoxide. B, basal-to-apical transport of β-HB across hfRPE cells on Transwells in the presence of AR-C155858 (10 μm) in the apical (Ap) bath. C, basal-to-apical transport of acetoacetate across hfRPE cells on Transwells in the presence of AR-C155858 (10 μm) in the apical bath. Data were analyzed using Student's t test. * indicates statistical significance with p value < 0.05.
To evaluate the role of MCT1 in β-HB uptake by the retina, we incubated freshly isolated mouse retina with either [U-13C]lactate as a positive control or 2,4-13C2 β-HB for 30 min in the presence or absence of AR-C155858 (10 μm) (Fig. 8). Samples were subsequently analyzed by GC-MS to determine 13C incorporation into various downstream metabolites. Two-way analysis of variance with Sidak multiple comparisons test was used for data analysis. As expected, mouse retinas given [13C]lactate and treated with AR-C155858 contained significantly lower levels of 13C metabolites (lactate, citrate, and glutamate) than the control (Fig. 8A), indicating that lactate transport into the retina is mediated predominantly by MCT1/2. In contrast, the effect of AR-C155858 on 13C metabolite incorporation from 2,4-13C2 β-HB into citrate and glutamate was not significant (Fig. 8B), suggesting that MCT7 may be the dominant transporter for β-HB in the retina (more specifically, photoreceptor cells).
FIGURE 8.
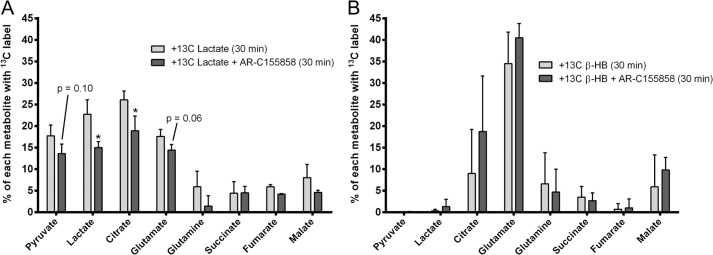
β-HB transport into the retina was independent of MCT1 activity. A freshly isolated retina was incubated with [U-13C]lactate (5 mm) (A) or 2,4-13C2 β-HB (5 mm) (B) for 30 min in the presence or absence of AR-C155858 (10 μm). Retina samples were analyzed for 13C metabolites using GC-MS. Data are presented as percent of 13C-labeled metabolite relative to the total (both labeled and unlabeled) within the sample. Data were analyzed using two-way ANOVA. * indicates statistical significance with p value < 0.05.
DISCUSSION
Previous studies have shown that the RPE is capable of metabolizing POS, enriched in saturated fatty acids (2, 26), via mitochondrial β-oxidation (5, 27). A direct measurement of oxygen consumption by hfRPE cells using the Seahorse XF24 bioanalyzer confirmed that hfRPE cells can use palmitate as a substrate for oxidative respiration (Fig. 1). This is consistent with our finding that hfRPE cells incorporate [13C]palmitate into key TCA cycle metabolites, citrate and glutamate (Fig. 3D). However, in addition to using palmitate as an energy substrate, we found that RPE cells used ≈50% of acetyl-CoA derived from palmitate to produce β-HB. Furthermore, β-HB was released preferentially across its apical membrane toward the retina, suggesting that β-HB plays an important role in retinal metabolism and health. These findings led us to hypothesize a model of metabolic coupling between the RPE and the retina in which the RPE metabolizes fatty acids derived from phagocytized POS discs and produces β-HB as an end product of fatty acid β-oxidation (Fig. 9). β-HB is transported across the RPE apical membrane via MCT1 and into photoreceptor cells via MCT1 and MCT7.
FIGURE 9.
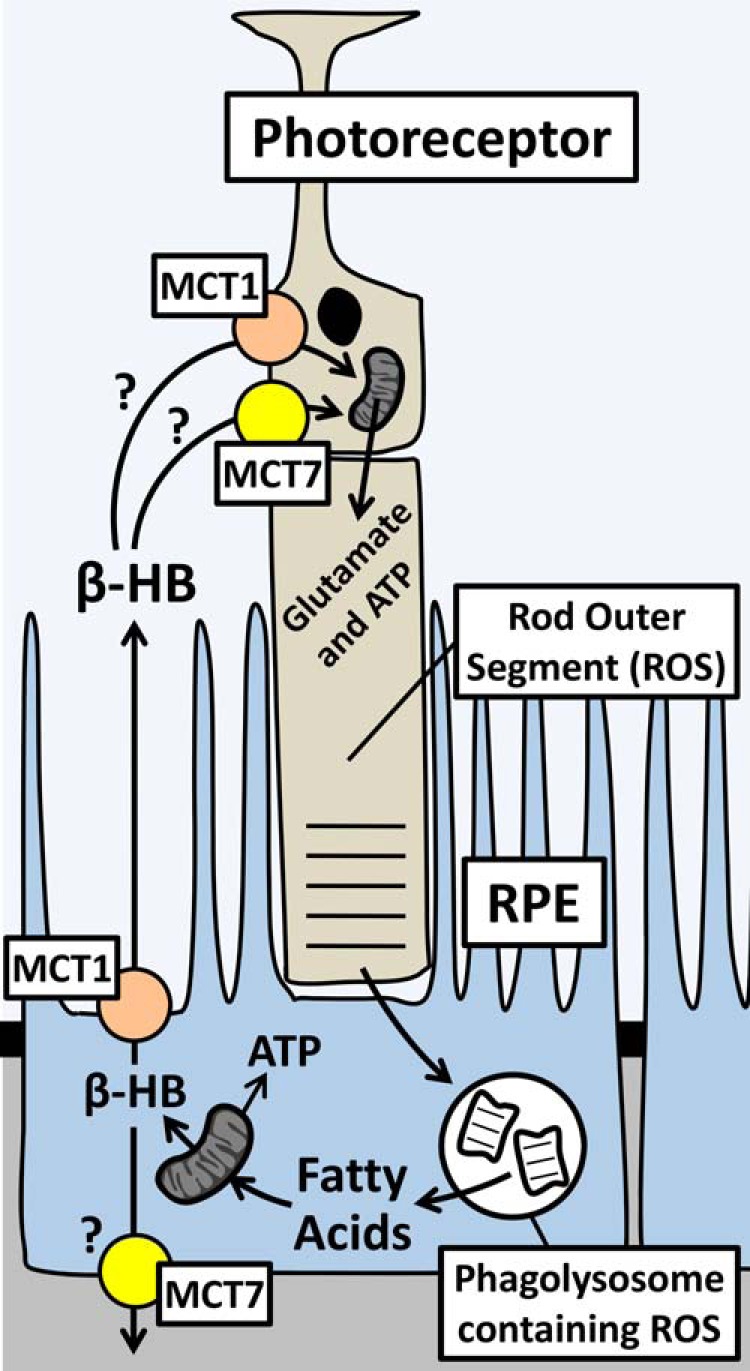
Model of metabolic coupling between photoreceptor cells and the RPE. Shed ROS is phagocytized by the RPE and degraded to release fatty acids that are converted into β-HB. MCT1 at the RPE apical microvilli mediates transport of β-HB into the interphotoreceptor space. Photoreceptor cells take up β-HB via MCT1 and MCT7 and metabolize it in the mitochondria to generate amino acid intermediates and ATP.
In this study, we focused on β-HB as the major substrate that is shuttled from the RPE and retina. However, acetoacetate, the other ketone body, can also potentially fulfill this role. It is important to mention that a similar mechanism of ketone shuttling and metabolism has been proposed as a form of neuron-astrocyte interaction (28). This mechanism is on the basis of the ability of astrocytes to metabolize fatty acids, producing ketone bodies, β-HB and acetoacetate (29, 30), that can be utilized by adjacent neurons as oxidative substrates. Drawing parallels between the neuron-astrocyte and RPE-retina systems, one could posit that the RPE could also produce and release acetoacetate and β-HB as a substrate for photoreceptor metabolism. Consistent with this notion, both β-HB and acetoacetate are well established transport substrates of MCT1, and we showed that transepithelial acetoacetate transport across the RPE was inhibited significantly by the specific MCT1 inhibitor AR-C155858. Because the retina expresses MCT1 (and MCT7) and because acetoacetate is the direct downstream product of β-HB catabolism, photoreceptor cells are likely to metabolize acetoacetate as an oxidative substrate, as they do with β-HB.
Because POS phagocytosis is regulated by the circadian rhythm (1), the utilization of shed POS as a source of lipid substrate for RPE metabolism suggests that ketone production by the RPE follows the same diurnal schedule of POS shedding, an event that is characterized by a transient burst of activity in the morning upon onset of light. Thus, this may be a mechanism through which photoreceptor cells signal to the RPE, which responds by ramping up production and transport of β-HB to photoreceptor cells to help fulfill the metabolic demands of POS renewal. At the molecular level, POS phagocytosis can activate two potential pathways in the RPE that enhance ketone synthesis: inositol 1,4,5-trisphosphate/Ca2+/cAMP signaling (31) and PPARs (11). The former is supported by a recent study that used high-throughput RNA-Seq analysis to show that POS phagocytosis activates genetic pathways associated with inositol 1,4,5-trisphosphate/Ca2+ signaling (31), which can activate Ca2+-sensitive adenylyl cyclase type 1 (ADCY 1), which is enriched in the RPE, to produce cAMP and stimulate Hmgcs2 expression via a cAMP response element at its promoter. Free fatty acids (released from digested POS) can act as ligands of PPAR (32), which form a heterodimer with the retinoid X receptor to stimulate Hmgcs2 expression by binding to the nuclear receptor response element at its promoter (10). Consistent with this hypothesis, analysis of RNA-Seq data by Mustafi et al. (31) also revealed that mouse RPE isolated 1.5 h after light onset express 30% higher Hmgcs2 transcripts than RPE isolated at 9 h. Furthermore, PPAR-γ coactivator 1 α (PGC-1α, encoded by PPARGC1A), the master regulator of mitochondrial biogenesis and oxidative metabolism (33), is expressed at 50% higher levels in mouse RPE isolated 1.5 versus 9 h after light onset. These data supports our hypothesis that photoreceptor phagocytosis is followed by activation of the fatty acid β-oxidation and ketogenesis pathways.
Our data show that the retina rapidly takes up β-HB from the extracellular space and metabolizes it via oxidative metabolism. Although the retina is composed of many different cell types, RPE-generated β-HB is most likely taken up and metabolized in the photoreceptor or Müller glia cells because of their close proximity with the RPE. Here we demonstrated that the recently identified β-HB transporter MCT7 is expressed highly and specifically in mouse photoreceptor cells (Fig. 6), suggesting that a large fraction of β-HB produced by the RPE is transported into photoreceptor cells. In addition to transport, photoreceptor cells possess a high mitochondrial capacity that allows them to effectively metabolize β-HB (33). Müller cells on the other hand, have low mitochondria density and are primarily glycolytic (34, 35). The oxidative nature of photoreceptor cells provides two key factors that are needed for efficient β-HB metabolism: a high NAD+:NADH ratio, which promotes 3-hydroxybutyrate dehydrogenase (BDH)-mediated conversion of β-HB to acetoacetate, and a source of succinyl-CoA (a TCA cycle metabolite), which is required as a cofactor for OXCT1-mediated conversion of acetoacetate to acetoacetyl-CoA, a key step in β-HB catabolism in the mitochondria. Importantly, OXCT1 is highly expressed in photoreceptor cells, as determined by qPCR analysis of CD73+ rod cells and microarray data of retina cells from Siegert et al. (13) (Fig. 4). Although ketone metabolism generally occurs in the mitochondria, there is an enzyme, acetoacetyl-CoA synthetase (Aacs), that catalyzes the same reaction as Oxct1, but in the cytosol. However, acetoacetyl-CoA synthetase is not expressed in mouse retina according to two microarray datasets (GSE10246 and data from Siegert et al. 13), suggesting that mitochondrial Oxct1 is the dominant pathway through which β-HB is metabolized in photoreceptor cells. Taken together, our analyses support the notion that β-HB produced by the RPE is metabolized primarily in photoreceptor cells.
In this study, we found that glutamate is a major product of β-HB metabolism. This is consistent with a recent study that reported that β-HB is a preferred substrate for glutamate synthesis in neurons (36), where glutamate acts as an important neurotransmitter and as a cofactor for glutathione and amino acid synthesis. In our experiments, we found that 13C β-HB metabolism was unaffected by the presence or absence of unlabeled glucose (data not shown), suggesting that glucose metabolism pathways do not compete with β-HB metabolism. Beyond the role of β-HB as a metabolic substrate, β-HB also suppresses oxidative stress by acting as an inhibitor of HDAC1 in various cell types (37). This notion is backed by numerous studies showing that increasing β-HB levels, by administering a ketogenic diet or direct β-HB infusion, can ameliorate symptoms of neurodegenerative diseases such as Alzheimer disease and Huntington disease (reviewed in Ref. 38). In the context of RPE and retina health, the neuroprotective effects of β-HB present a useful mechanism through which the RPE could shield photoreceptor cells (and potentially Müller cells) from the high-stress environment of the subretinal space. The RPE itself is a likely beneficiary of its own β-HB production, which helps it overcome the toxicity of oxidative stressors that it inherits from phagocytized POS. An important consideration for this mechanism is whether the RPE is producing enough β-HB to exert a physiologically significant impact on RPE and retina health, considering that the adult human eye has a subretinal space volume of 10 μl (39) across the retina surface area of 12 cm2 (40). β-HB production at a rate of ∼1 nmol/hr/cm2 RPE (as estimated from our data) will generate ∼1 mm β-HB concentration in 1 h. Because β-HB has been shown to induce histone acetylation in the kidney at concentrations as low as 0.2 mm (37), we expect the role of β-HB in RPE and retinal cell health to be significant.
CONCLUSIONS
In this study, we show, for the first time, that mouse and human RPE cells can metabolize fatty acids to produce ketones that are released preferentially into the retinal microenvironment. Furthermore, we demonstrate that the retina can take up and metabolize β-HB as a metabolic substrate. However, our study also brought about many new questions involving the regulation of β-HB production in the RPE and the role of β-HB in the retina. Does phagocytosis of POS induce ketogenesis? Does β-HB production in the RPE in vivo follow the diurnal cycle of POS phagocytosis? Does inositol 1,4,5-trisphosphate/Ca2+/cAMP signaling and PPAR activate RPE ketogenesis? Can β-HB inhibit oxidative stress in the RPE and retina? Can it slow retinal degeneration in disease models? These questions explore the mechanism of β-HB production in the RPE and the role of β-HB in retinal health and function.
Acknowledgments
We thank Drs. Sheldon Miller and Arvydas Maminishkis for the hfRPE cell culture model developed in their laboratory.
This work was supported, in whole or in part, by National Institutes of Health Grants EY012042 (to N. J. P.) and EY017863 and EY006641 (to J. B. H.).
- RPE
- retinal pigment epithelial/epithelium
- OS
- outer segment
- POS
- photoreceptor outer segment
- β-HB
- β-hydroxybutyrate
- PPAR
- peroxisome proliferator-activated receptor
- hfRPE
- human fetal retinal pigment epithelial/epithelium
- qPCR
- quantitative PCR
- OCR
- oxygen consumption rate
- α-CHC
- α-cyano-4-hydroxycinnamate
- qRT-PCR
- quantitative RT-PCR
- MCT
- monocarboxylate transporter.
REFERENCES
- 1. Kevany B. M., Palczewski K. (2010) Phagocytosis of retinal rod and cone photoreceptors. Physiology 25, 8–15 [DOI] [PMC free article] [PubMed] [Google Scholar]
- 2. Boesze-Battaglia K., Schimmel R. (1997) Cell membrane lipid composition and distribution: implications for cell function and lessons learned from photoreceptors and platelets. J. Exp. Biol. 200, 2927–2936 [DOI] [PubMed] [Google Scholar]
- 3. Chen H., Anderson R. E. (1993) Metabolism in frog retinal pigment epithelium of docosahexaenoic and arachidonic acids derived from rod outer segment membranes. Exp. Eye Res. 57, 369–377 [DOI] [PubMed] [Google Scholar]
- 4. Chen H., Anderson R. E. (1993) Differential incorporation of docosahexaenoic and arachidonic acids in frog retinal pigment epithelium. J. Lipid Res. 34, 1943–1955 [PubMed] [Google Scholar]
- 5. Tyni T., Johnson M., Eaton S., Pourfarzam M., Andrews R., Turnbull D. M. (2002) Mitochondrial fatty acid β-oxidation in the retinal pigment epithelium. Pediatr. Res. 52, 595–600 [DOI] [PubMed] [Google Scholar]
- 6. Lattin J. E., Schroder K., Su A. I., Walker J. R., Zhang J., Wiltshire T., Saijo K., Glass C. K., Hume D. A., Kellie S., Sweet M. J. (2008) Expression analysis of G protein-coupled receptors in mouse macrophages. Immunome Res. 4, 5. [DOI] [PMC free article] [PubMed] [Google Scholar]
- 7. Zhao C., Yasumura D., Li X., Matthes M., Lloyd M., Nielsen G., Ahern K., Snyder M., Bok D., Dunaief J. L., LaVail M. M., Vollrath D. (2011) mTOR-mediated dedifferentiation of the retinal pigment epithelium initiates photoreceptor degeneration in mice. J. Clin. Invest. 121, 369–383 [DOI] [PMC free article] [PubMed] [Google Scholar]
- 8. Hegardt F. G. (1999) Mitochondrial 3-hydroxy-3-methylglutaryl-CoA synthase: a control enzyme in ketogenesis. Biochem. J. 338, 569–582 [PMC free article] [PubMed] [Google Scholar]
- 9. Vilà-Brau A., De Sousa-Coelho A. L., Mayordomo C., Haro D., Marrero P. F. (2011) Human HMGCS2 regulates mitochondrial fatty acid oxidation and FGF21 expression in HepG2 cell line. J. Biol. Chem. 286, 20423–20430 [DOI] [PMC free article] [PubMed] [Google Scholar]
- 10. Rodríguez J. C., Gil-Gómez G., Hegardt F. G., Haro D. (1994) Peroxisome proliferator-activated receptor mediates induction of the mitochondrial 3-hydroxy-3-methylglutaryl-CoA synthase gene by fatty acids. J. Biol. Chem. 269, 18767–18772 [PubMed] [Google Scholar]
- 11. Ershov A. V., Bazan N. G. (2000) Photoreceptor phagocytosis selectively activates PPARγ expression in retinal pigment epithelial cells. J. Neurosci. Res. 60, 328–337 [DOI] [PubMed] [Google Scholar]
- 12. Hugo S. E., Cruz-Garcia L., Karanth S., Anderson R. M., Stainier D. Y., Schlegel A. (2012) A monocarboxylate transporter required for hepatocyte secretion of ketone bodies during fasting. Genes Dev. 26, 282–293 [DOI] [PMC free article] [PubMed] [Google Scholar]
- 13. Siegert S., Cabuy E., Scherf B. G., Kohler H., Panda S., Le Y. Z., Fehling H. J., Gaidatzis D., Stadler M. B., Roska B. (2012) Transcriptional code and disease map for adult retinal cell types. Nat. Neurosci. 15, 487–495, S1–S2 [DOI] [PubMed] [Google Scholar]
- 14. Price N. T., Jackson V. N., Halestrap A. P. (1998) Cloning and sequencing of four new mammalian monocarboxylate transporter (MCT) homologues confirms the existence of a transporter family with an ancient past. Biochem. J. 329, 321–328 [DOI] [PMC free article] [PubMed] [Google Scholar]
- 15. Halestrap A. P., Meredith D. (2004) The SLC16 gene family: from monocarboxylate transporters (MCTs) to aromatic amino acid transporters and beyond. Pflugers Arch. 447, 619–628 [DOI] [PubMed] [Google Scholar]
- 16. Philp N. J., Ochrietor J. D., Rudoy C., Muramatsu T., Linser P. J. (2003) Loss of MCT1, MCT3, and MCT4 expression in the retinal pigment epithelium and neural retina of the 5A11/basigin-null mouse. Invest. Ophthalmol. Vis. Sci. 44, 1305–1311 [DOI] [PubMed] [Google Scholar]
- 17. Maminishkis A., Chen S., Jalickee S., Banzon T., Shi G., Wang F. E., Ehalt T., Hammer J. A., Miller S. S. (2006) Confluent monolayers of cultured human fetal retinal pigment epithelium exhibit morphology and physiology of native tissue. Invest. Ophthalmol. Vis. Sci. 47, 3612–3624 [DOI] [PMC free article] [PubMed] [Google Scholar]
- 18. Gallagher-Colombo S., Maminishkis A., Tate S., Grunwald G. B., Philp N. J. (2010) Modulation of MCT3 expression during wound healing of the retinal pigment epithelium. Invest. Ophthalmol. Vis. Sci. 51, 5343–5350 [DOI] [PMC free article] [PubMed] [Google Scholar]
- 19. Strunnikova N. V., Maminishkis A., Barb J. J., Wang F., Zhi C., Sergeev Y., Chen W., Edwards A. O., Stambolian D., Abecasis G., Swaroop A., Munson P. J., Miller S. S. (2010) Transcriptome analysis and molecular signature of human retinal pigment epithelium. Hum Mol. Genet. 19, 2468–2486 [DOI] [PMC free article] [PubMed] [Google Scholar]
- 20. Roesch K., Jadhav A. P., Trimarchi J. M., Stadler M. B., Roska B., Sun B. B., Cepko C. L. (2008) The transcriptome of retinal Muller glial cells. J. Comp. Neurol. 509, 225–238 [DOI] [PMC free article] [PubMed] [Google Scholar]
- 21. Ovens M. J., Davies A. J., Wilson M. C., Murray C. M., Halestrap A. P. (2010) AR-C155858 is a potent inhibitor of monocarboxylate transporters MCT1 and MCT2 that binds to an intracellular site involving transmembrane helices 7–10. Biochem. J. 425, 523–530 [DOI] [PMC free article] [PubMed] [Google Scholar]
- 22. Manning Fox J. E., Meredith D., Halestrap A. P. (2000) Characterisation of human monocarboxylate transporter 4 substantiates its role in lactic acid efflux from skeletal muscle. J. Physiol. 529, 285–293 [DOI] [PMC free article] [PubMed] [Google Scholar]
- 23. Du J., Cleghorn W., Contreras L., Linton J. D., Chan G. C., Chertov A. O., Saheki T., Govindaraju V., Sadilek M., Satrústegui J., Hurley J. B. (2013) Cytosolic reducing power preserves glutamate in retina. Proc. Natl. Acad. Sci. U.S.A. 110, 18501–18506 [DOI] [PMC free article] [PubMed] [Google Scholar]
- 24. Du J., Cleghorn W. M., Contreras L., Lindsay K., Rountree A. M., Chertov A. O., Turner S. J., Sahaboglu A., Linton J., Sadilek M., Satrústegui J., Sweet I. R., Paquet-Durand F., Hurley J. B. (2013) Inhibition of mitochondrial pyruvate transport by zaprinast causes massive accumulation of aspartate at the expense of glutamate in the retina. J. Biol. Chem. 288, 36129–36140 [DOI] [PMC free article] [PubMed] [Google Scholar]
- 25. Koso H., Minami C., Tabata Y., Inoue M., Sasaki E., Satoh S., Watanabe S. (2009) CD73, a novel cell surface antigen that characterizes retinal photoreceptor precursor cells. Invest. Ophthalmol. Vis. Sci. 50, 5411–5418 [DOI] [PubMed] [Google Scholar]
- 26. Meyer J. S., Shearer R. L., Capowski E. E., Wright L. S., Wallace K. A., McMillan E. L., Zhang S. C., Gamm D. M. (2009) Modeling early retinal development with human embryonic and induced pluripotent stem cells. Proc. Natl. Acad. Sci. U.S.A. 106, 16698–16703 [DOI] [PMC free article] [PubMed] [Google Scholar]
- 27. Tyni T., Paetau A., Strauss A. W., Middleton B., Kivelä T. (2004) Mitochondrial fatty acid β-oxidation in the human eye and brain: implications for the retinopathy of long-chain 3-hydroxyacyl-CoA dehydrogenase deficiency. Pediatr. Res. 56, 744–750 [DOI] [PubMed] [Google Scholar]
- 28. Guzmán M., Blázquez C. (2001) Is there an astrocyte-neuron ketone body shuttle? Trends Endocrinol. Metab. 12, 169–173 [DOI] [PubMed] [Google Scholar]
- 29. Edmond J., Robbins R. A., Bergstrom J. D., Cole R. A., de Vellis J. (1987) Capacity for substrate utilization in oxidative metabolism by neurons, astrocytes, and oligodendrocytes from developing brain in primary culture. J. Neurosci. Res. 18, 551–561 [DOI] [PubMed] [Google Scholar]
- 30. Blázquez C., Sánchez C., Velasco G., Guzmán M. (1998) Role of carnitine palmitoyltransferase I in the control of ketogenesis in primary cultures of rat astrocytes. J. Neurochem. 71, 1597–1606 [DOI] [PubMed] [Google Scholar]
- 31. Mustafi D., Kevany B. M., Genoud C., Bai X., Palczewski K. (2013) Photoreceptor phagocytosis is mediated by phosphoinositide signaling. FASEB J. 27, 4585–4595 [DOI] [PMC free article] [PubMed] [Google Scholar]
- 32. Jeon C. J., Strettoi E., Masland R. H. (1998) The major cell populations of the mouse retina. J. Neurosci. 18, 8936–8946 [DOI] [PMC free article] [PubMed] [Google Scholar]
- 33. Stone J., van Driel D., Valter K., Rees S., Provis J. (2008) The locations of mitochondria in mammalian photoreceptors: relation to retinal vasculature. Brain Res. 1189, 58–69 [DOI] [PubMed] [Google Scholar]
- 34. Poitry-Yamate C. L., Poitry S., Tsacopoulos M. (1995) Lactate released by Muller glial cells is metabolized by photoreceptors from mammalian retina. J. Neurosci. 15, 5179–5191 [DOI] [PMC free article] [PubMed] [Google Scholar]
- 35. Bringmann A., Pannicke T., Grosche J., Francke M., Wiedemann P., Skatchkov S. N., Osborne N. N., Reichenbach A. (2006) Muller cells in the healthy and diseased retina. Prog. Retin. Eye Res. 25, 397–424 [DOI] [PubMed] [Google Scholar]
- 36. Li R., Maminishkis A., Banzon T., Wan Q., Jalickee S., Chen S., Miller S. S. (2009) IFNγ regulates retinal pigment epithelial fluid transport. Am. J. Physiol. Cell Physiol. 297, C1452–C1465 [DOI] [PMC free article] [PubMed] [Google Scholar]
- 37. Shimazu T., Hirschey M. D., Newman J., He W., Shirakawa K., Le Moan N., Grueter C. A., Lim H., Saunders L. R., Stevens R. D., Newgard C. B., Farese R. V., Jr., de Cabo R., Ulrich S., Akassoglou K., Verdin E. (2013) Suppression of oxidative stress by β-hydroxybutyrate, an endogenous histone deacetylase inhibitor. Science 339, 211–214 [DOI] [PMC free article] [PubMed] [Google Scholar]
- 38. Newman J. C., Verdin E. (2014) Ketone bodies as signaling metabolites. Trends Endocrinol. Metab. 25, 42–52 [DOI] [PMC free article] [PubMed] [Google Scholar]
- 39. Oyster C. W. (1999) The Human Eye: Structure and Function, p. 714, Sinauer Associates, Inc., Sunderland, MA [Google Scholar]
- 40. Panda-Jonas S., Jonas J. B., Jakobczyk M., Schneider U. (1994) Retinal photoreceptor count, retinal surface area, and optic disc size in normal human eyes. Ophthalmology 101, 519–523 [DOI] [PubMed] [Google Scholar]