

Abstract
Extensive methodological research has been conducted to improve gene expression summary methods. However, in addition to quantitative gene expression summaries, most platforms, including all those examined in the MicroArray Quality Control project, provide a qualitative detection call result for each gene on the platform. These detection call algorithms are intended to render an assessment of whether or not each transcript is reliably measured. In this paper, we review uses of these qualitative detection call results in the analysis of microarray data. We also review the detection call algorithms for two widely used gene expression microarray platforms, Affymetrix GeneChips and Illumina BeadArrays, and more clearly formalize the mathematical notation for the Illumina BeadArray detection call algorithm. Both algorithms result in a P-value which is then used for determining the qualitative detection calls. We examined the performance of these detection call algorithms and default parameters by applying the methods to two spike-in datasets. We show that the default parameters for qualitative detection calls yield few absent calls for high spike-in concentrations. When genes of interest are expected to be present at very low concentrations, spike-in datasets can be useful for appropriately adjusting the tuning parameters for qualitative detection calls.
Keywords: gene expression, microarray, detection calls, present
INTRODUCTION
After hybridization, washing, and scanning a microarray, a gene expression summary method is applied to the normalized intensities. These gene expression summaries are subsequently analyzed using statistical methods for performing gene-level class comparisons, deriving a phenotypic classifier, and in clustering applications. Commercially produced arrays provide software for calculating gene expression summaries, such as the MAS5 method for Affymetrix GeneChips [1]. Most research seeking to improve output from gene expression platforms has therefore focused on developing improved gene expression summary methods, some examples include the robust multiarray average (RMA) [2], GC-RMA [3] or the Model Based Expression Index (MBEI) [4] methods. However, a question frequently asked of a microarray experiment is, ‘Is the gene present in the given sample?’ Most platforms, including all those examined in the MicroArray Quality Control project, provide a qualitative detection call result for each gene on the platform [5]. These detection call algorithms are intended to render an assessment of whether or not each transcript is reliably measured. Since inclusion of transcripts not reliably measured in statistical analyses yields results not easily interpreted, a frequent use of the results from detection call algorithms is for dimension reduction or filtering [5–11]. Interestingly, there is no consistent filtering method being applied. Some filter genes called Absent on all arrays [6, 9]; others have recommended filtering by fraction present, which can be filtering out probe sets not called Present among at least 50% of the samples in one treatment group for small sample sizes, or for larger experiments, filtering out probe sets not called Present among at least 25% of the samples in one treatment group [8]. Regardless, filtering on detection call has been demonstrated to increase both the number of differentially expressed genes detected [6] and reduce the number of false positive findings [7, 8, 10]. Moreover, even when performing cross-platform comparisons, cross-platform correlation increased as the percent present call filter was increased [12].
Aside from filtering, detection call results have been used in a variety of other ways. Detection calls have been used for estimating the percent of genes present in a given hybridization, which is commonly used as a quality control measure [9–11, 13–18]. When evaluating replicate arrays, call concordance has been used as a measure of reproducibility, defined for two replicate hybridizations as the sum of probe sets called Absent, Marginally Present, or Present on both arrays [13]. In a study comparing two different microarray platforms, to obtain one detection call result per gene for each platform, Fisher’s method for combining P-values was applied to the detection call P-values from five samples hybridized to both platforms. Thereafter, the number of concordantly present and absent genes on both platforms served as a measure of cross-platform reproducibility [19]. In another study that compared the equivalence between use of standard poly(RNA) and total RNA as the starting template for subsequent cDNA reactions, detection call concordance among the hybridized microarrays was examined as the primary outcome [20].
Detection call P-values have also been used to weight gene expression values when clustering samples [21]. Specifically, for five different expression summary algorithms, the investigators examined whether using weighted or unweighted Pearson’s correlation in agglomerative hierarchical clustering, with the weights defined as 1-Detection Call P-value, improved the performance. They found that inclusion of detection call P-value weights improved the performance of the clustering result for MBEI, Probe Profiler, and RMA expression summaries.
Others have used detection call results in class comparisons and class predictions. For example, investigators identified estrogen-regulated genes by calculating a confidence score for each gene, of which one of the four components was a score based on the percent of samples having a present call for the given gene [22]. A similar method was used for identifying genes regulated by selective estrogen receptor modulators [23]. Detection call results have also been directly used in deriving a phenotypic classifier, which had better accuracy than a classifier derived using the gene expression summaries and the Prediction Analysis for Microarray algorithm [24]. These authors concluded that detection calls are especially useful for deriving a classifier when the study includes arrays of multiple chip formats, because the detection calls do not require any specific normalization.
In this paper, we review the detection call algorithms for two widely used gene expression microarray platforms, Affymetrix GeneChips and Illumina BeadArrays. Both algorithms result in a P-value which is then used for determining the detection call rate. Because two possible errors can be made when declaring a gene to be present or absent using these detection call algorithms, namely, one can declare a gene to be present when in fact it is absent (Type I Error) or declare a gene to be absent when in fact it is present (Type II Error), we examined the performance of these detection call algorithms using two low level spike-in datasets.
DETECTION CALL ALGORITHMS
Affymetrix detection call algorithm
An Affymetrix GeneChip is characterized as being composed of several perfect match (PM) and their corresponding mismatch (MM) probes that interrogate for a single gene. The PM is the exact complementary sequence of the target genetic sequence, composed of 25 base pairs. Each PM probe has a corresponding MM probe, which has the same sequence with exception that the middle base (13th) position is complementary to that in the PM [25]. The underlying idea behind the MM probes is to account for background. The set of PM/MM pairs that interrogate for a specific gene is called a probe set. As part of the output for an Affymetrix GeneChip, the GeneChip Operating Software includes a column labeled ‘Detection call’ that indicates whether the probe set is present (P), marginally present (M) or absent (A) in the given sample.
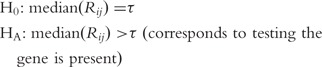
The original detection call algorithm was based on a decision tree, applied to two GeneChip outputs: the number of times the PM intensity exceeded the MM intensity for a given probe set and the average log(PM/MM) signal [25]. Some investigators noted deficiencies with the first rendition of the detection call algorithm and proposed an alternative detection call algorithm based on a permutation test [26], which was implemented in the dChip user-developed software [27]. With the release of Affymetrix’s Microarray Suite Software (MAS) version 5 came the current implementation of Affymetrix’s detection call algorithm [28]. It is based on a hypothesis test using the PM and MM intensities for the probe set and presumes the MM intensities are accurate estimates of gene-specific background. The Affymetrix detection call algorithm declares a probe set to be present, marginally present, or absent by using the Wilcoxon signed-rank test in the following manner [28]. First, probe pairs that have saturated MMs (intensity ≥46 000) are discarded. Additionally, probe pairs where PM and MM are within τ of each other are discarded. If all probe pairs for a probe set are saturated, the probe set is automatically labeled as ‘Present’ and the Detection call P-value set to 0. Thereafter, for probe set i, using each of its remaining probe pairs j, a discrimination score 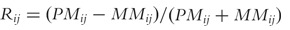 is calculated and the Wilcoxon Signed Rank test is conducted for the probe set with the null and alternative hypotheses specified as
 |
where the default value for τ is 0.015, which was empirically selected from a Latin Square experiment but is a user-adjustable parameter [28].
The decision rule used to declare genes as present, absent, or marginally present are based upon the resulting P-values using the following thresholds: if P < α1 then the probe set is declared present; if α1 < P < α2 the probe set if declared marginally present; if P > α2 the probe set is declared absent. The original defaults set α1 = 0.04 and α2 = 0.06; current defaults in the GeneChip Operating Software are α1 = 0.05 and α2 = 0.065.
Illumina detection call algorithm
The Illumina gene expression platform is a bead-based microarray technology whereby for each gene interrogated, a 50 nt length oligo interrogating a specific gene is attached to a bead, and multiple beads (∼30) of the same type are randomly included on the array as a means to more precisely measure that gene’s expression [29]. For each hybridized BeadArray, the output from the Illumina GenomeStudio software includes for each beadtype a column labeled ‘Detection.Pval’ [30]. In calculating the Illumina detection P-value, let i index the hybridized BeadArrays (samples), g index beadtypes or genes, and big represent expression for beadtype g for the ith BeadArray. Illumina includes control features on each BeadArray, such as negative control beadtypes which are randomly permuted sequences known not to exist in the given organism’s genome. Let the N negative control beadtypes be represented by  , such that the mean of the negative control beadtypes for BeadArray i can be given by
Similarly, the standard deviation  of the negative control beadtypes for BeadArray i is calculated. Thereafter, a z-score is calculated for each gene on BeadArray i as
These g z-scores are then ranked using a specialized function
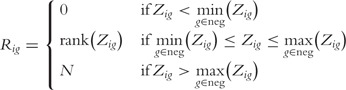 |
Thereafter, the detection call P-value for gene g on BeadArray i is given by
Although the Illumina BeadStudio and GenomeStudio software does not provide a qualitative detection call, it has been recommended that an alpha level such as 0.05 or 0.01 can be used for making Present/Absent calls [31].
METHODS
Affymetrix low level spike-in dataset
Previously, the detection call algorithm and its user-specified parameters were applied to a Latin Square experiment where genes were spiked in at concentrations of 0, 0.25, 0.5, 1, 2, 4, 8, 16, 32, 64, 128, 256, 512 and 1024 pM and hybridized to HG-U133A GeneChips. Here we examine the performance of the detection call algorithm on a low-level spike-in experiment using HG-U133 Plus 2.0 arrays. Twelve HG-U133 Plus 2.0 arrays were hybridized using a Latin Square design wherein 26 transcripts were spiked into a common background sample, derived from the human cell line HeLa (ATCC CCL-2), at known concentrations. Specifically, four different groups containing six to seven transcripts each were spiked into the background prior to hybridization where the concentrations were 0, 0.75, 1.5 or 3.0 pM. The concentrations for each group is provided in Table 1; the list of probe sets corresponding to the transcripts spiked into each group are provided in Supplementary Table S1. The dataset is available from NCBI’s Gene Expression Omnibus [32] accession number GSE17968 (http://www.ncbi.nlm.nih.gov/geo/query/acc.cgi?acc=GSE17968).
Table 1:
For the Affymetrix low-level spike-in dataset, the CEL file and concentration of spike (pM) for transcripts in each Spike group
| Spike group |
||||
|---|---|---|---|---|
| GeneChip | J | K | L | M |
| 3823p_P11a.cel | 0 | 0.75 | 1.5 | 3 |
| 3823p_P11b.cel | 0 | 0.75 | 1.5 | 3 |
| 3823p_P11c.cel | 0 | 0.75 | 1.5 | 3 |
| 3823p_P12a.cel | 3 | 0 | 0.75 | 1.5 |
| 3823p_P12b.cel | 3 | 0 | 0.75 | 1.5 |
| 3823p_P12c.cel | 3 | 0 | 0.75 | 1.5 |
| 3823p_P13a.cel | 1.5 | 3 | 0 | 0.75 |
| 3823p_P13b.cel | 1.5 | 3 | 0 | 0.75 |
| 3823p_P13c.cel | 1.5 | 3 | 0 | 0.75 |
| 3823p_P14a.cel | 0.75 | 1.5 | 3 | 0 |
| 3823p_P14b.cel | 0.75 | 1.5 | 3 | 0 |
| 3823p_P14c.cel | 0.75 | 1.5 | 3 | 0 |
The Affymetrix detection call algorithm was applied using the GCOS defaults of α1 = 0.05 and α2 = 0.065 and the detection calls for the probe sets listed in Supplementary Table S1 were extracted. The present/marginally present/absent call frequencies for each spike-in concentration was calculated. Moreover, because the distribution of P-values for the 0 spike-in concentration (the null condition) should follow a uniform distribution, a Kolmogorov-Smirnov test was performed to test the hypothesis that the P-value distribution for the 0 spike-in concentration was uniform.
Illumina spike-in dataset
A spike-in dataset from a previously published study was used to investigate methods for background estimation, bead-level summarization, and differential expression analysis for Illumina BeadArray data [33]. These data were subsequently used for identifying an appropriate variance-stabilizing transformation [34]. However, the investigators did not examine the sensitivity and specificity of the detection call P-values, so we have re-analyzed the Dunning spike-in dataset here. Briefly, transcripts corresponding to 33 beadtypes were spiked into the background sample and hybridized to Mouse-6 version BeadChips. All transcripts were spiked at the same concentration for any given BeadArray, with concentrations 0, 0.01, 0.03, 0.1, 0.3, 1, 3, 10, 30, 100, 300 and 1000 pM. The detection P-values from BeadStudio were provided as supplementary material in the original paper. To obtain a qualitative detection call, the Illumina recommended thresholds of α1 = 0.01 and α2 = 0.05 were applied to the Illumina detection P-values for declaring a beadtype as present, marginally present, or absent. According to statistical theory, under the conditions of the null hypothesis, that is, for the 0 pM spikes, the detection call P-values should follow a Uniform [0,1] distribution. Therefore, the Kolmogorov-Smirnov test was applied to the detection call P-values for the 0 pM spikes. Since Illumina does provide a qualitative detection call but merely suggests an alpha level, a classification tree was fit predicting 0 pM versus non-zero spike-in concentration using the detection call P-value as the sole independent variable, to identify the optimal cutpoint for making present/absent calls.
As a comparison to the algorithmic-based Illumina detection call method, we additionally applied a two-sample t-test comparing mean bead-level expression for each beadtype to the mean expression of the negative control bead-level data. Among the negative control beads outlier beads were defined as those having an intensity exceeding the median intensity + 3 × median absolute deviation and were removed from the detection call analysis. Again, letting i index the hybridized BeadArrays, g index beadtypes, k index the bead-level data within each beadtype such that bigk represents the bead-level expression for bead k within beadtype g for the ith BeadArray. For negative control beadtypes the bead-level expression is represented by  . For each beadtype g on BeadArrays i, a two-sample t-test was applied to statistically compare its mean bead-level expression
 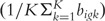 to the mean bead-level expression among the negative control beadtypes
  resulting in one P-value per beadtype (pig). Bead-level data can be analyzed using the beadarray package [35] in the R programming environment [36].
RESULTS
Affymetrix low level spike-in dataset
The frequencies and percent of detection calls for each spike-in concentration (Table 2) reveals that the Affymetrix algorithm had a 2.6–5.1% error rate for the 0, 1.5 and 3 pM concentrations and a 15.4% error rate for the 0.75 pM concentration, for an overall error rate of 6.73%. A classification tree predicting 0 versus non-zero spike concentration using the detection call P-values selected 0.08429 as the optimal P-value cutpoint for declaring a probe set present/absent. Application of this cutpoint for declaring the spike-in probe sets either present or absent resulted in a 4.1% error rate (Table 3). Boxplots of the detection call P-values by spike-in concentration revealed that the distribution of P-values for the null condition seem to depart from a uniform distribution (Figure 1). This was confirmed by application of the Kolmogorov-Smirnov test which resulted in a P = 0.0498, indicating the P-values were not uniformly distributed.
Table 2:
Frequency and percent of detection calls by spike-in concentration for the Affymetrix low level spike-in dataset
| Spike concentration | Absent | Marginally present | Present |
|---|---|---|---|
| 0 pM | 74 (94.9%) | 0 | 4 (5.1%) |
| 0.75 pM | 10 (12.8%) | 2 (2.6%) | 66 (84.6%) |
| 1.5 pM | 1 (1.3%) | 1 (1.3%) | 76 (97.4%) |
| 3 pM | 2 (2.6%) | 1 (1.3%) | 75 (96.2%) |
Table 3:
Results from decision rule applied to the detection call P-values
| Spike-in concentration |
||
|---|---|---|
| 0 pM | Non-zero concentration | |
| Absent | 71 | 6 |
| Present | 7 | 228 |
Figure 1:

Boxplots of detection call P-values by spike-in concentration for Affymetrix low level spike-in dataset. Dashed line represents α1 = 0.05 while the dotted line represents α2 = 0.065.
The sensitivity of the detection call result was investigated in a number of ways. First, we note that none of the probe-level intensities for any of the spiked-in probe sets were saturated and only 6 of the 3432 spiked-in probe pairs among the 12 GeneChips were discarded for the PM and MM being within τ of one another. Including these probe pairs and re-performing the Wilcoxon signed rank test resulted in slightly different P-values for these six probe sets but no change in the detection call, therefore, the filtering procedure did not affect the detection call results. Probes within a probe set are ordered by their probe interrogation position with the _at1 probe being most 5′ and the _at11 probe being the most 3′. Therefore, if the RNA was degraded, probe intensities are expected to vary systematically by probe interrogation position [37]. To investigate whether there was a dependence of Rij on probe position j, for each spiked-in probe set we plotted the Rij values against probe position j for all 12 GeneChips (data not shown, figures freely available upon request). We did not observe any dependence of Rij on j. Researchers recently identified that intensities of probes containing multiple runs of guanines were discordant with respect to intensities of neighboring probes within the same probe set [38], a finding that was subsequently empirically confirmed by an analysis of 6685 Affymetrix GeneChip CEL files [39]. Therefore, to investigate whether runs of guanine were associated with the Rij, for each probe sequence the maximum guanine run length was obtained. Among the probe sequences associated with the 26 spiked-in probe sets, there were 91, 127, 49, 12, 6 and 1 probe sequences having maximum guanine runs of length 1, 2, 3, 4, 5 and 6. No probe sequence had a guanine run greater than length 6. Thereafter, for each hybridized GeneChip the Rij’s for probes associated with the spiked-in probe sets were plotted against the maximum guanine run length (data not shown, figures freely available upon request). No association between Rij and maximum guanine run length was observed for these probe sets. Finally, we note that replicate hybridizations yielded consistent results (Supplementary Material, Figures 1-4).
Illumina spike-in dataset
The frequencies of detection calls for each spike-in concentration reveals that the Illumina algorithm had a 4.5% error rate for the 0 pM concentration when using α = 0.01 and a 7.6% error rate with using α = 0.05 (Table 4). However, 93.9, 92.4, 79.5 and 28.8% of transcripts spiked at 0.01, 0.03, 0.1 and 0.3 pM concentrations were declared Absent at the α = 0.01 level. These percents slightly decline when the α-level was adjusted to 0.05. Boxplots of the Illumina detection call P-values by spike-in concentration appear in Figure 2 (left panel). As seen in Table 4 and the left panel of Figure 2, none of the transcripts spiked in at 3 pM or greater were called absent and 2.3% of transcripts spiked in at 1 pM were called absent when using α = 0.05. Therefore, the Illumina detection call algorithm accompanied by the recommended qualitative thresholds performs well when the transcript is either truly absent or present at a concentration at 1–3 pM or greater. However, the assay had low sensitivity at the spike-in concentrations of 0.01, 0.03, 0.1 and 0.3 pM.
Table 4:
Using the Illumina detection method, frequency and percent of detection calls by spike-in concentration for the Illumina spike-in dataset using Illumina recommended thresholds of α = 0.01 and α = 0.05
| Spike concentration | α = 0.01 |
α = 0.05 |
||
|---|---|---|---|---|
| Absent | Present | Absent | Present | |
| 0 pM | 126 (95.5%) | 6 (4.5%) | 122 (92.4%) | 10 (7.6%) |
| 0.01 pM | 124 (93.9%) | 8 (6.1%) | 122 (92.4%) | 10 (7.6%) |
| 0.03 pM | 122 (92.4%) | 10 (7.6%) | 117 (88.6%) | 15 (11.4%) |
| 0.1 pM | 105 (79.5%) | 27 (20.5%) | 87 (65.9%) | 45 (34.1%) |
| 0.3 pM | 38 (28.8%) | 94 (71.2%) | 23 (17.4%) | 109 (82.6%) |
| 1 pM | 6 (4.5%) | 126 (95.5%) | 3 (2.3%) | 129 (97.7%) |
| 3 pM | 0 | 132 (100%) | 0 | 132 (100%) |
| 10 pM | 0 | 132 (100%) | 0 | 132 (100%) |
| 30 pM | 0 | 132 (100%) | 0 | 132 (100%) |
| 100 pM | 0 | 132 (100%) | 0 | 132 (100%) |
| 300 pM | 0 | 132 (100%) | 0 | 132 (100%) |
| 1000 pM | 0 | 132 (100%) | 0 | 132 (100%) |
Figure 2:

Left panel: Boxplots of Illumina BeadStudio detection call P-values by spike-in concentration for the Illumina spike-in dataset. Dashed line represents α = 0.01 while the dotted line represents α = 0.05. Right panel: Boxplots of P-values from two-sample t-test comparing mean bead-level expression to negative control expression by spike-in concentration for the Illumina spike-in dataset. Dashed line represents α = 0.01 while the dotted line represents α = 0.05.
When using the two-sample t-test and comparing mean bead-level expression for each beadtype to the mean bead-level expression among all negative control beadtypes, there were more transcripts called present for the 0 pM spiked transcripts compared to the Illumina Detection method, but fewer absent calls for non-zero spiked transcripts (Table 5). In fact, for the 0.1 pM concentration, half as many beadtypes were declared absent using the two sample t-test compared to using the default Illumina detection call methodology. Boxplots of the t-test P-values by spike-in concentration appear in Figure 2 (right panel). These detection call P-values were consistent among replicate hybridizations as well (Supplementary Material Figures 5–10). Again, as seen in Table 5 and the right panel of Figure 2 none of the transcripts spiked in at 3 pM or greater were called absent and 0.8% of transcripts spiked in at 1 pM were called absent when using α = 0.05. Therefore, both methods are able to identify transcripts spiked-in at high concentrations as present.
Table 5:
When comparing bead-level intensities for each beadtype to the bead-level intensities of negative control beadtypes using a two-sample t-test, frequency and percent of detection calls by spike-in concentration for the Illumina spike-in dataset using Illumina recommended thresholds of α = 0.01 and α = 0.05
| Spike concentration | α = 0.01 |
α = 0.05 |
||
|---|---|---|---|---|
| Absent | Present | Absent | Present | |
| 0 pM | 103 (78.0%) | 29 (22.0%) | 78 (59.1%) | 54 (40.9%) |
| 0.01 pM | 97 (73.5%) | 35 (26.5%) | 76 (57.6%) | 56 (42.4%) |
| 0.03 pM | 88 (66.7%) | 44 (33.3%) | 67 (50.8%) | 65 (49.2%) |
| 0.1 pM | 52 (39.4%) | 80 (60.6%) | 37 (28.0%) | 95 (72.0%) |
| 0.3 pM | 14 (10.6%) | 118 (89.4%) | 11 (8.3%) | 121 (91.7%) |
| 1 pM | 3 (2.3%) | 129 (97.7%) | 1 (0.8%) | 131 (99.2%) |
| 3 pM | 0 | 132 (100%) | 0 | 132 (100%) |
| 10 pM | 0 | 132 (100%) | 0 | 132 (100%) |
| 30 pM | 0 | 132 (100%) | 0 | 132 (100%) |
| 100 pM | 0 | 132 (100%) | 0 | 132 (100%) |
| 300 pM | 0 | 132 (100%) | 0 | 132 (100%) |
| 1000 pM | 0 | 132 (100%) | 0 | 132 (100%) |
CONCLUSION
In this article, we reviewed various uses of detection call results in microarray experiments. We also reviewed the detection call algorithms for two widely used commercial platforms, the Affymetrix GeneChip and Illumina BeadArray. We then applied the two detection call algorithms to two spike-in datasets for evaluating the performance of the default/recommended parameters. We conclude that the default settings are likely to work well in applications where genes of interest are expected to be present at 1 pM concentration or higher. Genes present in low abundance, such as some transcription factors, may be routinely labeled as absent when using the Illumina detection call algorithm since the assay had low sensitivity for the 0.01, 0.03, 0.1 and 0.3 pM spike-in concentrations. Since both platforms include user-adjustable parameters, particularly the α-level used in making a qualitative statement of whether a given transcript is present or absent, we recommend that the tuning parameters be adjusted depending upon whether the investigator wishes to filter out all transcripts truly absent, thereby potentially removing some low level transcripts that are truly present, versus retaining as many transcripts that may be present. Consideration of how to appropriately adjust the tuning parameters can be derived from application of supervised learning methods, such as classification trees, to detection call P-values in a low-level spike-in experiment.
Key Points.
The default parameters for qualitative detection calls yield few absent calls for high spike-in concentrations.
When genes of interest are expected to be present at very low concentrations, spike-in datasets can be useful for appropriately adjusting the tuning parameters for qualitative detection calls.
Alternative, statistically-based detection call methods such as a two-sample t-test comparing gene intensities to negative control intensities may result in improved performance compared to ad hoc detection call algorithms.
SUPPLEMENTARY DATA
Supplementary data are available online at http://bib.oxfordjournals.org/.
Acknowledgements
The authors would like to thank Suzanne Dee from Affymetrix for making the Affymetrix low level spike-in dataset available.
Biographies
Kellie J. Archer is an associate professor in the Departments of Biostatistics and Surgery at Virginia Commonwealth University. Her research interests include developing and applying statistical methods for analyzing high-throughput genomic data.
Sarah E. Reese is a graduate research assistant in the Department of Biostatistics at Virginia Commonwealth University. She is a Ph.D student with an interest in genomic biostatistics.
References
- Hubbell E, Liu WM, Mei R. Robust estimators for expression analysis. Bioinformatics. 2002;18:1585–1592. doi: 10.1093/bioinformatics/18.12.1585. [DOI] [PubMed] [Google Scholar]
- Irizarry RA, Hobbs B, Collin F, et al. Exploration, normalization, and summaries of high density oligonucleotide array probe level data. Biostatistics. 2003;4:249–264. doi: 10.1093/biostatistics/4.2.249. [DOI] [PubMed] [Google Scholar]
- Wu Z, Irizarry RA, Gentleman R, et al. A model-based background adjustment for oligonucleotide expression arrays. J Am Stat Assoc. 2004;99:909–917. [Google Scholar]
- Li C, Wong WH. Model-based analysis of oligonucleotide arrays: model validation, design issues and standard error applications. Genome Biol. 2001;2:1–11. doi: 10.1186/gb-2001-2-8-research0032. [DOI] [PMC free article] [PubMed] [Google Scholar]
- Shi L, Reid LH, Jones WD, et al. The MicroArray Quality Control (MAQC) project shows inter- and intraplatform reproducibility of gene expression measurements. Nat Biotechnol. 2006;24:1151–1161. doi: 10.1038/nbt1239. [DOI] [PMC free article] [PubMed] [Google Scholar]
- Hackstadt AJ, Hess AM. Filtering for increased power for microarray data analysis. BMC Bioinformatics. 2009;10:11. doi: 10.1186/1471-2105-10-11. [DOI] [PMC free article] [PubMed] [Google Scholar]
- Pepper SD, Saunders EK, Edwards LE, et al. The utility of MAS5 expression summary and detection call algorithms. BMC Bioinformatics. 2007;8:273. doi: 10.1186/1471-2105-8-273. [DOI] [PMC free article] [PubMed] [Google Scholar]
- McClintick JN, Edenberg HJ. Effects of filtering by Present call on analysis of microarray experiments. BMC Bioinformatics. 2006;7:49. doi: 10.1186/1471-2105-7-49. [DOI] [PMC free article] [PubMed] [Google Scholar]
- Ryan CA, Gildea LA, Hulette BC, et al. Gene expression changes in peripheral blood-derived dendritic cells following exposure to a contact allergen. Toxicol Lett. 2004;150:301–316. doi: 10.1016/j.toxlet.2004.02.002. [DOI] [PubMed] [Google Scholar]
- McClintick JN, Jerome RE, Nicholson CR, et al. Reproducibility of oligonucleotide arrays using small samples. BMC Genomics. 2003;4:4. doi: 10.1186/1471-2164-4-4. [DOI] [PMC free article] [PubMed] [Google Scholar]
- Aston C, Jiang L, Sokolov BP. Transcriptional profiling reveals evidence for signaling and oligodendroglial abnormalities in the temporal cortex from patients with major depressive disorder. Mol Psychiatry. 2005;10:309–322. doi: 10.1038/sj.mp.4001565. [DOI] [PubMed] [Google Scholar]
- Shippy R, Sendera TJ, Lockner R, et al. Performance evaluation of commercial short-oligonucleotide microarrays and the impact of noise in making cross-platform correlations. BMC Genomics. 2004;5:61. doi: 10.1186/1471-2164-5-61. [DOI] [PMC free article] [PubMed] [Google Scholar]
- Singh R, Maganti RJ, Jabba SV, et al. Microarray-based comparison of three amplification methods for nanogram amounts of total RNA. Am J Physiol Cell Physiol. 2005;288:C1179–1189. doi: 10.1152/ajpcell.00258.2004. [DOI] [PMC free article] [PubMed] [Google Scholar]
- Dumur CI, Nasim S, Best AM, et al. Evaluation of quality-control criteria for microarray gene expression analysis. Clin Chem. 2004;50:1994–2002. doi: 10.1373/clinchem.2004.033225. [DOI] [PubMed] [Google Scholar]
- Mas VR, Archer KJ, Yanek K, et al. Gene expression patterns in deceased donor kidneys developing delayed graft function after kidney transplantation. Transplantation. 2008;85:626–635. doi: 10.1097/TP.0b013e318165491f. [DOI] [PubMed] [Google Scholar]
- Archer KJ, Mas VR, O'B;rien TR, et al. Quality assessment of microarray data in a multicenter study. Diagn Mol Pathol. 2009;18:34–43. doi: 10.1097/PDM.0b013e3181731e14. [DOI] [PMC free article] [PubMed] [Google Scholar]
- Weis S, Llenos IC, Dulay JR, et al. Quality control for microarray analysis of human brain samples: The impact of postmortem factors, RNA characteristics, and histopathology. J Neurosci Methods. 2007;165:198–209. doi: 10.1016/j.jneumeth.2007.06.001. [DOI] [PubMed] [Google Scholar]
- Hoshida Y, Villanueva A, Kobayashi M, et al. Gene expression in fixed tissues and outcome in hepatocellular carcinoma. N Engl J Med. 2008;359:1995–2004. doi: 10.1056/NEJMoa0804525. [DOI] [PMC free article] [PubMed] [Google Scholar]
- Mah N, Thelin A, Lu T, et al. A comparison of oligonucleotide and cDNA-based microarray systems. Physiol Genomics. 2004;16:361–370. doi: 10.1152/physiolgenomics.00080.2003. [DOI] [PubMed] [Google Scholar]
- Mahadevappa M, Warrington JA. A high-density probe array sample preparation method using 10- to 100-fold fewer cells. Nat Biotechnol. 1999;17:1134–1136. doi: 10.1038/15124. [DOI] [PubMed] [Google Scholar]
- Seo J, Bakay M, Chen YW, et al. Interactively optimizing signal-to-noise ratios in expression profiling: project-specific algorithm selection and detection p-value weighting in Affymetrix microarrays. Bioinformatics. 2004;20:2534–2544. doi: 10.1093/bioinformatics/bth280. [DOI] [PubMed] [Google Scholar]
- Stossi F, Barnett DH, Frasor J, et al. Transcriptional profiling of estrogen-regulated gene expression via estrogen receptor (ER) alpha or ERbeta in human osteosarcoma cells: distinct and common target genes for these receptors. Endocrinology. 2004;145:3473–3486. doi: 10.1210/en.2003-1682. [DOI] [PubMed] [Google Scholar]
- Frasor J, Stossi F, Danes JM, et al. Selective estrogen receptor modulators: discrimination of agonistic versus antagonistic activities by gene expression profiling in breast cancer cells. Cancer Res. 2004;64:1522–1533. doi: 10.1158/0008-5472.can-03-3326. [DOI] [PubMed] [Google Scholar]
- Reme T, Hose D, De Vos J, et al. A new method for class prediction based on signed-rank algorithms applied to Affymetrix microarray experiments. BMC Bioinformatics. 2008;9:16. doi: 10.1186/1471-2105-9-16. [DOI] [PMC free article] [PubMed] [Google Scholar]
- Lockhart DJ, Dong H, Byrne MC, et al. Expression monitoring by hybridization to high-density oligonucleotide arrays. Nat Biotechnol. 1996;14:1675–1680. doi: 10.1038/nbt1296-1675. [DOI] [PubMed] [Google Scholar]
- Schadt EE, Li C, Su C, et al. Analyzing high-density oligonucleotide gene expression array data. J Cell Biochem. 2000;80:192–202. [PubMed] [Google Scholar]
- Schadt EE, Li C, Ellis B, et al. Feature extraction and normalization algorithms for high-density oligonucleotide gene expression array data. J Cell Biochem Suppl. 2001;(Suppl 37):120–125. doi: 10.1002/jcb.10073. [DOI] [PubMed] [Google Scholar]
- Liu WM, Mei R, Di X, et al. Analysis of high density expression microarrays with signed-rank call algorithms. Bioinformatics. 2002;18:1593–1599. doi: 10.1093/bioinformatics/18.12.1593. [DOI] [PubMed] [Google Scholar]
- Kuhn K, Baker SC, Chudin E, et al. A novel, high-performance random array platform for quantitative gene expression profiling. Genome Res. 2004;14:2347–2356. doi: 10.1101/gr.2739104. [DOI] [PMC free article] [PubMed] [Google Scholar]
- [(date last accessed 19 February 2009)]. Illumina. BeadStudio Gene Expression Module v3.4 User Guide. http://www.illumina.com/downloads/ BeadStudio_Gene_Expression_Module_v3.4_User_Guide_11317265_RevA.pdf. [Google Scholar]
- [(date last accessed 19 February 2009)]. Illumina. Gene Expression Microarray Data Quality Control. http://www.illumina.com/downloads/GX_QualityControl_TechNote.pdf. [Google Scholar]
- Edgar R, Domrachev M, Lash AE. Gene Expression Omnibus: NCBI gene expression and hybridization array data repository. Nucleic Acids Res. 2002;30:207–210. doi: 10.1093/nar/30.1.207. [DOI] [PMC free article] [PubMed] [Google Scholar]
- Dunning MJ, Barbosa-Morais NL, Lynch AG, et al. Statistical issues in the analysis of Illumina data. BMC Bioinformatics. 2008;9:85. doi: 10.1186/1471-2105-9-85. [DOI] [PMC free article] [PubMed] [Google Scholar]
- Dunning MJ, Ritchie ME, Barbosa-Morais NL, et al. Spike-in validation of an Illumina-specific variance-stabilizing transformation. BMC Res Notes. 2008;1:18. doi: 10.1186/1756-0500-1-18. [DOI] [PMC free article] [PubMed] [Google Scholar]
- Dunning MJ, Smith ML, Ritchie ME, et al. beadarray: R classes and methods for Illumina bead-based data. Bioinformatics. 2007;23:2183–2184. doi: 10.1093/bioinformatics/btm311. [DOI] [PubMed] [Google Scholar]
- Vienna, Austria: R Foundation for Statistical Computing; 2008. R Development Core Team. R: A Language and Environment for Statistical Computing. [Google Scholar]
- Gautier L, Cope L, Bolstad BM, et al. affy—analysis of Affymetrix GeneChip data at the probe level. Bioinformatics. 2004;20:307–315. doi: 10.1093/bioinformatics/btg405. [DOI] [PubMed] [Google Scholar]
- Wu C, Zhao H, Baggerly K, et al. Short oligonucleotide probes containing G-stacks display abnormal binding affinity on Affymetrix microarrays. Bioinformatics. 2007;23:2566–2572. doi: 10.1093/bioinformatics/btm271. [DOI] [PubMed] [Google Scholar]
- Upton GJ, Langdon WB, Harrison AP. G-spots cause incorrect expression measurement in Affymetrix microarrays. BMC Genomics. 2008;9:613. doi: 10.1186/1471-2164-9-613. [DOI] [PMC free article] [PubMed] [Google Scholar]
Associated Data
This section collects any data citations, data availability statements, or supplementary materials included in this article.