Abstract
Background
Obesity increases the risk of cancer death among postmenopausal women with estrogen receptor–positive (ER+) breast cancer, but the direct evidence for the mechanisms is lacking. The purpose of this study is to demonstrate direct evidence for the mechanisms mediating this epidemiologic phenomenon.
Methods
We analyzed transcriptomic profiles of pretreatment biopsies from a prospective cohort of 137 ER+ breast cancer patients. We generated transgenic (MMTV-TGFα;A y /a) and orthotopic/syngeneic (A y /a) obese mouse models to investigate the effect of obesity on tumorigenesis and tumor progression and to determine biological mechanisms using whole-genome transcriptome microarrays and protein analyses. We used a coculture system to examine the impact of adipocytes/adipokines on breast cancer cell proliferation. All statistical tests were two-sided.
Results
Functional transcriptomic analysis of patients revealed the association of obesity with 59 biological functional changes (P < .05) linked to cancer hallmarks. Gene enrichment analysis revealed enrichment of AKT-target genes (P = .04) and epithelial–mesenchymal transition genes (P = .03) in patients. Our obese mouse models demonstrated activation of the AKT/mTOR pathway in obesity-accelerated mammary tumor growth (3.7- to 7.0-fold; P < .001; n = 6–7 mice per group). Metformin or everolimus can suppress obesity-induced secretion of adipokines and breast tumor formation and growth (0.5-fold, P = .04; 0.3-fold, P < .001, respectively; n = 6–8 mice per group). The coculture model revealed that adipocyte-secreted adipokines (eg, TIMP-1) regulate adipocyte-induced breast cancer cell proliferation and invasion. Metformin suppress adipocyte-induced cell proliferation and adipocyte-secreted adipokines in vitro.
Conclusions
Adipokine secretion and AKT/mTOR activation play important roles in obesity-accelerated breast cancer aggressiveness in addition to hyperinsulinemia, estrogen signaling, and inflammation. Metformin and everolimus have potential for therapeutic interventions of ER+ breast cancer patients with obesity.
The prevalence of obesity is increasing at an alarming rate and has reached pandemic proportions. Substantial epidemiological evidence suggests that female breast cancer (BC) patients who are obese at diagnosis have a worse prognosis than nonobese patients (1–6). A meta-analysis of 43 studies that examined the association between obesity at diagnosis and BC outcome calculated that obese patients were 33% more likely to die of BC than nonobese patients were (6). Possible mechanisms for a direct link between obesity and BC include hyperinsulinemia, estrogen signaling, adipokines expression (eg, adiponectin, leptin), and inflammation (7,8). Nonetheless, direct evidence for these mechanisms in humans is lacking. We provide the obesity-induced functional transcriptomic changes in both human and mouse BCs in the context of their contributions to specific hallmarks of cancer (9). We report direct evidence regarding the BC-promoting impact of obesity and the biological functions and signaling mechanisms involved in patients and obese in vivo models.
Methods
Patient Samples
The patients, methodology of tumor fine-needle aspiration biopsy, RNA purification, microarray hybridization, and generation of gene-expression profiles (public Gene Expression Omnibus dataset GSE-20194) were described previously (10–12). Additional data were retrieved from medical records under a protocol approved by the institutional review board in compliance with Health Insurance Portability and Accountability Act regulations. One hundred thirty-seven estrogen receptor–positive (ER+) BC patients with available body mass index (BMI) information were classified as nonobese (BMI < 30kg/m2; n = 94 patients) and obese (BMI ≥ 30kg/m2; n = 43 patients). No patient was excluded based on research-based prediction analysis of microarray 50 (PAM50) subtype predictor. Patients provided written informed consent to obtain tumor biopsy for genomic studies (institutional review board protocol LAB99-402, USO-02-103, 2003-0321, I-SPY-1) (10–12).
Cell Culture
MCF7, T47D, and 3T3-L1 cells were obtained from American Type Culture Collection (Manassas, VA). The mouse mammary tumor EO771 cells (C57BL6 genetic background) (13) were kindly provided by Dr Xiaohong Leng (MD Anderson Cancer Center, Houston, TX). Cell culture conditions, differentiation of 3T3-L1 into adipocytes, and in vitro cell culture experiments are described in the Supplementary Methods (available online). Cell viability was determined by MTT (3-(4,5-dimethylthiazol-2-yl)-5-(3-carboxymethoxyphenyl)-2-(4-sulfophenyl)-2H-tetrazolium) assay, as described previously (14). Each treatment set was made in at least three separate independent cell population (n = 3) to allow for statistical evaluation and repeated at least twice to ensure reproducibility.
Animal Models
Generation of MMTV-TGFα;A y /a mouse model of ER+ BC and obesity is described in the Supplementary Methods (available online). Body fat percentage was determined as described in the Supplementary Methods (available online). Oral glucose tolerance test and insulin tolerance test were performed as previously described (15). Mice were killed, and tumors (one-third) were collected for total RNA extraction by TRIzol (Invitrogen, Grand Island, NY) as previously described (16). Total RNA samples were sent to the Genomics Core Facility at The University of Texas MD Anderson Cancer Center for gene expression analysis using the platform array Illumina MouseWG-6_V2_0_R3 (Illumina, San Diego, CA).
Orthotopic/syngeneic allografting experiments were performed by injecting EO771-FG12 cells in Matrigel (BD Bioscience, San Jose CA) into the left fourth mammary fat pad. Generation of EO771-FG12 cells and in vivo imaging are described in the Supplementary Methods (available online). All animal experiments were conducted in accordance with American Association for Laboratory Animal Science regulations and the approval of The University of Texas MD Anderson Cancer Center Institutional Animal Care & Use Committee.
Transcriptomic and Bioinformatics Analyses
Microarray data were analyzed using Nexus Expression 3 (BioDiscovery, Hawthorne, CA). Downstream effects functional analysis was completed using Ingenuity Pathway Analysis (Ingenuity Systems, www.igenuity.com) software, which uses the Ingenuity Knowledge Base to analyze transcriptomic dataset and identify the expected functions (eg, biological processes and disease or toxicological functions) that are increased or decreased (P < .01) because of the observed changes in gene expression (http://ingenuity.force.com/ipa/articles/ Feature_Description/Accessing-and-Using-Functional-Analysis). The width of the links and the relationship of the biological processes with cancer hallmarks were determined using the Z scores and illustrated in a Circos plot (9,17). See the Supplementary Methods (available online) for more details.
Immunohistochemistry
Tumors were fixed with 10% buffered formalin, paraffin embedded, and sectioned. Sections were stained with hematoxylin and eosin or Ki67 for pathological evaluation as previously described (18).
Protein Analysis
All protein analyses were performed using lysates from whole-cell pellets or mouse tumor samples in radioimmunoprecipitation assay buffer as previously described (19). Protein samples were used for multiplex immunosorbent assay and western blot analysis as described in the Supplementary Methods (available online). Serum samples were collected from fasted mice. Serum insulin, insulin-like growth factor 1 (IGF-1), and estradiol levels were measured and compared using enzyme-linked immunosorbent assay kits (R&D Systems, Minneapolis, MN). Adipokines expression was measured using the Proteome Profiler mouse adipokine array (R&D Systems).
Statistical Analysis
Survival distributions were estimated by the Kaplan–Meier method. Gehan–Breslow test was also used for survival comparisons because of little early censoring among the patients. For survival comparisons of mice, the log-rank test was used because no censoring occurred. Multivariable analyses were performed using Cox regression modeling. The assumption of proportionality was verified by the likelihood ratio test and the global χ2 test. For the mouse studies, breast tumor–specific deaths were the primary endpoints and deaths due to other causes (eg, fighting, excessive cystic skin lesions, and killed for inability to roll over or obtain food and water because of excessive obesity) were the competing risks events. Fine–Gray competing risk analysis was performed using R software (version 2.13.00; R Foundation for Statistical Computing, Vienna, Austria). Cumulative incidence was analyzed and plotted.
Statistical differences were assessed by two-tailed t test or 1-way analysis of variance with post hoc multiple comparisons (Holm–Sidak method) when appropriate. All other statistical analyses were performed using SigmaPlot (version 12.3; Systat, San Jose, CA) or SPSS (PC version 18; IBM SPSS, Armonk, New York) software. All error bars represent 95% confidence intervals (CIs). All results were considered statistically significant when P was less than .05 when calculated with the appropriate statistical test. All statistical tests were two-sided.
Results
Effects of Obesity on Tumor Functional Transcriptomic Profile in a Prospective Cohort of BC Patients
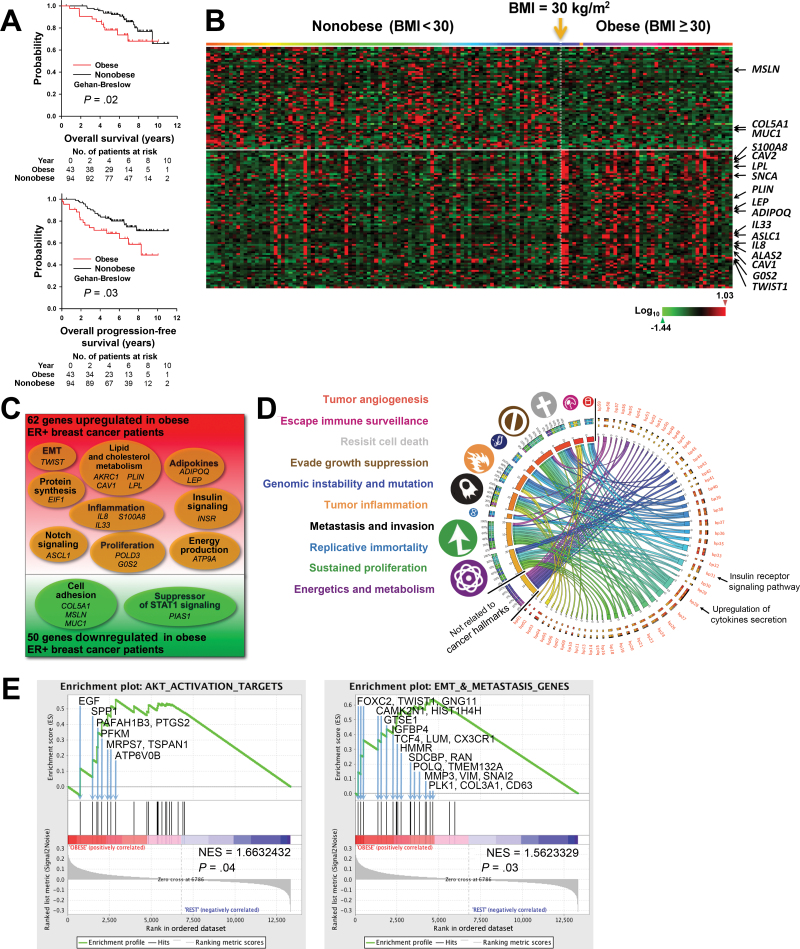
To examine the impact of obesity on gene expression in ER+ BC, we identified and reviewed the medical records of 137 patients in a prospective cohort of ER+ BC patients (Supplementary Table 1, available online). Kaplan–Meier analysis showed that obese patients had decreased overall survival (P = .02) and progression-free survival (P = .03) compared with nonobese patients (Figure 1A). A multivariable Cox regression model showed that obesity was a statistically significant predictor of progression-free survival (hazard ratio = 1.95; 95% CI = 1.02 to 3.75; P = .04) (Supplementary Table 2, available online). Therefore, this particular cohort is representative of ER+ BC patients that exhibit the association of obesity with decreased survival.
Figure 1.
Transcriptomic changes and adverse clinical outcomes associated with obesity in a prospective cohort of estrogen receptor–positive (ER+) breast cancer (BC) patients. A) Kaplan–Meier analysis of the overall survival (left panel) and progression-free survival (right panel) of untreated ER+ BC patients in Gene Expression Omnibus dataset GSE-20194 who were obese (body mass index [BMI] ≥ 30.0kg/m2; red; n = 43) or nonobese (BMI < 30kg/m2; black; n = 94). Gehan–Breslow test was used to calculate the P values. B) Heat map of the 130 gene probes with statistically significant changed expression (P ≤ .01; log ratio > 0.1) appearing in the same order as in Supplementary Table 3 (available online). Patients were arranged in ascending order of BMI from left to right. BMI of 30kg/m2 is indicated by the yellow arrow. C) Venn diagram of microarray data of pretreatment tumor biopsies, which identified 112 genes with statistically significantly changed expression (P ≤ .01; log ratio > 0.1) between obese and nonobese patients. D) Circos plot of the connections of statistically significantly changed biological processes (bp01 to bp50; P<.05) (see also Supplementary Table 4, available online) to cancer hallmarks (symbols and color-coded labels at left). The widths of the connectors represent the absolute values of the biological process Z scores. E) Gene set enrichment analyses (GSEAs) for AKT activation target genes (left panel) and genes involve in the epithelial–mesenchymal transition (EMT) and metastasis (right panel). Each bar corresponds to one gene. GSEA results with gene symbol, gene name, and gene enrichment scores of all genes included in each gene set are listed in Supplementary Table 5 and Supplementary Table 8 (available online).
Transcriptomic analysis of breast tumor biopsy from this patient cohort showed that obese patients had statistically significantly increased expression of 62 genes and statistically significantly decreased expression of 50 genes (P < .01) (Figure 1, B and C; Supplementary Table 3, available online). Functional transcriptomic analysis identified 59 biological processes that were statistically significantly different (P < .05) between the obese and nonobese groups (Supplementary Table 4, available online). The relationships among these biological processes and cancer hallmarks were visualized in a Circos plot (9,17) (Figure 1D). These data provide direct evidence that insulin signaling and inflammation are mechanisms that mediate the effect of obesity on human ER+ BC. A more specific transcriptomic analysis, gene set enrichment analysis (20), showed statistically significant upregulation of protein kinase B (AKT) target genes (P = .04), genes involved in the glucose metabolism (P = .02), genes involved in the generation of precursors of metabolites and energy (P < .001), and genes involved in the epithelial–mesenchymal transition and metastasis (P = .03) (Figure 1E; Supplementary Figure 1 and Supplementary Tables 5–8, available online).
Role of Obesity in Oncogene-Driven Breast Carcinogenesis and Tumor Progression
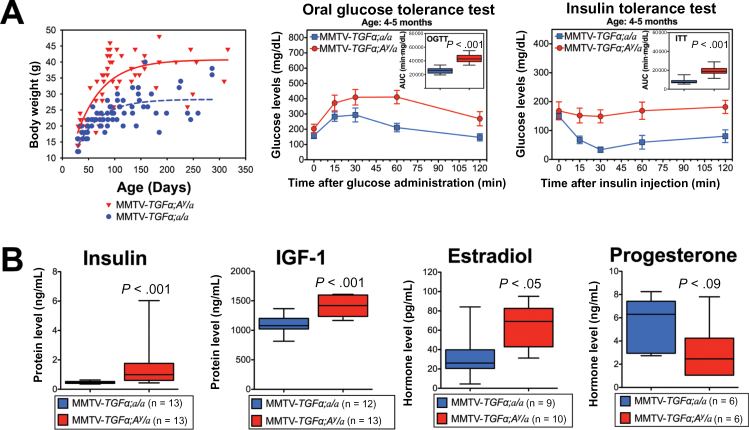
To gather evidence for a causal relationship between obesity and accelerated carcinogenesis and subsequent cancer progression, we generated the oncogene-induced BC obese mouse model MMTV-TGFα;A y /a. Compared with the lean littermates (MMTV-TGFα;a/a), this obese mouse model recapitulates the human obesity-induced phenotype and endocrine profile with higher body fat, glucose intolerance (P < .001), and insulin resistance (P < .001) (Figure 2A; Supplementary Figure 2, available online), as well as statistically significantly higher mean circulating serum levels of fasting insulin (1.727 vs 0.472ng/mL; P < .001), IGF-1 (1416.1 vs 1108.9ng/mL; P < .001) and estradiol (65.23 vs 40.32 pg/mL; P = .049) (Figure 2B).
Figure 2.
MMTV-TGFα:A y /a obese mice: a genetic mouse model of obesity and breast cancer (BC). A) Plotted body weight of MMTV-TGFα;A y /a obese mice (red) and MMTV-TGFα;a/a lean mice (blue) (left panel), oral glucose tolerance test results (middle panel; n = 11 mice per group), and insulin tolerance test results (right panel; n = 13 mice per group). Statistical significance was calculated by two-tailed t test of the area under the curves from the two groups of mice. B) Box plots of hormone levels for obese mice (red) and lean mice (blue). Error bars in all panels represent 95% confidence intervals. Statistically comparisons were performed using two-tailed t test.
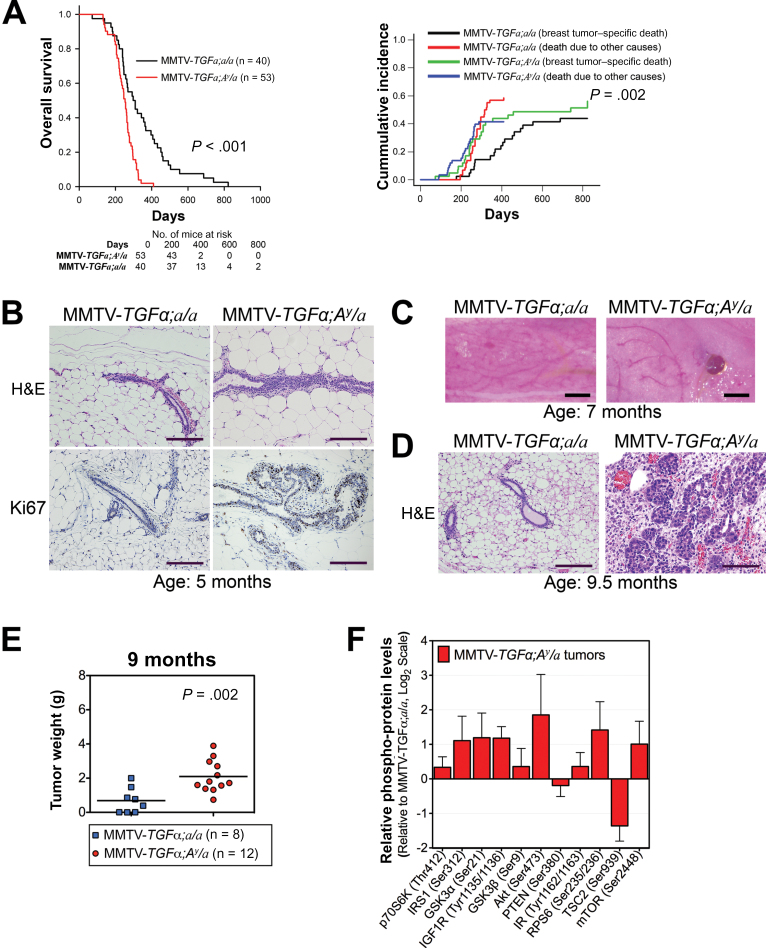
These transgenic obese mice had a statistically significantly shorter median overall survival (277 vs 451 days; P < .001 by log-rank test) and higher breast tumor–specific death cumulative incidence based on Fine–Gray competing risk analysis (P = .002) (Figure 3A) (21). A cross-sectional comparison at the age of 5 months showed that the mammary fat pads of obese mice had ductal hyperplasia and increased proliferation of mammary ductal epithelium, whereas those of lean mice were morphologically normal (Figure 3B). At the age of 7 months, whole mounts of mammary glands revealed visible tumors in obese mice, whereas the lean mice had none (Figure 3C). At 9.5 months, obese mice showed adenocarcinoma, as compared with normal mammary tissue from their lean littermates (Figure 3D). Gross pathology of mice at the age of 9 months revealed bigger breast lesions and increased solid breast tumor growth in obese mice than in lean mice (P = .002) (Figure 3E). Multiplex protein profiling showed increased phospho-protein levels of the AKT/mammalian target of rapamycin (mTOR) signaling members in tumors from obese mice compared with tumors from lean mice (Figure 3F). We also found that the mRNA level of the tripartite motif-containing protein 72 (Trim72, also MG53), which is an E3 ubiquitin ligase that promotes the degradation of the insulin receptor and insulin receptor substrate 1 (22, 23), is decreased in tumor tissues from the obese mice (Supplementary Figure 3, available online). This result shows congruence with the observed steady level of insulin receptor and insulin receptor substrate 1 and increased activation of the AKT/mTOR signaling in these tumors. In contrast, the mRNA level of Traf6, which is an E3 ubiquitin ligase that promotes the activation of AKT (24), is increased in these tumors from obese mice. Moreover, AKT target genes are induced in tumor tissue from obese mice, confirming downstream activation of the AKT/mTOR signaling pathway (Supplementary Figure 3, available online).
Figure 3.
Effect of obesity on oncogene-driven breast carcinogenesis and tumor progression in mice. A) Kaplan–Meier analysis of overall survival (left panel) and Fine–Gray competing risk analysis of breast tumor–specific death (right panel). Two-sided log-rank test (left panel) and Fine–Gray competing risk analysis (right panel) were used to calculate the P values. B) Representative hematoxylin and eosin (H&E)–stained slides (top panels) and Ki67 immunohistochemical analysis (bottom panels) of mammary ductal epithelium. Images were captured at ×10 magnification, and scale bars represent 200 µm. C) Representative pictures of fourth mammary fat pads illustrating a difference in tumor formation. Scale bars represent 1mm. D) Representative hematoxylin and eosin–stained slides of mouse mammary tissue. Images were captured at ×10 magnification, and scale bars represent 200 µm. E) Tumor weights of obese mice (blue) and lean mice (red) killed at the age of 9 months in the cross-sectional study. Statistical significance was calculated by two-tailed t test. F) Phospho-protein levels of members of the AKT/mTOR signaling pathway from tumor lysates of MMTV-TGFα;A y /a obese mice (n = 7) plotted relative to those from MMTV-TGFα;a/a lean mice (n = 5). Error bars in panel (F) and Supplementary Figure 3 represent 95% confidence intervals.
Effects of Obesity on Tumor Functional Transcriptomic Profile in BC Transgenic Obese Mouse Model
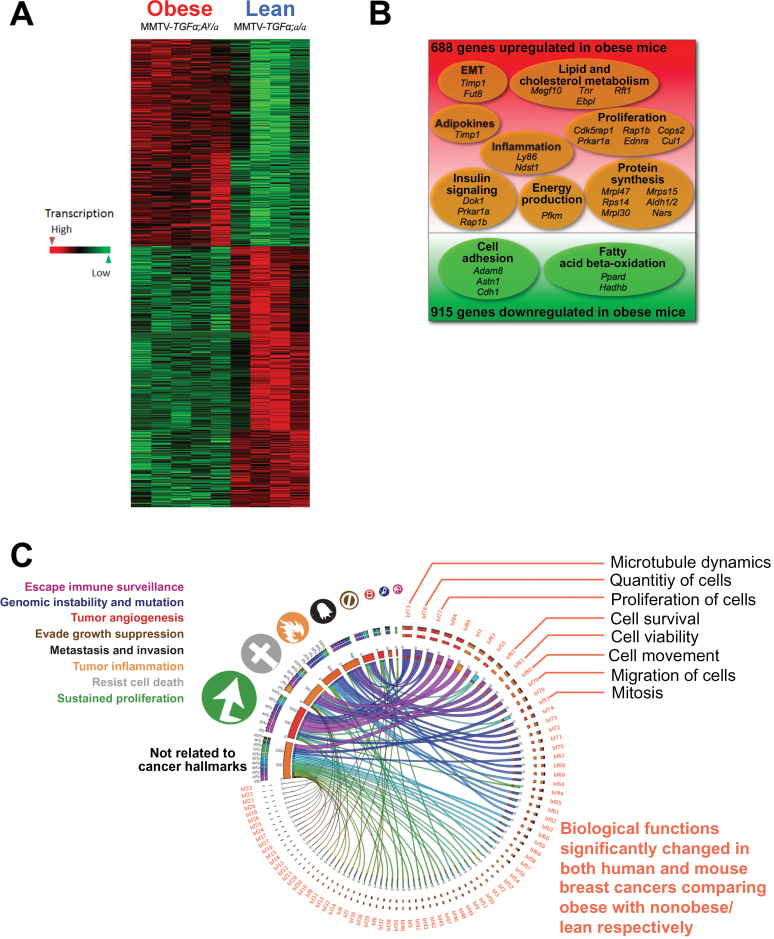
Transcriptomic analysis showed that, compared with those from MMTV-TGFα;a/a lean mice, breast tumors from MMTV-TGFα;A y /a obese mice had statistically significantly increased expression of 688 genes and statistically significantly decreased expression of 915 genes (P ≤ .01) (Figure 4, A and B; Supplementary Table 9, available online). Functional transcriptomic analysis identified 42 biological processes that were statistically significantly different (P < .01) between the obese and nonobese mice (Supplementary Table 10, available online). Based on the downstream effects analysis by the Ingenuity Pathway Analysis software, we identified 85 biological functions (P < .01) in both humans and mice (Supplementary Table 11, available online). Many of these functions concordantly affected by obesity in humans and mice were linked to hallmarks of cancer, as illustrated with a Circos plot (Figure 4C) (9,17). These transcriptomic analyses suggest that obesity promotes functions associated primarily with metastasis and invasion, tumor-promoting inflammation, resistance to cell death and, above all, sustained proliferation in ER+ BC of both humans and mice.
Figure 4.
Transcriptomic changes associated with obesity by comparing breast cancers (BCs) from obese and lean mice, and comparison of overall transcriptomic landscape with that of human estrogen receptor–positive (ER+) BCs. A) Heat map of differentially expressed genes in BCs showed clear clustering with sharp differences between MMTV-TGFα;A y /a obese mice (n = 5) and MMTV-TGFα;a/a lean mice (n = 5). B) Venn diagram of microarray data of transgenic mouse tumors identified 1603 genes with statistically significantly changed expression (n = 5 mice per group). C) Circos plot (http://mkweb.bcgsc.ca/tableviewer) of the relationships among biological functions (bf01 to bf85; Supplementary Table 7, available online) affected by obesity in both humans and mice and cancer hallmarks. The width of each link represents the average of the absolute values of the Z scores for humans and mice. Obesity promoted functions associated with sustained proliferation, resistance to cell death, tumor-promoting inflammation, metastasis and invasion, and so on in ER+ BCs of both humans (obese: n = 43; nonobese: n = 94) and mice (n = 5 mice per group).
Bioinformatic analysis of the direct and indirect interactions of estrogen, insulin, and adipokines revealed a complex web of cross-talk graphically presented as a Hive plot (Supplementary Figure 4, available online) (25). Comparison of this network with the upstream regulators in the human transcriptomic provided strong evidence for the involvement of signaling by estrogen, insulin, IGF-1, and adipokines (eg, vascular endothelial growth factor A, tumor necrosis factor alpha, interleukin 6, oncostatin-M, chemokine ligand 5, leptin, LIF, C-reactive protein, adiponectin, and interleukin 10) in mediating the influence of obesity on patients with ER+ BC. A network was also constructed linking the upstream regulatory network to 10 genes associated with each cancer hallmark in humans (Supplementary Figure 5, available online) and in mice (Supplementary Figure 6, available online). Overlay of the human ER+ BC transcriptomic data and mouse transcriptomic data showed upregulation of some cancer hallmarks. The relative expression levels suggested that estrogen signaling and leptin signaling play major roles in both humans and mice and that IGF-2, CCL2 (MCP-1), and tissue inhibitor of metalloproteinase 1 (TIMP-1) signaling have important roles in mouse tumor growth.
Role of Obesity on ER+ BC Tumor Growth and the Effects of Metformin or Everolimus on Obesity-Induced Changes
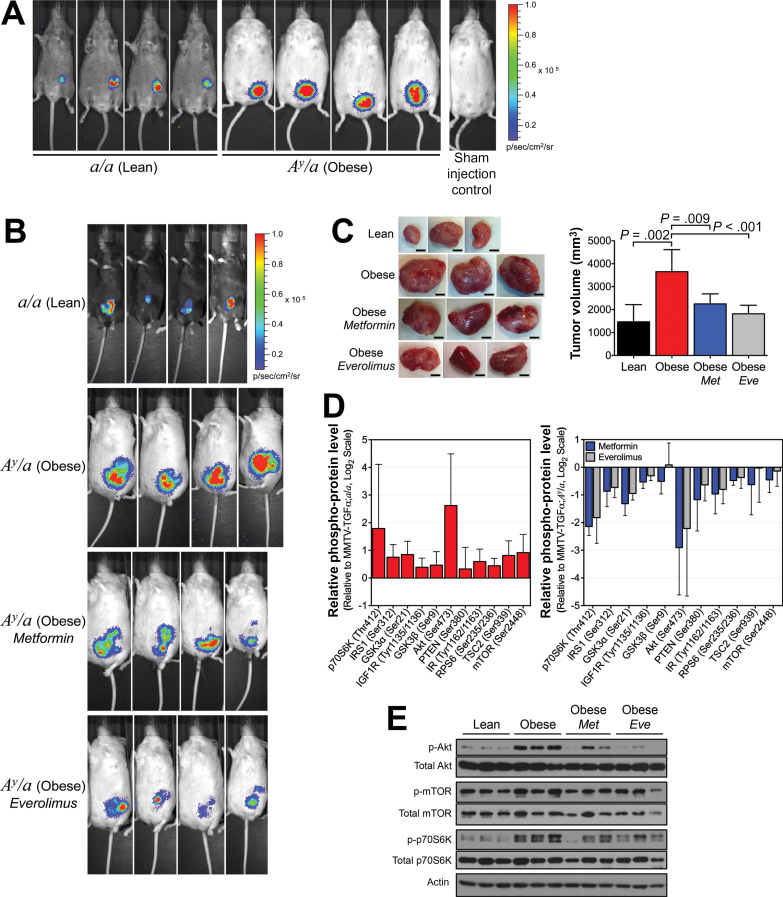
To further investigate whether obesity could accelerate cancer progression and the role of AKT/mTOR on this effect, we used the orthotopic/syngeneic allograft model using in vivo bioluminescent imaging of tumors after injection of syngeneic EO771-FG12 BC cells. Our results support that obesity accelerates tumor growth 3.7- to 7.0-fold (P < .001) (Figure 5, A and B; Supplementary Figure 7, available online) and increases tumor volume 2.5-fold (P = .002) (Figure 5C) of ER+ BC. Inhibition of the AKT downstream effector mTOR by everolimus or treatment with metformin statistically significantly reduced this obesity-induced tumor growth (0.3-fold with P < .001 or 0.5-fold with P = .04) (Figure 5B; Supplementary Figure 7, available online) and decreased obesity-induced increase in tumor volume (0.5-fold with P<.001 or 0.6-fold with P = .009) (Figure 5C). Tumors from these obese mice showed increased activation of the AKT/mTOR signaling members, whereas treatment with metformin or everolimus showed decreased activation (Figure 5, D and E). Thus, obesity-induced tumor growth is dependent on the AKT/mTOR signaling, and metformin and everolimus may be treatment alternatives for BC patients with obesity.
Figure 5.
Effect of obesity on breast cancer progression and tumor growth in orthotopic/syngeneic mice. A) Representative in vivo bioluminescent imaging of tumors performed 4 weeks after orthotopic/syngeneic allografting of EO771-FG12 cells into female transgenic lean and obese mice negative for the MMTV-TGFα transgene (n = 7 mice per group). B) Representative in vivo bioluminescent imaging of tumors performed 4 weeks after orthotopic/syngeneic allografting of EO771-FG12 cells into female a/a lean mice (n = 7), A y /a obese mice (n = 6), A y /a obese mice treated with metformin (300mg/kg daily; n = 6) and A y /a obese mice treated with everolimus (4mg/kg daily; n = 8). C) Representative images of syngeneic allografted tumors harvested from randomized lean, obese, metformin-treated, and everolimus-treated obese female mice (scale bars represent 5mm; left panel). A bar graph illustrates the mean tumor weights from the same experiment (n = 6–8 mice per group; right panel). Statistical significance was calculated by one-way analysis of variance. D) Phospho-protein levels of members of the AKT/mTOR signaling pathway from syngeneic allografted tumor lysates from obese mice plotted relative to those from lean mice (n = 5). E) Western blot analysis of total and phospho-AKT (Ser473), total and phospho-mTOR (Ser2448), and total and phospho-p70S6K (Thr389). Error bars in panels (B) and (D) represent 95% confidence intervals.
Role of Mature Adipocytes and Adipokines on BC Cell Growth
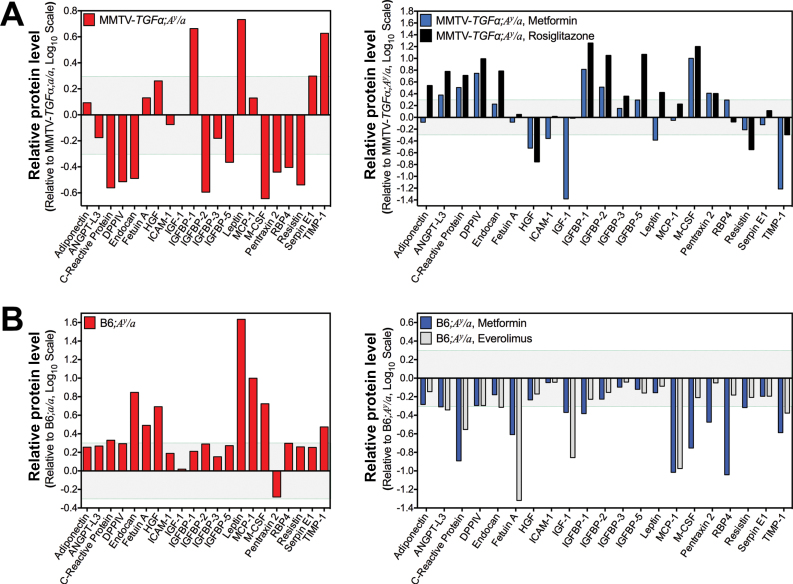
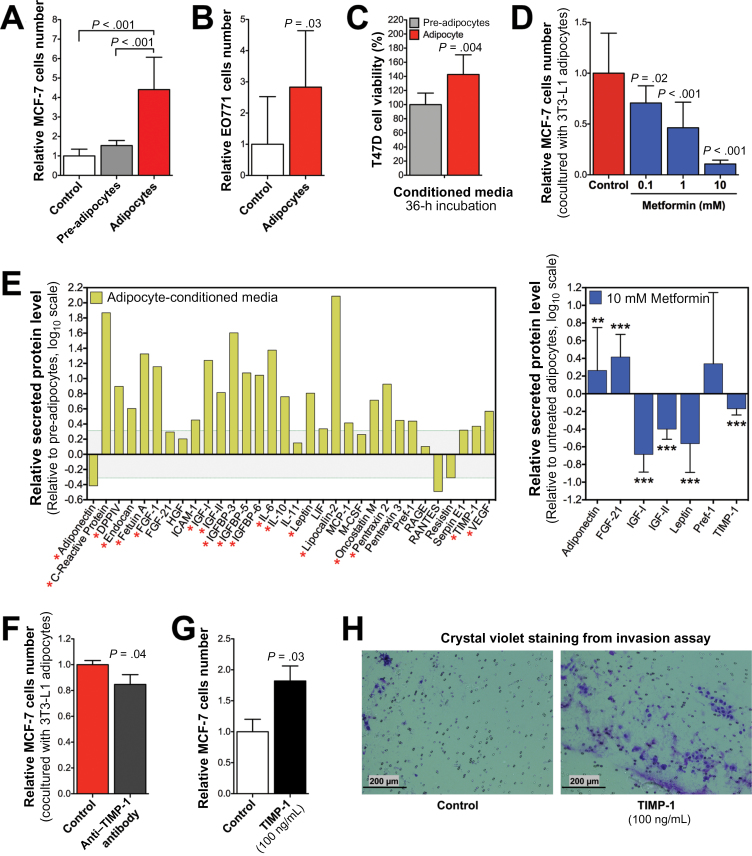
Adipokine profiles from serum of both obese mouse models (Figure 6), together with the hormone data (Figure 2B), corroborated the importance of estradiol, insulin, hepatic growth factor, IGF-1, leptin, and TIMP-1 as important upstream regulators in obese ER+ BC. Obese mice treated with metformin or everolimus showed a decrease in serum adipokines (eg, Fetuin-A, IGF-1, MCP-1, TIMP-1), but indirect inhibition of the phosphatidylinositide-3-kinase (PI3K) pathway by rosiglitazone only suppressed serum hepatic growth factor, Resistin, and TIMP-1 (Figure 6). In the context of obesity, mature adipocytes humorally accelerated MCF7 (P < .001) (Figure 7A) and EO771 (P = .03) (Figure 7B) BC cell proliferation in vitro through secreted mediators (P = .004) (Figure 7C), whereas metformin inhibited the adipocyte-accelerated cell proliferation in a dose–dependent manner (0.1mM, P = .02; 1mM and 10mM, P < .001) (Figure 7D). To identify adipocyte-secreted factors contributing to BC cell growth, we measured the level of secreted adipokines into the adipocyte-conditioned media and found increased levels of several adipokines but a decreased level of adiponectin relative to the pre-adipocyte-conditioned media (Figure 7E). In contrast, metformin treatment statistically significantly increased adipocytes secretion of adiponectin (P < .01) and fibroblast growth factor 21 (P < .001) but suppressed secretion of IGF-1, IGF-2, leptin, and TIMP-1 (P < .001) (Figure 7E). Moreover, metformin decreased lipid accumulation during adipocytes differentiation (Supplementary Figure 8, available online).
Figure 6.
Effect of metformin and everolimus on serum adipokine levels in obese mice. A) Serum adipokines profile. Relative protein level presented as log ratio of integrated optical density of the microarray dot blot in the MMTV-TGFα;A y /a obese mouse pooled sera array relative to that in the MMTV-TGFα;a/a lean mouse pooled sera array is plotted (n = 3 mice per group composite) for each adipokine tested (left panel). Protein level presented as log ratio of integrated optical density of the microarray dot blot in the metformin-treated obese mouse pooled sera array relative to that in the untreated obese mouse pooled sera array is plotted (n = 3 mice per group composite) for each adipokine tested (right panel). B) Serum adipokines profile. Relative protein level presented as log ratio of integrated optical density of the microarray dot blot in the A y /a obese mouse pooled sera array relative to that in the a/a lean mouse pooled sera array is plotted (n = 3 mice per group composite) for each adipokine tested (left panel). Protein level presented as log ratio of integrated optical density of the microarray dot blot in the metformin-treated and everolimus-treated obese mouse pooled sera arrays relative to that in the untreated obese mouse pooled sera array is plotted (n = 3 mice per group composite) for each adipokine tested (right panel).
Figure 7.
Effect of adipocytes on breast cancer cell proliferation and viability. A) MCF7 cell proliferation after having been cultured alone, in coculture with 3T3-L1 fibroblasts, or in coculture with 3T3-L1 mature adipocytes for 4 days. B) EO771 cell proliferation after having been cultured alone or in coculture with 3T3-L1 mature adipocytes for 3 days with high glucose Dulbecco’s modified Eagle medium and 10% bovine calf serum. C) Cell viability of T47D BC cells after incubation with undifferentiated 3T3-L1 pre-adipocyte-conditioned media or with differentiated 3T3-L1 mature adipocyte-conditioned media. D) MCF7 cell proliferation after metformin treatment cultured in coculture with 3T3-L1 mature adipocytes for 4 days. E) Adipokine profile array of conditioned media supernatants from 3T3-L1 mature adipocytes cultured for 24 hours relative to 3T3-L1 pre-adipocytes (n = 3 composite; left panel). Adipokines of conditioned media supernatants from 3T3-L1 mature adipocytes cultured with metformin for 24 hours relative to nontreated 3T3-L1 adipocytes (n = 3; right panel). Asterisks represent statistical significance (*P<.05, **P<.01, ***P<.001), one-way analysis of variance. F) MCF7 cell proliferation after being cocultured with 3T3-L1 mature adipocytes for 4 days alone or with TIMP-1 neutralizing antibody (2 μg/mL; R&D Systems). G) MCF7 cell proliferation after being cultured for 4 days alone or with human TIMP-1 (100ng/mL; Millipore, Billerica, MA). H) Representative photomicrographs of invasion assay of MCF7 cells, which were cultured for 4 days alone or with TIMP-1 (100ng/mL). Images were captured at ×4 magnification. Error bars in panels (A–G) represent 95% confidence intervals (n ≥ 3). Statistical significances were calculated by one-way analysis of variance for panels (A) and (D) and by two-tailed t test for panels (C), (F), and (G).
Interestingly, our transcriptomic analysis showed TIMP-1 as an upstream regulator related to the impact of obesity on BC. Investigating the role of TIMP-1 on the adipocyte-induced BC cell proliferation, we found that adipocyte-induced MCF7 cell proliferation was statistically significantly reduced by a TIMP-1 neutralizing antibody (P = .04) (Figure 7F). In addition, treatment with TIMP-1 induced MCF-7 cell proliferation (P = .03) (Figure 7G) and extracellular matrix invasion (Figure 7H).
Discussion
Obesity induces overall transcriptional changes, enhancing the cancer hallmarks of tumors from ER+ BC patients before any treatment. Our findings give a comprehensive overview as well as direct evidence for the mechanisms associated with the obesity-induced poor clinical outcomes (eg, overall survival, progression-free survival, aggressiveness, metastasis). The bioinformatics approach provided the complete landscape of functional changes affected by the upstream regulators. Thus, we have provided strong evidence for the involvement of adipokines in mediating the influence of obesity on patients with ER+ BC.
Previous in vivo studies of obesity and cancer have used lepr ob/ob or lepr db/db mice that lack functional leptin signaling (26,27) and diet-induced obesity (28–30). High-fat diet induces obesity, but it is not the only driver of the metabolic changes underlying obesity (31–33). Diet-induced obesity models cannot exclude the contribution of excessive dietary fat percentage on carcinogenesis and cancer progression. Our mouse models recapitulate the human obesity phenotype and obesity-induced endocrine profile. Our model did not demonstrate that obesity by itself could initiate the carcinogenic process, but both our longitudinal and cross-sectional data did demonstrate in vivo that obesity accelerates oncogene-driven breast carcinogenesis and tumor growth. Functional transcriptomic analysis of BC from obese and lean mice also recapitulated many of the biological functions affected by obesity from the human dataset.
In agreement with the human transcriptomic analysis, tumors from obese mice showed increased phospho-protein levels of the PI3K/AKT/mTOR signaling pathway members (Figure 3G), which is an indicator of increased anabolic metabolism, cancer cell proliferation, and survival (34). Our results supported that obesity accelerates carcinogenesis and tumor growth in mice and that this obesity-induced effect is dependent on the AKT/mTOR signaling. Moreover, our data suggest that metformin and everolimus may serve as treatments of choice or in combination with other standard cancer treatment for BC patients with obesity. In the context of obesity, our studies show that adipocytes and adipokines promote cancer development and accelerate cancer cell growth after transformation. In contrast, metformin or everolimus suppresses mouse serum adipokines (eg, TIMP-1), which correlates with the decrease in tumor growth. TIMP-1 has been related with poor prognosis in BC (35,36), and it is recently known to activate the PI3K/AKT pathway (37). Our findings showed TIMP-1 as an upstream regulator with an important role in obesity-induced BC.
Our study has provided a better understanding of the mechanism involved in the effect of obesity on cancer and has set the ground for targeting appropriate specific patient population for treatment with metformin and everolimus. It has provided the obesity-induced functional transcriptomic changes and signaling mechanisms involved in obesity-accelerated breast cancer in both humans and mice in the context of their contributions to specific cancer hallmarks. However, a major limitation in our study is that the transcriptomic changes reflect the mixed response of cancer cells and stromal cells to obesity. The relative contribution of stroma to the transcriptome of the tissue samples may vary. Future research with new methodology may be able to overcome this limitation.
In conclusion, our data from humans provide direct evidence for the mechanistic involvement of adipokines in addition to estrogen, insulin, or IGF-1 signaling. The results from our mouse model corroborate human data and provide prospective data to support the conclusion that obesity accelerates ER+ breast carcinogenesis and cancer progression through adipokines and PI3K/AKT/mTOR signaling. Our mouse model will be a useful tool for future research on therapeutic strategies that would block or reverse the effect of obesity on cancer (38).
Funding
This work was supported by a Susan G. Komen for the Cure Promise Grant (KG081048 to SCY, MHL, FJE, and WLM); and the National Cancer Institute at the National Institutes of Health (RO1-CA089266 to MHL; Cancer Center Support Grant P30-CA16672 to The University of Texas MD Anderson Cancer Center). FJE and LPu were supported by the Breast Cancer Research Foundation. EFM was supported by the National Cancer Institute at the National Institutes of Health Training Grant Program in Molecular Genetics (T32-CA009299) and National Institutes of Health Loan Repayment Program. GVT was supported by a National Institutes of Health cancer prevention fellowship (R25T CA57730) and then by a National Institutes of Health minority supplement (3-R01CA089266-08S1, 3-R01CA089266-09S1, and 3-R01CA089266-10S1; PI: MHL). LPh was supported by the Vietnam Education Foundation, the Rosalie B. Hite Foundation, and the Department of Defense Breast Cancer Research Program (W81XWH-10–0171).
EFM, MHL, and SCY conceived the experimental design and wrote the manuscript. EFM performed and contributed to all experiments herein. EFM, YQ, YZ, FJE, GNH, LPu, WFS, and SCY contributed to the patients’ clinical information retrieval and analyses. EFM, LPh, and SCY performed bioinformatics analyses. EFM, GVT, FZ, PCC, JHS, HHC, JSC, RZ, JC, CG, CC, YL, YW, and WLM contributed to the in vivo experiments. YW contributed to the histopathology analyses. EFM, GVT, JHS, and JSC contributed to the in vitro experiments. JE and SCY contributed to the statistical analysis.
The study sponsors had no role in the design of the study; the collection, analysis, and interpretation of the data; the writing of the manuscript; and the decision to submit the manuscript for publication. The authors have declared no conflicts of interest.
We acknowledge the Genomics Core Facility and the Department of Scientific Publications at The University of Texas MD Anderson Cancer Center. We also acknowledge Dr Mien-Chie Hung, the Department of Molecular and Cellular Oncology staff, and the Department of Emergency Medicine staff for their constant support.
References
- 1. Renehan AG, Tyson M, Egger M, et al. Body-mass index and incidence of cancer: a systematic review and meta-analysis of prospective observational studies. Lancet. 2008;371(9612):569–578 [DOI] [PubMed] [Google Scholar]
- 2. La Vecchia C, Negri E, Franceschi S, et al. Body mass index and post-menopausal breast cancer: an age-specific analysis. Br J Cancer. 1997;75(3):441–444 [DOI] [PMC free article] [PubMed] [Google Scholar]
- 3. Petrelli JM, Calle EE, Rodriguez C, et al. Body mass index, height, and postmenopausal breast cancer mortality in a prospective cohort of US women. Cancer Causes Control. 2002;13(4):325–332 [DOI] [PubMed] [Google Scholar]
- 4. Carmichael AR. Obesity as a risk factor for development and poor prognosis of breast cancer. BJOG. 2006;113(10):1160–1166 [DOI] [PubMed] [Google Scholar]
- 5. Renehan AG, Soerjomataram I, Tyson M, et al. Incident cancer burden attributable to excess body mass index in 30 European countries. Int J Cancer. 2010;126(3):692–702 [DOI] [PubMed] [Google Scholar]
- 6. Protani M, Coory M, Martin JH. Effect of obesity on survival of women with breast cancer: systematic review and meta-analysis. Breast Cancer Res Treat. 2010;123(3):627–635 [DOI] [PubMed] [Google Scholar]
- 7. Grossmann ME, Ray A, Nkhata KJ, et al. Obesity and breast cancer: status of leptin and adiponectin in pathological processes. Cancer Metastasis Rev. 2010;29(4):641–653 [DOI] [PubMed] [Google Scholar]
- 8. Taubes G. Unraveling the obesity-cancer connection. Science. 2012;335(6064):28–32 [DOI] [PubMed] [Google Scholar]
- 9. Hanahan D, Weinberg RA. Hallmarks of cancer: the next generation. Cell. 2011;144(5):646–674 [DOI] [PubMed] [Google Scholar]
- 10. Hatzis C, Pusztai L, Valero V, et al. A genomic predictor of response and survival following taxane-anthracycline chemotherapy for invasive breast cancer. JAMA. 2011;305(18):1873–1881 [DOI] [PMC free article] [PubMed] [Google Scholar]
- 11. Symmans WF, Ayers M, Clark EA, et al. Total RNA yield and microarray gene expression profiles from fine-needle aspiration biopsy and core-needle biopsy samples of breast carcinoma. Cancer. 2003;97(12):2960–2971 [DOI] [PubMed] [Google Scholar]
- 12. Symmans WF, Peintinger F, Hatzis C, et al. Measurement of residual breast cancer burden to predict survival after neoadjuvant chemotherapy. J Clin Oncol. 2007;25(28):4414–4422 [DOI] [PubMed] [Google Scholar]
- 13. Bassukas ID, Vester G, Maurer-Schultze B. Cell kinetic studies of endothelial cells in the adenocarcinoma EO 771 and the effect of cyclophosphamide. Virchows Arch B Cell Pathol Incl Mol Pathol. 1990;59(4):251–256 [DOI] [PubMed] [Google Scholar]
- 14. Pan J, Chen C, Jin Y, et al. Differential impact of structurally different anti-diabetic drugs on proliferation and chemosensitivity of acute lymphoblastic leukemia cells. Cell Cycle. 2012;11(12):2314–2326 [DOI] [PMC free article] [PubMed] [Google Scholar]
- 15. Zhao R, Fuentes-Mattei E, Velazquez-Torres G, et al. Exenatide improves glucocorticoid-induced glucose intolerance in mice. Diabetes Metab Syndr Obes. 2011;4:61–65 [DOI] [PMC free article] [PubMed] [Google Scholar]
- 16. Fuentes-Mattei E, Rivera E, Gioda A, et al. Use of human bronchial epithelial cells (BEAS-2B) to study immunological markers resulting from exposure to PM(2.5) organic extract from Puerto Rico. Toxicol Appl Pharmacol. 2010;243(3):381–389 [DOI] [PMC free article] [PubMed] [Google Scholar]
- 17. Krzywinski M, Schein J, Birol I, et al. Circos: an information aesthetic for comparative genomics. Genome Res. 2009;19(9):1639–1645 [DOI] [PMC free article] [PubMed] [Google Scholar]
- 18. Zhao R, Yeung SC, Chen J, et al. Subunit 6 of the COP9 signalosome promotes tumorigenesis in mice through stabilization of MDM2 and is upregulated in human cancers. J Clin Invest. 2011;121(3):851–865 [DOI] [PMC free article] [PubMed] [Google Scholar]
- 19. Gully CP, Velazquez-Torres G, Shin JH, et al. Aurora B kinase phosphorylates and instigates degradation of p53. Proc Natl Acad Sci U S A. 2012;109(24):E1513–E1522 [DOI] [PMC free article] [PubMed] [Google Scholar]
- 20. Subramanian A, Tamayo P, Mootha VK, et al. Gene set enrichment analysis: a knowledge-based approach for interpreting genome-wide expression profiles. Proc Natl Acad Sci U S A. 2005;102(43):15545–15550 [DOI] [PMC free article] [PubMed] [Google Scholar]
- 21. Fine JP, Gray RJ. A proportional hazards model for the subdistribution of a competing risk. J Am Stat Assoc. 1999;94(446):496–509 [Google Scholar]
- 22. Song R, Peng W, Zhang Y, et al. Central role of E3 ubiquitin ligase MG53 in insulin resistance and metabolic disorders. Nature. 2013;494(7437):375–379 [DOI] [PubMed] [Google Scholar]
- 23. Yi JS, Park JS, Ham YM, et al. MG53-induced IRS-1 ubiquitination negatively regulates skeletal myogenesis and insulin signalling. Nat Commun. 2013;4:2354. [DOI] [PMC free article] [PubMed] [Google Scholar]
- 24. Yang WL, Wang J, Chan CH, et al. The E3 ligase TRAF6 regulates Akt ubiquitination and activation. Science. 2009;325(5944):1134–1138 [DOI] [PMC free article] [PubMed] [Google Scholar]
- 25. Krzywinski M, Birol I, Jones SJ, et al. Hive plots—rational approach to visualizing networks. Brief Bioinform. 2012;13(5):627–644 [DOI] [PubMed] [Google Scholar]
- 26. Zheng Q, Dunlap SM, Zhu J, et al. Leptin deficiency suppresses MMTV-Wnt-1 mammary tumor growth in obese mice and abrogates tumor initiating cell survival. Endocr Relat Cancer. 2011;18(4):491–503 [DOI] [PMC free article] [PubMed] [Google Scholar]
- 27. Ribeiro AM, Andrade S, Pinho F, et al. Prostate cancer cell proliferation and angiogenesis in different obese mice models. Int J Exp Pathol. 2010;91(4):374–386 [DOI] [PMC free article] [PubMed] [Google Scholar]
- 28. Dogan S, Hu X, Zhang Y, et al. Effects of high-fat diet and/or body weight on mammary tumor leptin and apoptosis signaling pathways in MMTV-TGF-alpha mice. Breast Cancer Res. 2007;9(6):R91. [DOI] [PMC free article] [PubMed] [Google Scholar]
- 29. Nogueira LM, Dunlap SM, Ford NA, et al. Calorie restriction and rapamycin inhibit MMTV-Wnt-1 mammary tumor growth in a mouse model of postmenopausal obesity. Endocr Relat Cancer. 2012;19(1):57–68 [DOI] [PubMed] [Google Scholar]
- 30. Chen CT, Du Y, Yamaguchi H, et al. Targeting the IKKbeta/mTOR/VEGF signaling pathway as a potential therapeutic strategy for obesity-related breast cancer. Mol Cancer Ther. 2012;11(10):2212–2221 [DOI] [PMC free article] [PubMed] [Google Scholar]
- 31. Asterholm IW, Scherer PE. Metabolic jet lag when the fat clock is out of sync. Nat Med. 2012;18(12):1738–1740 [DOI] [PMC free article] [PubMed] [Google Scholar]
- 32. Paschos GK, Ibrahim S, Song WL, et al. Obesity in mice with adipocyte-specific deletion of clock component Arntl. Nat Med. 2012;18(12):1768–1777 [DOI] [PMC free article] [PubMed] [Google Scholar]
- 33. Johnson AM, Olefsky JM. The origins and drivers of insulin resistance. Cell. 2013;152(4):673–684 [DOI] [PubMed] [Google Scholar]
- 34. Tao Y, Pinzi V, Bourhis J, et al. Mechanisms of disease: signaling of the insulin-like growth factor 1 receptor pathway—therapeutic perspectives in cancer. Nat Clin Pract Oncol. 2007;4(10):591–602 [DOI] [PubMed] [Google Scholar]
- 35. Schrohl AS, Holten-Andersen MN, Peters HA, et al. Tumor tissue levels of tissue inhibitor of metalloproteinase-1 as a prognostic marker in primary breast cancer. Clin Cancer Res. 2004;10(7):2289–2298 [DOI] [PubMed] [Google Scholar]
- 36. Lee JH, Choi JW, Kim YS. Serum TIMP-1 predicts survival outcomes of invasive breast carcinoma patients: a meta-analysis. Arch Med Res. 2011;42(6):463–468 [DOI] [PubMed] [Google Scholar]
- 37. Fu ZY, Lv JH, Ma CY, et al. Tissue inhibitor of metalloproteinase-1 decreased chemosensitivity of MDA-435 breast cancer cells to chemotherapeutic drugs through the PI3K/AKT/NF-small ka, CyrillicB pathway. Biomed Pharmacother. 2011;65(3):163–167 [DOI] [PubMed] [Google Scholar]
- 38. Esteva FJ, Moulder SL, Gonzalez-Angulo AM, et al. Phase I trial of exemestane in combination with metformin and rosiglitazone in nondiabetic obese postmenopausal women with hormone receptor-positive metastatic breast cancer. Cancer Chemother Pharmacol. 2013;71(1):63–72 [DOI] [PMC free article] [PubMed] [Google Scholar]


