Abstract
The ability to discern malignant from benign tissue in excised human breast specimens in Breast Conservation Surgery (BCS) was evaluated using single frequency terahertz radiation. Terahertz (THz) images of the specimens in reflection mode were obtained by employing a gas laser source and mechanical scanning. The images were correlated with optical histological micrographs of the same specimens, and a mean discrimination of 73% was found for five out of six samples using Receiver Operating Characteristic (ROC) analysis. The system design and characterization is discussed in detail. The initial results are encouraging but further development of the technology and clinical evaluation is needed to evaluate its feasibility in the clinical environment.
Index Terms: Breast cancer, medical imaging, reflectivity, refractive index, single frequency THz imaging (SFTI), THz
I. Introduction
Applicability of terahertz (THz) radiation to the fields of biology and medicine has already been established [1], [2]. Early progress was made by the University of Cambridge/Teraview group, which employed THz pulsed imaging (TPI), also termed time-domain spectroscopy (TDS), to produce scanned images of skin cancer specimens and differentiate malignant (cancerous) from benign tissue [3]. More recently, the potential of THz radiation for such tissue differentiation in excised breast, cervical, and colon cancer samples has been demonstrated [4], [5], [6]. THz radiation has advantages over X-rays because, as determined with TPI, it has greater contrast between tissue types [5], [6], [7]. Also, THz photons have energies of only a few millielectronvolts (meV) and are, therefore, expected to be non-ionizing, meaning that they are incapable of breaking standard chemical bonds. More subtle effects have been hypothesized and studied, however, which can occur at power levels of a few milliwatts (mW) during exposure on the order of hours, not unlike the conditions produced by our apparatus [8], [9]. These effects could be equivalent to thermal effects [8] or could have a more complex interaction which produces changes in cell function [9]. In any case, only excised samples were studied for this project and so no harmful effects due to THz exposure were considered.
This project, a collaboration between the University of Massachusetts in Amherst (UM/A) and the University of Massachusetts Medical School in Worcester (UMMS), evaluates the ability of single-frequency THz radiation to discern malignant from benign human breast tissue in surgical resection specimens. This was done by the assessment of samples excised during Breast Conservation Surgery (BCS). In BCS, surgeons remove tissue until surfaces of excised tissue appear not to contain cancer. Afterward, if pathologists on histology do not find a margin of benign breast tissue around the excised sample, a repeat surgery is necessary. This is also known as verification of the surgical resection margin. Estimates of how often surgeries must be repeated varies from publication to publication, but most seem to agree that it occurs for 20%–70% of procedures [10]–[14].
An operating room device for the quick assessment of tissue margins would reduce the number of repeat surgeries while enabling surgeons to be more conservative with tissue removal. A THz camera for real-time imaging might offer a compact, inexpensive and safe solution. Such a solution could achieve reduced cost and complexity if designed to use the continuous-wave single frequency THz imaging (SFTI) method rather than a time domain method. Technology which might be utilized in the design of such a camera has been described by Öjefors et al. [15]. Recently, SFTI has been employed for the imaging of skin cancer with transmission measurements [16] and reflection measurements [17].
This pilot project evaluates the potential of SFTI reflectance measurements to assist with BCS, for which a THz system based on a molecular gas laser has been constructed. For the evaluation, specimens were excised at UMMS, sent to UM/A for THz imaging, then returned to UMMS for standard histology analysis. Histology results served as the true references against which the THz results were compared. Receiver operating characteristic (ROC) results for five of the six samples were comparable to those obtained with TPI by Fitzgerald et al. [6]. Although more samples would be required for a proper statistical analysis, our results are encouraging and suggest the practicability of future SFTI THz cameras.
II. Measurement Apparatus and Methods
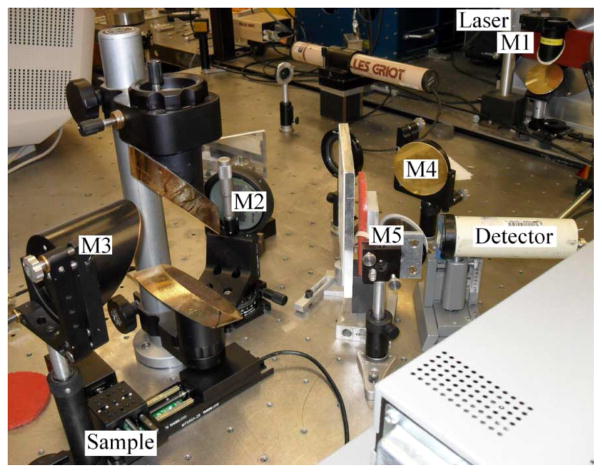
The apparatus consists primarily of a THz laser source and a series of optical elements for focusing the beam onto a sample and then focusing the reflected beam onto a detector. A computer records detector output while positioning the sample in a plane using two motorized platforms. Images are created by calculating refractive index based on reflected power and mapping it to a color scale. The general layout of the system is shown in the diagram of Fig. 1 and in the photograph of Fig. 2.
Fig. 1.
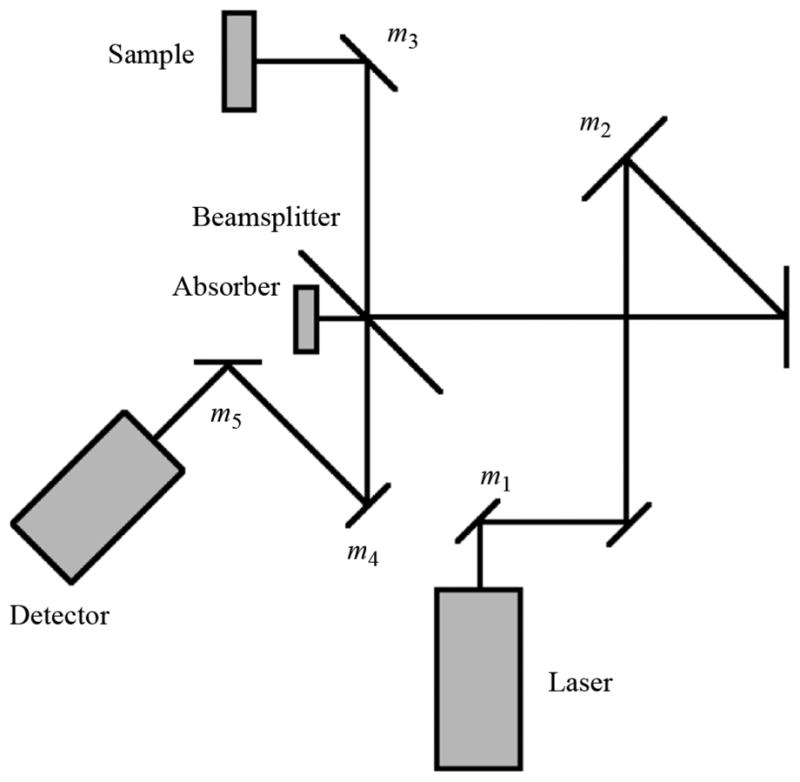
Focusing element layout.
Fig. 2.
Photograph of focusing element layout.
A. Laser Source and Modulator
THz radiation is in the far-infrared (FIR) region and may be generated with a laser system. The laser source available to this project was originally constructed for radio astronomy at the South Pole [18]. It is a cascade of two lasers with the output of a CO2 laser entering an FIR laser tube. This system is capable of operation at one of many frequencies, depending on FIR gas selection, FIR gas pressure, and fine adjustment of the CO2 laser tube length.
The CO2 laser has a wavelength of approximately 10 μm and a power of 30 W. When tuned to a 9P10 laser line, and with 85 mTorr of difluoromethane gas in the FIR tube, a 650 μW beam is generated with a frequency of 1.8913 THz[19]. This frequency was proximately verified using a Michelson interferometer. The frequency produced an easily-reproducible beam of relatively high power. The work of Ashworth et al. suggests that choosing a lower THz frequency could have increased refractive index contrast between cancerous and healthy fibrous tissues by a few percent, but this advantage was outweighed by the aforementioned practical benefit [20]. Furthermore, higher frequencies afford higher spatial resolution. The refractive index of breast tissues at THz frequencies is further explored in Section II-G. Polarization is perpendicular to the optics table as tested by having rotated a grating of thin and uniformly aligned wires until the beam was most severely attenuated.
The FIR laser is modulated by periodically diverting the CO2 beam path with an acousto-optic modulator (AOM). This type of modulator works by allowing the compression and rarefaction of sound waves to effectively change refractive index within a transparent material. Our particular device uses germanium. It may be operated as a Raman-Nath device, which has many diffracted orders; or as a Bragg device, which concentrates most of the power into the zeroth and first orders. The Bragg configuration is preferred for application as a modulation switch and is achieved when L < Λ2/λ, where L is the interaction length between the laser beam and sound field, Λ is the sound wavelength, and λ is the laser wavelength [21]. For maximum efficiency in a Bragg device, the incident laser beam must make an angle of incidence with the sound field of θB = λ/2Λ. For this application, the minimal reflection, carefully controlled diffraction, and precise timing afforded by the AOM give it an advantage over standard modulators such as chopper wheels.
B. Beam Splitter
The laser beam was made normal to the sample in consideration of potential future in-vivo applications and for avoidance of the birefringence effects possible in crystal sample covers. Since incident and reflected beams occupy the same space, normal incidence requires the use of a beam splitter. Our beam splitter is oriented at 45 degrees and is made of 25 μm Mylar, which has a refractive index of 1.79 [22].
As shown in Fig. 1, the beam is reflected by the beam splitter, reflected by the sample, then transmitted through the beam splitter on its way to the detector. Minimization of beam splitter losses therefore becomes maximization of R*T, such that R = (1 − T), where R and T are reflected and transmitted power. The solution is R = T for a best possible efficiency of 25%. Standard techniques were used to calculate a 73% transmission for our 45 degree beam splitter [23]. The efficiency is then (1 – 73%) · 73% = 19.7%.
C. Focusing Elements
The layout of focusing elements was designed in the same way that Gaussian beam telescopes are designed. For this, mirrors were regarded as lenses of infinitesimal thickness. The design was evaluated using ray transfer matrices, which utilize the simplifying assumptions of Gaussian beam optics, a technique commonly employed in the design of THz systems [24].
1) Initial Design Using the Gaussian Beam Telescope Method
A Gaussian beam telescope, or Newtonian telescope [25], is a telescope in which the sum of the focal lengths between any two focusing elements is equal to the distance between those elements [23]. This technique simplifies design because knowing focal points requires consideration of only the previous element. In our setup, these afocal telescopes are formed by mirrors m2 and m3, as well as m3 and m4 of the reflection path.
A basic representation of the final design is shown in Fig. 1, where non-focusing flat mirrors are unlabeled. Specifications for each of the focusing elements are given in Table I. Although this design began with the Gaussian beam telescope concept, small adjustments have been made such that the distance between elements is not always equal to the sum of their focal lengths.
TABLE I.
Details of Focusing Element Layout
| Label | Position [mm] | Focal Length [mm] | Description |
|---|---|---|---|
| m1 | 75 | 75 | OAP Mirror |
| m2 | 912 | 762 | Spherical Mirror |
| m3 | 1674 | 89 | OAP Mirror |
| 1763 | Sample | ||
| m3 | 1852 | 89 | OAP Mirror |
| m4 | 2267 | 326 | OAP Mirror |
| m5 | 2450 | 75 | OAP Mirror |
| 2500 | Detector |
2) Evaluation Using Ray Transfer Matrices
Ray transfer matrices, sometimes called ABCD matrices, were used to find Gaussian beam width for all points along the beam path. Gaussian beam optics uses the paraxial approximation to avoid a full treatment of the diffraction of electromagnetic waves. A paraxial ray is a ray which forms only small angles with the axis of propagation so that simplifying approximations such as sin θ ≈ θ, tan θ ≈ θ, and cos θ ≈ 1 may be used. First-order ray transfer matrices were applied with an iterative technique using the complex beam parameter, q, which is a combination of the two beam dispersion parameters
| (1) |
The beam width, w, is the first beam dispersion parameter and follows from the definition of electric field strength in a Gaussian beam, described by
| (2) |
where r is the distance from the axis of propagation, E0 is the field magnitude at r = 0, and w is the beam width for that particular point along the axis [23]. At the focal plane, beam width is referred to as beam waist and denoted w0. The equiphase wavefront may be thought of as a patch on the surface of a sphere of radius R. This is the second beam dispersion parameter, known as Gaussian beam radius. R, w, and q are functions of z, where z is the position along the axis of propagation. In the general ray transfer matrix equation, qn represents the present value, qn−1 represents the previous value, and Q is a normalization constant [25]
| (3) |
The ABCD matrix of (3) may be replaced with a cascade of matrices, each representing either an empty space segment or a focusing element of the optics setup [23]. Iterative multiplication was seeded by knowing beam width at the source and setting initial beam radius to infinity. By evaluation of
| (4) |
in which aperture radius is denoted a, more than 99% of Gaussian beam power is found to pass through a hole of diameter d = πw[25]. The initial beam width is then approximately 4mm/π for our 4 mm circular aperture. Real-valued beam width may be extracted from the final complex beam parameter
| (5) |
The beam width radius is shown as a function of position in Fig. 3. The maximum value is about mm. The largest mirror must, therefore, have a diameter of at least π(13 mm) ≈ 4 cm. Fig. 3 also shows that beam width at the detector and sample are about 600 μm. A more careful treatment of beam width at the sample is provided in Section II-J. The beam is collimated only at the focal plane, before which it is converging and after which it is diverging. The axial range over which the beam may be considered reasonably collimated is known as the Rayleigh range [26]:
| (6) |
Fig. 3.
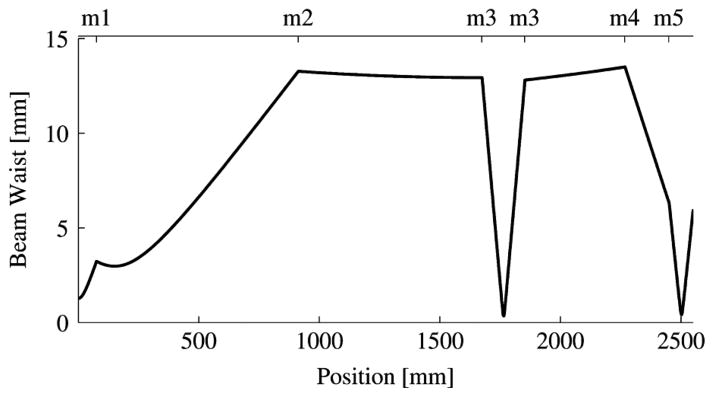
Beam width by position. Mirror numbers are as given in Fig. 1.
Evaluation of (6) yields an acceptable margin of error for sample placement along the beam axis of ±7 mm.
D. Detectors
The detectors measure laser power, which is amplitude modulated by a 10 Hz, 50% duty cycle square wave. Detector outputs connect to lock-in amplifiers and the square wave reference. Initial measurements were made using only a Molectron P4-42 pyroelectric detector. Sensitivity was insufficient so it was replaced with a liquid-helium cooled bolometer. The current setup uses both detectors in the manner described in Section II-E-1).
1) Pyroelectric Detector
The Molectron P4-42 pyroelectric detector operates by allowing radiation to heat a lithium tantalate (LiTaO3) crystal. As temperature increases, crystal lattice spacings change, thus changing the polarization properties, thereby changing current flow through a transimpedance amplifier. Noise equivalent power of is valid, according to the datasheet, for 10–800 Hz [27].
2) Bolometer
The liquid-helium cooled bolometer, a model HDL-5 from Infrared Laboratories, has a noise equivalent power of approximately . It works by allowing signals to heat a bulk silicon resistor. This detector has a faster frequency response than the pyroelectric detector and can be used with a higher modulation frequency. The frequency response is shown in Fig. 4.
Fig. 4.
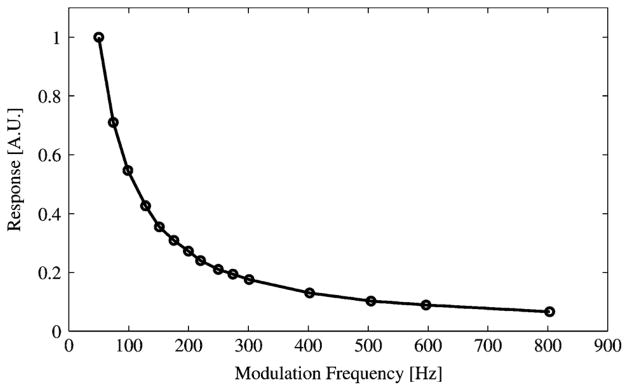
Bolometer Detector Frequency Response.
For highest detector response, it seems reasonable to use the lowest practical modulation frequency for both detectors. However, below a certain modulation frequency, waveforms from the detectors contain high frequency components and variance increases. A good balance for the pyroelectric detector is 10 Hz. Although the bolometer operates best at modulation frequencies of 50 Hz or more, 10 Hz was chosen to accommodate the lesser of the two detectors.
E. Calibration
1) Dual Detector Method
To counteract the effect of laser source fluctuations, a method was developed which uses two detectors for continuous calibration. Near the output aperture of the laser source, a 25 μm beam splitter diverts half the beam to be focused onto the pyroelectric detector (a.k.a. pyro). For this, a 150 mm off-axis paraboloidal mirror (OAP) was placed 700 mm after the laser aperture and the pyro was placed 200 mm after the OAP. The beam splitter is placed between elements m1 and m2 of the original setup.
The power of the laser source, S, is attenuated by GlaserToPyro along its path to the pyroelectric detector, which has a response of GPyro. Power reported by the pyro, P, can be calculated using
| (7) |
The power of the laser source, S, is attenuated by GlaserToSample along its path to the sample, where sample power reflectivity may be denoted as R. The power is then attenuated by GSampleToBolometer along its path to the bolometer, which has a response of GBolometer. The power reported by the bolometer, B, is calculated using
| (8) |
where S cancels when a ratio of B and P is taken. The remaining gain terms may be aggregated into a constant, Q, as in
| (9) |
where Q may be determined by evaluating B/(PR) for a sample of known R. Silicon is used, which has R = 0.299. [28].
After solving for Q with a calibration measurement, the silicon may be replaced with any sample of interest. Sample power reflectivity follows from evaluation of B/(PQ). Because Q contains only system constants, re-calibration is unnecessary. It should be mentioned that what has been referred to as a sample in this section, except for the silicon wafer, was a combination of a sample material and a quartz cover. To compensate for cover effects, additional calculations are necessary as described in Section II-G.
2) Ethanol Solution Method
The system can be calibrated by measuring any material of known reflectivity. A method of using water and ethanol mixtures as calibration references is described by Yngvesson et al. [29]. The two-detector method was found to be more convenient and accurate than using liquid references.
F. Terahertz Reflectivity of Breast Tissues
Expected power reflectivities for human tissues were calculated using dielectric properties as measured by Ashworth et al. [20]. This reference gives the refractive index for frequencies ranging from 0.3 to 1.9THz for breast tumor (carcinoma), healthy fibrous tissue, and fatty (adipose) tissue. The effects of the imaginary part of the refractive index, which is related to the absorption coefficient, were found to be negligible and so only the real part was used. The relationship between power reflectivity and refractive index is as shown below [30]
| (10) |
Table II summarizes the reflectivity of water, ethanol, and the three types of breast tissue. Note that |Γ|2 is predicted to be 20% higher for carcinoma than for fibrous tissue. The ratio between carcinoma and adipose tissue is more than a factor of two. Clearly, distinguishing carcinoma and healthy fibrous tissue is the greatest challenge in this project. Also note that the reflectivities of water and carcinoma are very close at 1.89 THz.
TABLE II.
Refractive Index and Power Reflectivity by Calibration Fluid and Tissue Type
| |n| | |Γ|2 | |
|---|---|---|
| Water | 2.00 | 11.1% |
| Carcinoma | 1.97 | 10.7% |
| Fibrous Tissue | 1.85 | 8.9% |
| Adipose Tissue | 1.57 | 4.9% |
| Ethanol | 1.45 | 3.3% |
G. Sample Cover
Because the system measures reflected power, it cannot distinguish between rough reflective surfaces and flat absorptive surfaces. For this reason, it is desirable to flatten the samples with a material which is reasonably transparent to THz. Surface roughness of the sample must be small relative to the THz wavelength of 159 μm [31]. After testing several Mylar and quartz sample covers, 1.9113 mm single crystal z-cut quartz was chosen. The selection of this cover was of great importance to the production of quality images.
1) Mylar
Available Mylar thicknesses were 6 μm and 25 μm. Every attempt was made to keep the plastic taut over the sample, including heat-shrinking. Even so, usefulness was limited by the persistence of bulges.
2) Quartz of 1.9113 mm
The rigidity of quartz gives it an advantage over Mylar. It has a tensile modulus of more than 70 N/m2. It can be shown that more than 2.5 N of force applied to the center of the cover would be required for a 1 μm deflection at our dimensions—a deflection that would be negligible at our wavelength of 159 μm. Also, quartz has a Moh’s hardness of 7, making it difficult to scratch.1 A quartz plate was characterized as follows.
Separate power reflectivity measurements were made with air and water below the quartz cover as shown in Fig. 5. The difference between those measurements was 14.5 dB. Each of the two measurement values was an average of 100 measurements at a single spatial point, taken according to the general measurement description given in Section II-I1. Standard deviation values for air and water power reflectivity were 0.0024% and 0.089%, respectively.
-
Agilent ADS software simulations (http://www.agilent.com) were run for air (n = 1) and water (n = 2 at 1.89 THz), plotting power reflectivity as a function of cover thickness. The refractive index value for water was calculated using the Double Debye Model as described by Jepsen et al. [32]. The 14.5-dB difference found in (1) corresponded to cover thicknesses of 1.9128 mm + Nλ/2 and 1.9113 mm + Nλ/2.
Although thickness could have been any of several periodic values (see Fig. 7), 1.9113 and 1.9128 mm were closest to an approximate measurement made with a micrometer.
Diffraction and dielectric absorption effectively attenuate the beam as it passes through the cover. From simulation, which does not consider diffractive losses, power reflectivity was 11.22% for covered water. The simulation also used a loss tangent value which was only an approximation. This simulated reflectivity value, which is equal to −9.5 dB, can be seen in Fig. 6 for n = 2 at the relevant thicknesses. From measurement, which necessarily includes diffractive losses and unknown loss tangent, power reflectivity was 4.40%. The ratio of these reflectivities, 2.55, may be regarded as a correction factor.
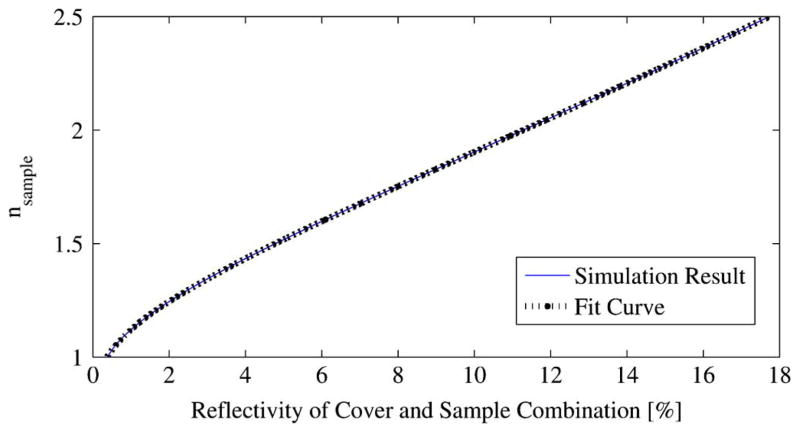
For quartz thicknesses of 1.9113 and 1.9128 mm, |ΓcoveredSample|2 was determined from simulation for a range of refractive indices expected for lumpectomy/mastectomy samples (see Table II). The result was virtually identical for both thicknesses and is shown in Fig. 8. Because there would be no performance difference between a 1.9113 mm cover and a 1.9128 mm cover, the thickness is arbitrarily regarded as 1.9113 mm for ease of communication. Before using the mapping of Fig. 7, measured power reflectivities must be multiplied by the correction factor given above.
Fig. 5.
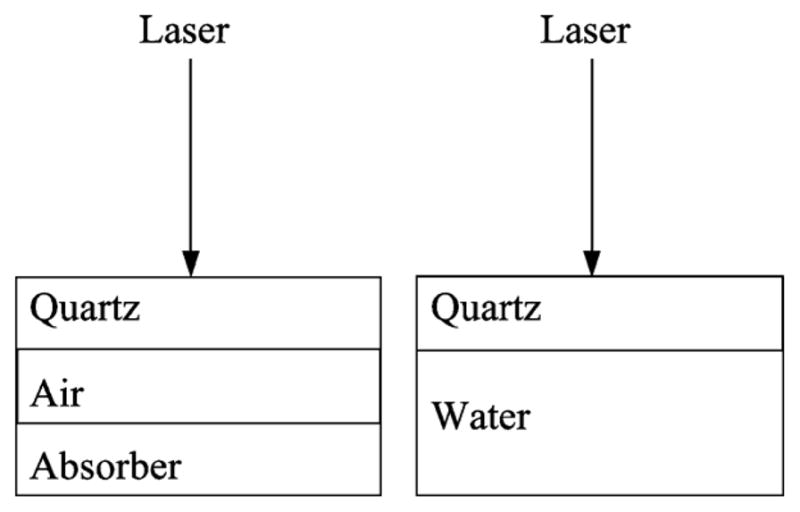
Conceptual illustration of air and water calibration measurements.
Fig. 7.
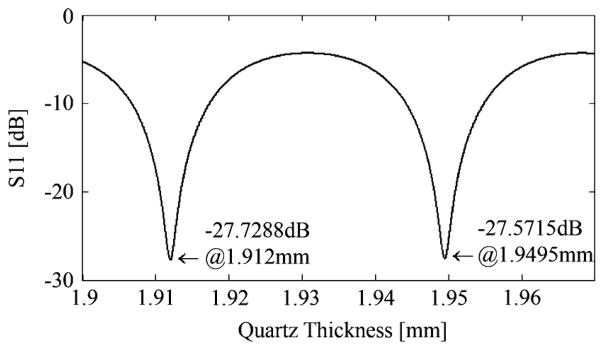
Periodic points of minimum reflectivity..
Fig. 6.
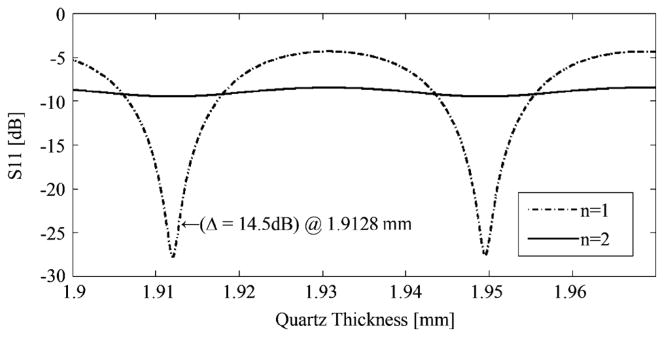
Simulation of the reflected power from quartz covered samples as a function of the quartz thickness. The air and water samples have refractive indices of n = 1 and n = 2, respectively. The thickness of 1.9128 mm that corresponds with the measured calibration data is marked.
Fig. 8.
Mapping between |nsample| and |ΓcoveredSample|2.
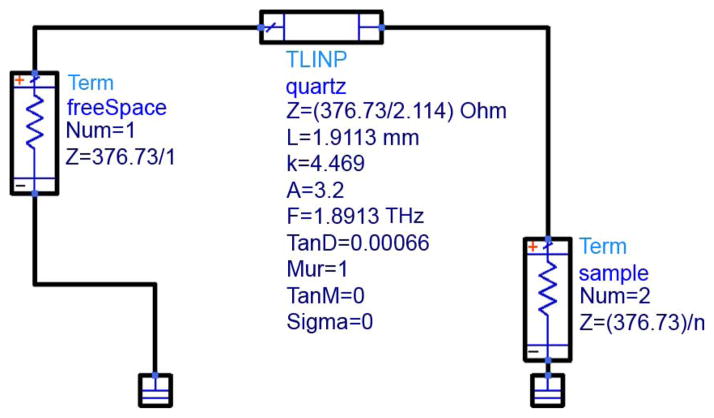
All simulations were based on the schematic of Fig. 9. The leftmost component represents air above the sample cover, the middle component represents the sample cover, and the rightmost component represents the sample. Schematic parameters are defined in Table III.
Fig. 9.
Agilent ADS Simulation Model.
TABLE III.
Quartz Properties for Schematic Model.
| Property | Description | Value |
|---|---|---|
| Z | Impedance | η0/n |
| L | Physical Length | 1.9113mm |
| K | Dielectric Constant | 4.469 |
| A | Attenuation Constant [dB/m] | 3.2 |
| F | Frequency | 1.8919THz |
| TanD | Loss Tangent | 0.00066 |
| Mur | Relative Magnetic Permeability [H/m] | 0 |
| Sigma | Conductivity [S/m] | 0 |
The refractive index value was taken from Bréhat et al., who reported n for quartz of 2.114+j7·10−4 at 1.89 THz. This value was used in the calculation of dielectric constant, attenuation constant, and loss tangent.
H. Sample Holder
The sample holder design is shown in Fig. 10. It consists of two pieces of acrylic, each approximately 6.5 cm by 6.5 cm by 0.5 cm. The top square has a 3 cm thru-hole cut from its center. The bottom piece has a 3 cm square milled from its center with a depth of roughly 0.25 cm. Using screws, the sample cover is tightly sandwiched between the two squares, with the sample itself pressed within the 0.25 cm milled hole.
Fig. 10.
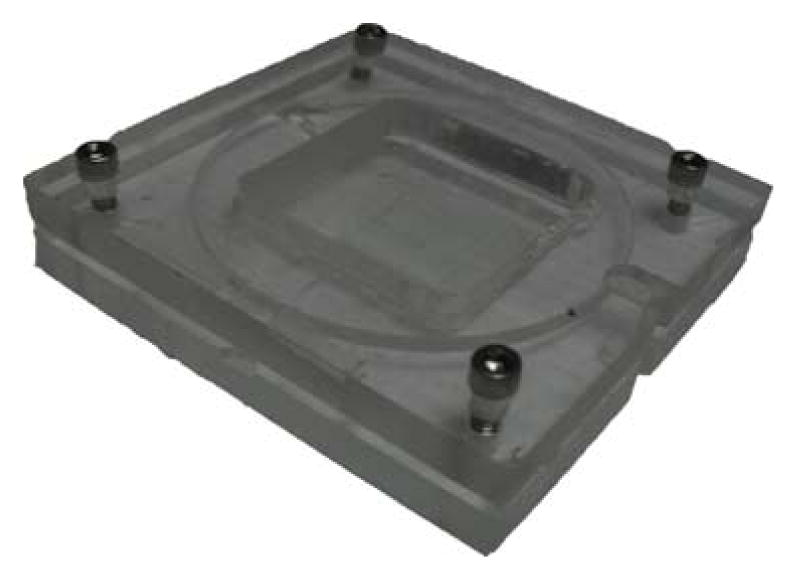
Acrylic sample holder.
I. Lock-in Amplifiers and Data Capture
1) Discrete-Position Measurements
Each of the two detectors is connected to a separate lock-in amplifier (a.k.a. lock-in). For an explanation of the role of each detector, see Section II-E-1).
While reading values from the lock-in amplifiers, the computer controls two motorized platforms which position the sample. The number of rows, number of columns, and spatial intervals between pixels are all variable. Generally, 2 cm square images are made at 1 mm intervals. This interval was chosen to roughly correspond with the expected system resolution and also to permit a sample to be scanned in a practical amount of time.
The lock-in which connects to the bolometer has a time constant of 0.5 s. The lock-in which connects to the pyroelectric detector has a time constant of 1 s. These values were chosen qualitatively by monitoring signal volatility. They also fall within reasonable quantitative bounds, because each time constant contains at least 5 modulation cycles and each pixel measurement has a duration of at least 5 time constants (5 s). We also estimate that the noise power is about 3 times less for the lock-in setup than for a practical LNA and filter combination.
Typically, measurements of breast cancer samples took 45 minutes. This is not a fundamental limitation but is due to the makeup of this particular prototypical system.
2) Continuous-Velocity Measurements
For continuous-velocity measurements, the sample was moved at a constant velocity for each horizontal sweep. These measurements were made when the bolometer, which can operate at high modulation frequencies, was the only detector in the system. Experimentation with this method has been suspended until either the pyroelectric detector is replaced by a detector having a faster response or the modulation scheme is changed (see Section V-C).
J. Spatial Resolution
The THz beam is cropped by a circular aperture as it exits the laser source. The Gaussian beam diameter, D, at the mirror above the sample (m3 in Fig. 1 and Table I) is 2 · 13 mm = 26mm. The focal length of m3 is 89 mm for an F/D ratio of 3.6. The Gaussian radius of the beam waist is given by [25]:
| (11) |
The resolution diameter is, therefore, 2· 665 μm = 1.33mm. The integrated power within this diameter is 86.5% of the total power. A resolution metric that can be directly applied to our case of locating a straight margin is the distance between the 10% and 90% power points in a measurement of something approximating a unit step function. For this, a gold mirror was masked with absorptive tape to create a reflective section in a 20 mm line measurement. The length of this section was 5.1 mm for the horizontal measurement and 5 mm for the vertical. The discrepancy is a result of the tape strips not being perfectly parallel. Fig. 11 shows the result for the horizontal measurement and the resolution was about 1.8 mm for both cases. Another way of determining resolution is to consider that the measured power reflectivity result is the convolution of a squared Gaussian cross section with a single rectangular pulse. The squared Gaussian cross section was stretched and compressed along the horizontal axis until the convolution result resembled the measured data. This final convolvement result is also shown in Fig. 11. Discrepancies between the measurements and the fit curves could be due to the sample not being a perfectly reflective stripe, excitation of higher-order modes in the FIR laser tube, or the beam having diffracted into higher order Gaussian modes in our multi-mirror system. According to Siegman, a center coupling hole in an FIR tube can introduce higher-order Hermite-Gaussian modes [25]. To match the measured 10% to 90% resolution value of 1.8 mm, the estimated beam diameter (2 · ω0) would be 1.8 mm, 35% wider than the theoretical value of (11). This is larger than the 1 mm interval used in scanning of the motorized platform (see Section II-I1), so the system therefore oversamples with regard to the point spread function (PSF). The power within one pixel is estimated to be 75% of the total. We note that the system is still expected to perform the task of locating margins of carcinomas within the specified accuracy of 1 mm.
Fig. 11.
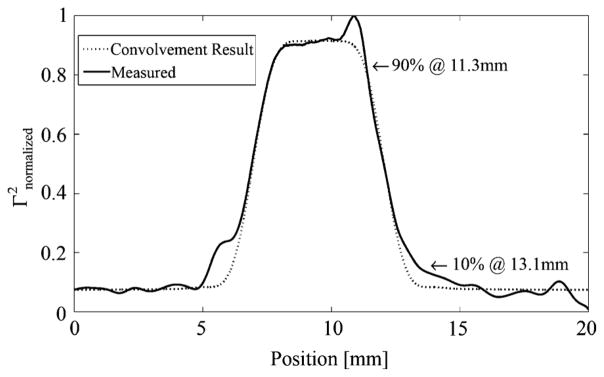
Horizontal resolution measurement.
K. Post-Processing
1) Technique and Calculations
Reflectivity is determined from THz measurements as described in Section II-E-1). Refractive index is then calculated from reflectivity using (10). Next, a projective planar transformation is applied to an optical photograph for image superposition as shown in Fig. 12, accounting for variations in orientation and position of the optical camera. For the projective transformation, six corresponding points were chosen between the optical and THz images. Most of the image processing was done with Matlab and the Image Processing Toolbox. Sample 7A is used as an example in this section.
Fig. 12.
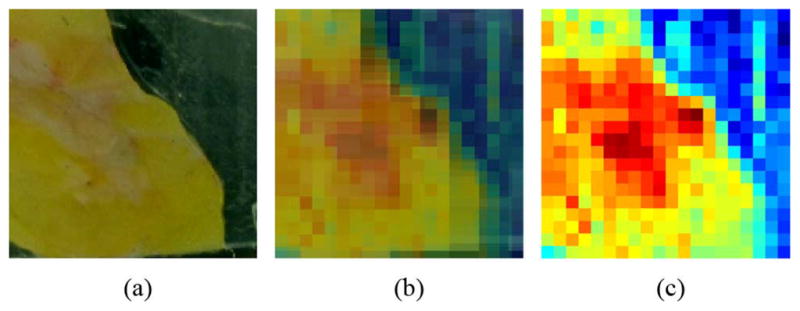
Superimposed optical and THz images of sample 7A (a) Optical. (b) Optical and THz. (c) THz.
The discrete-position measurement technique is used to produce images such as the rightmost image of Fig. 12. Smoothened versions of these images, which can be seen in the results section and in Fig. 14, are created with spline interpolation for ease of comparison with optical images. Suggestions for a more-advanced interpolation technique are provided in Section V-C.
Fig. 14.
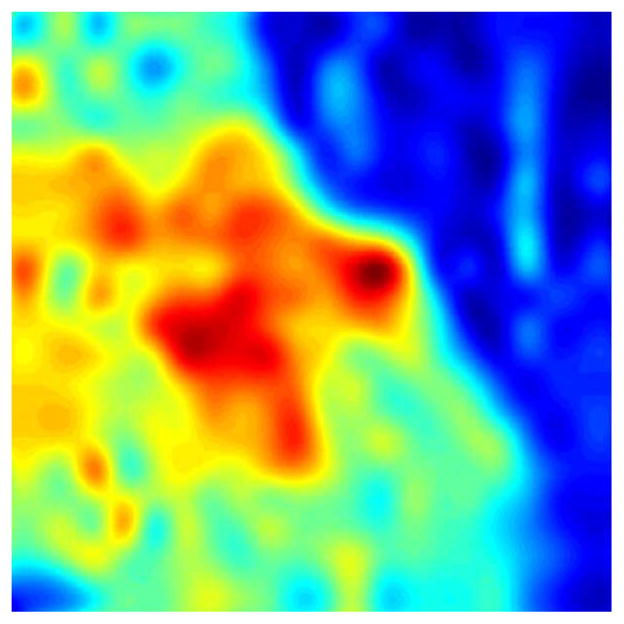
Spline interpolation, sample 7A.
A mask is created (Fig. 13) to exclude those pixels which are not part of the medical sample. The resolution matches the measurement grid, which is usually 20 mm by 20 mm.
Fig. 13.
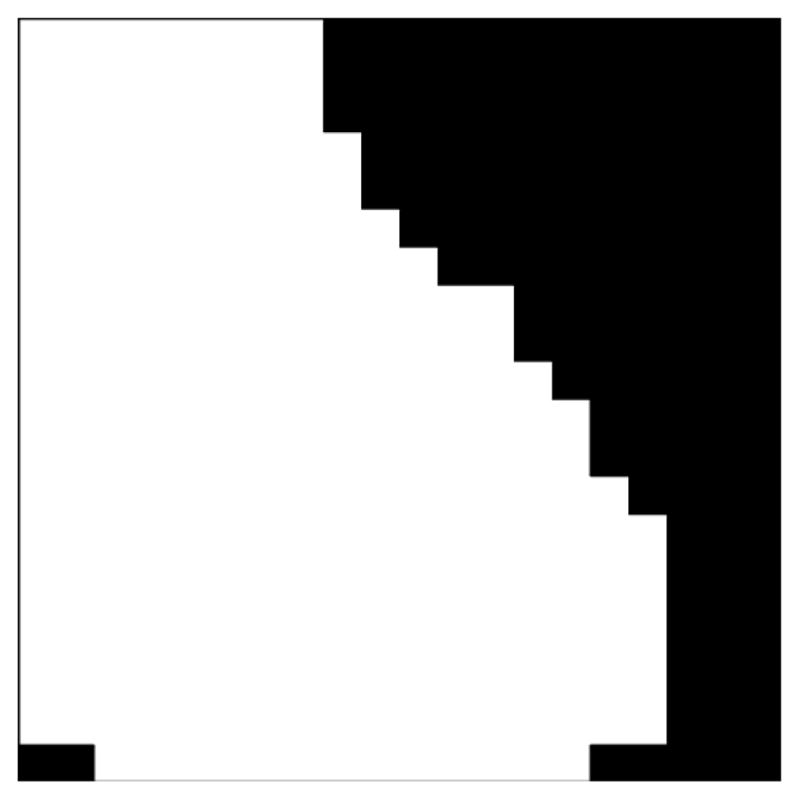
Off-sample mask, sample 7A.
Cancerous regions are identified using histological micrographs which have been annotated by surgical pathologists. An example of such a micrograph is shown in Fig. 15. Histological micrographs are made into maps, which are made into masks. A map is a mapping of cancerous regions, as determined by histology, onto the optical photograph taken at the time of THz measurement. Masks are made by applying a color thresholding algorithm to the maps and are regarded as the true references against which THz images must be compared. Maps and masks can be seen in the results in Section V, and also in Fig. 16.
Fig. 15.
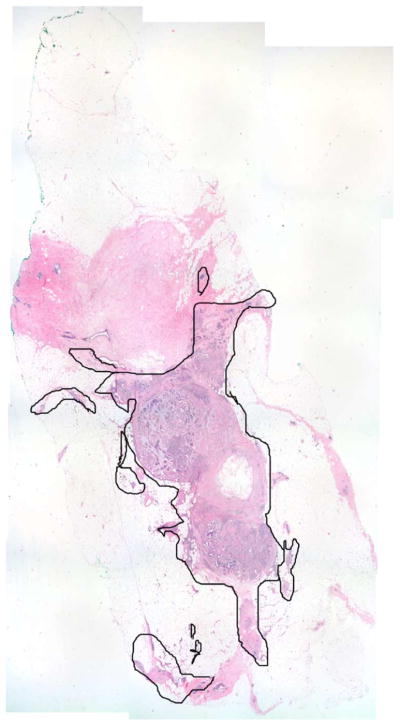
Histological micrograph.
Fig. 16.
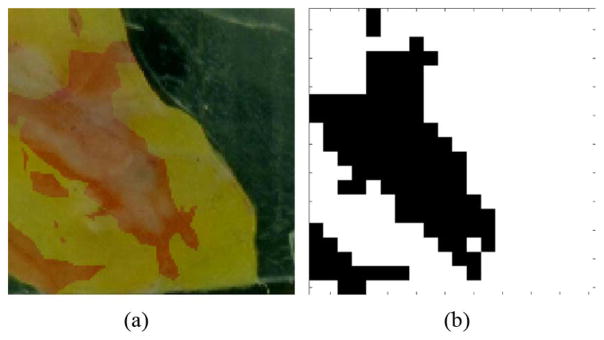
Map and mask. (a) Histology map. (b) Cancer mask.
Histology maps are made manually from micrographs with assistance from GNU Image Manipulation Program (GIMP) software. Simple projective transformations, of the type utilized for mapping THz images onto optical images, would have been inadequate for correction of the multi-dimensional squashing and stretching that occurs during the histology process.
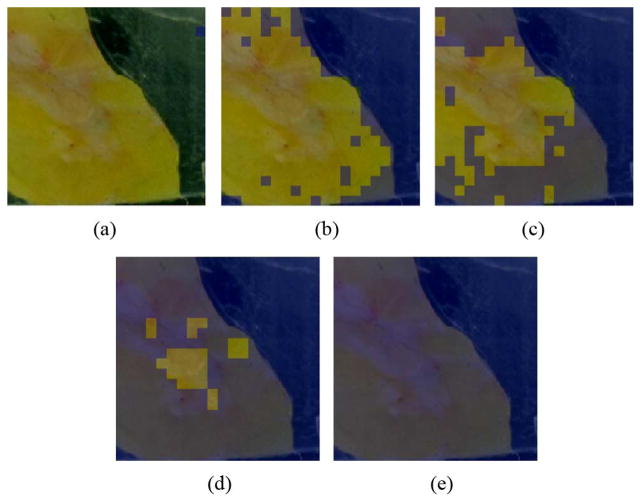
Because cancer is the most reflective of our tissue types, it suffices to set some limit, nthreshold, such that tissue is regarded as cancerous if nmeasured ≥ nthreshold. As this limit is varied, a succession of masks is created for comparison to, for example, the mask of Fig. 16.
Fig. 17(a) has the lowest nthreshold and identifies every pixel as a cancerous region. By doing this, the system has coincidentally classified every cancerous pixel as cancerous and so the true positive rate is 1. In other words, the sensitivity is 1.
Fig. 17.
Varying Refractive Index Threshold (a) nthres = 0.98 (b) nthres = 1.38 (c) nthres = 1.46 (d) nthres = 1.60 (e) nthres = 1.71.
Fig. 17(e) has the highest nthreshold and no cancer has been identified. By doing this, the system has coincidentally classified every non-cancerous pixel as non-cancerous and so the true negative rate is 1. In other words, the specificity is 1.
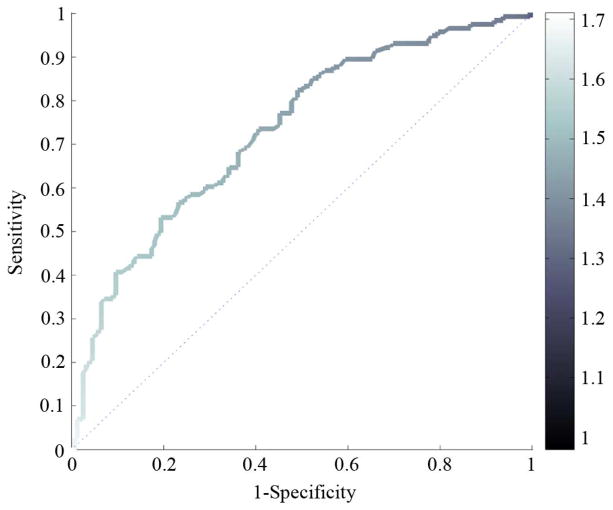
It is common to illustrate sensitivity and specificity using a receiver operating characteristic (ROC) plot as shown in Fig. 18. The medical community requires false positive rate (FPR) along the abscissa, which is equivalent to one minus the specificity. The refractive index threshold has been mapped to a color scale.
Fig. 18.
ROC with Color Mapping for nthreshold.
These plots are useful when, for example, we would like to know with 90% certainty that a malignant region of tissue will be identified by the test as being malignant. In the case of Fig. 18, we would know to set nthres to 1.43 by using the color code. At that operating point, we would expect (1-specificity) to be 0.6 = 60%, i.e., a 40% chance that a non-malignant region of tissue will be identified as non-malignant by the test. However, due to variations in refractive index values for the same tissue types across different samples, the usefulness of setting nthreshold using the ROC is limited.
A figure of merit for ROC plots is the area under the curve, sometimes called the discrimination. Discrimination is closer to 1 for systems having coincidentally high sensitivity and specificity.
III. Logistics and Practical Medical Sample Concerns
Clinical samples were transported from The University of Massachusetts Medical School (UMMS) in Worcester to UMass Amherst for THz processing while submerged in saline solution. This is true of all samples except 11A and 12A, which were preserved in formalin before THz measurement. After measurement, the samples were submerged in formalin and sent to a laboratory for histological analysis. The samples were generally in saline for one or two days before measurement. Also, the samples were refrigerated while at UMass Amherst. During measurement, the sample was in the sample holder of Section II-H for at least 45 minutes.
There are differences between the THz responses of fresh and necrotic tissue as documented by Png et al. [33]. Two ways of preserving samples without protein fixing are saline submersion and Hank’s buffer submersion. Hank’s buffer is a glucose-enriched buffer that approximates the environment that tissue would encounter in-vivo. We chose to use saline, which is commonly used at UMMS.
Too much time in saline destroys medical samples. Interestingly, the deterioration seems to happen in two opposite ways. One sample which had been in saline for more than a week turned soft and gelatinous. A similar sample, which had been in saline for the same amount of time, became harder. Although the reason for this is unknown, it is possible that the softer sample had a higher fat content or had experienced putrefaction as a result of bacterial growth.
One approach to the necrosis and saline problems is preservation of tissue in formalin. Formalin does what is known as cross linking of proteins, which prevents decomposition that could affect THz measurements [34]. However, analysis of formalin-fixed samples might not be useful in regards to the eventual goal of having an operating room device.
Residual hydration is another concern. Since it is hypothesized that water is the bio-marker, handling of samples before THz measurement is critical to consistent measurement results. This problem is further complicated by the fact that dehydration rates vary according to tissue type, with denser tissues drying more slowly [35]. One solution is lyophilization or freeze-drying [33]. Lyophilization preserves freshness while removing water. However, this would be impractical for the eventual goal of operating room use and difficult or impossible to use with the necessary quartz sample cover.
IV. Results
Initially, phantom materials allowed for test and development of the system without using valuable medical samples [29], [36]. The phantom materials were typically deli meats. These showed some contrast, but were not useful for quantitative system evaluation due to a lack of comparative data in the literature. After considerable system development, usable results began with the seventh medical sample.
Only one side of each specimen received THz and histological analysis. Marked and unmarked histology slides for those samples, along with large-scale THz images, are available as part of a thesis through the UMass Scholarworks system (http://scholarworks.umass.edu/) [36].
The measured refractive index was higher for cancerous tissue than for non-cancerous tissue (except for Sample 8A), as expected [5], [6]. However, average refractive index values, as determined by the THz setup and shown in Table IV, were generally lower than the values expected from earlier TPI work ([20]; see Table II). Reasons for this, which might include sample hydration levels, are considered in the Conclusion section. Sample hydration is important because it is believed that the increased amount of interstitial fluid resulting from angiogenesis affects THz absorption [6], [37]. Angiogenesis, the physiological process through which new blood vessels form from pre-existing vessels, is a fundamental step in the transition of tumors from dormant to malignant states. Whether and how other structural differences in cancerous tissue affect reflectivity is a subject requiring further study.
TABLE IV.
Mean Values of Cancerous and Non-Cancerous Pixel Refractive Indices
| Sample | Cancerous Pixel Mean | Non-Cancerous Pixel Mean | Diagnosis |
|---|---|---|---|
| 7A | 1.523 | 1.452 | Invasive Ductal Carcinoma (Grade II) |
| 8A | 1.705 | 1.717 | Invasive Ductal Carcinoma (Grade II) |
| 9A | 1.674 | 1.572 | Invasive Ductal Carcinoma (Grade II) |
| 10A | 1.956 | 1.882 | Invasive Ductal Carcinoma (Grade I) |
| 11A | 1.912 | 1.772 | Invasive Ductal Carcinoma (Grade II) |
| 12A | 1.740 | 1.614 | Invasive Lobular Carcinoma |
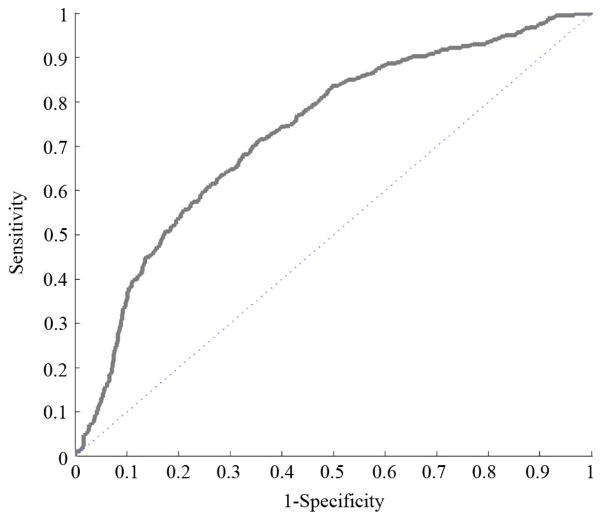
Measurements from all six medical samples were combined to create the ROC of Fig. 20. This ROC was made by combining refractive index images and masks as shown in Fig. 19, then using the same post-processing technique for those compound files as for the files of individual samples.
Fig. 20.
Compound ROC (72% discrimination).
Fig. 19.
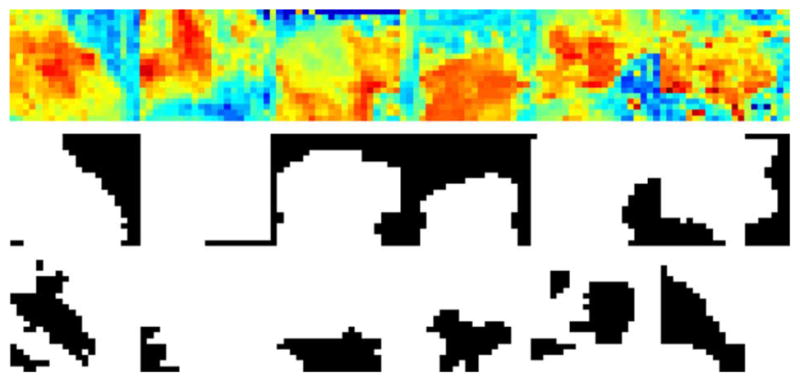
Compound normalized refractive index, off-sample mask, and cancer mask for samples 7A, 8A, 9A, 10A, 11A, and 12A.
Refractive index was normalized across samples by subtracting respective means and dividing by respective standard deviations. Consequently, there is no valid refractive index color mapping in the ROC of Fig. 20. Lack of valid refractive index thresholds across multiple samples is a problem that remains to be solved, as discussed in the Conclusion section. ROC plots for individual samples, with the exception of Sample 8A, are qualitatively similar to this compound ROC. A potential reason for Sample 8A results being different from the rest is given in the Conclusion section. The discrimination values for each separate ROC are shown in Table V.
TABLE V.
ROC Discrimination
| Sample | Discrimination |
|---|---|
| 7A | 72% |
| 8A | 45% |
| 9A | 78% |
| 10A | 76% |
| 11A | 71% |
| 12A | 73% |
For some measurements, slight reshaping of areas marked as cancerous by pathologists would have substantially improved discrimination values. For example, sensitivity would have increased if the area marked with A in Fig. 21 had been identified as cancerous by histology. Likewise, specificity would have increased if the area marked with B in Fig. 22 had been identified as non-cancerous by histology.
Fig. 21.
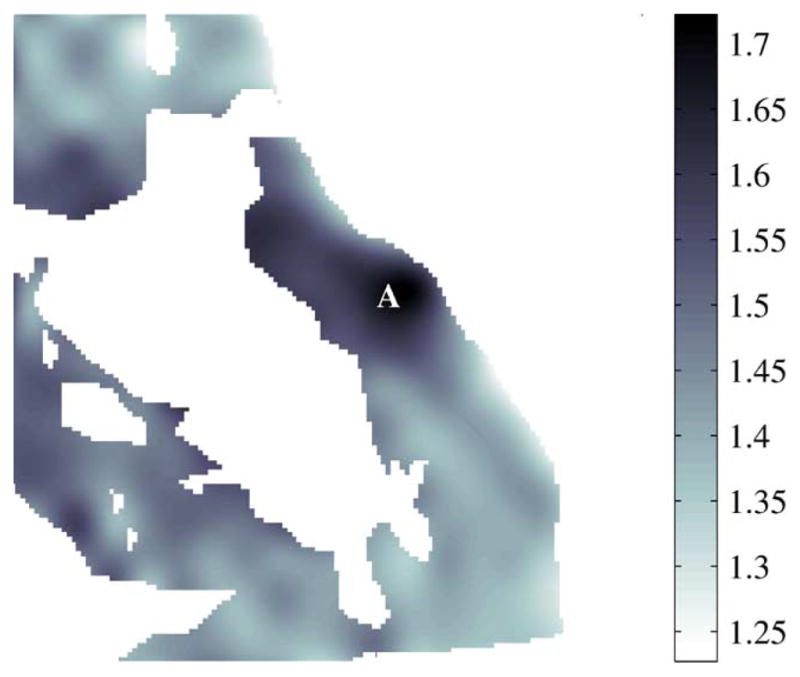
Refractive index of non-cancerous areas, 7A.
Fig. 22.
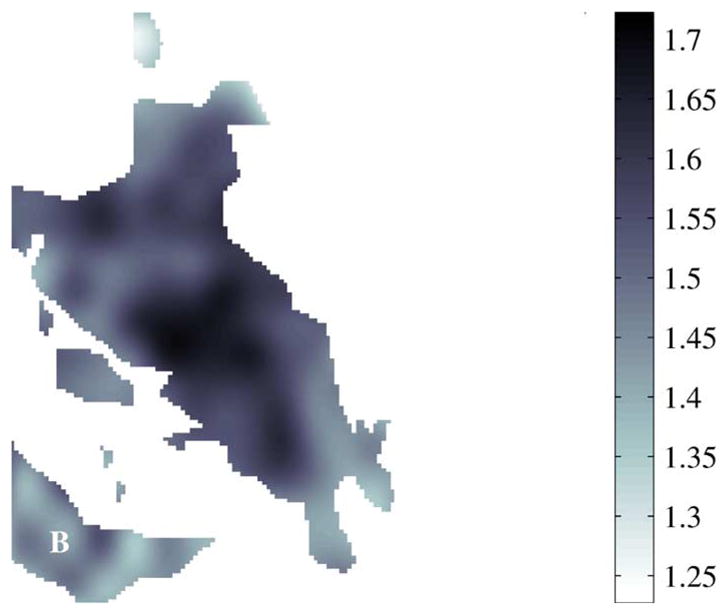
Refractive index of cancerous areas, 7A.
By collecting the cancerous and non-cancerous pixels from the six normalized images, distributions can be plotted to illustrate the difficulty level with which each pixel may be classified. The probability mass function (PMF) of the combined result is shown in Fig. 23.
Fig. 23.
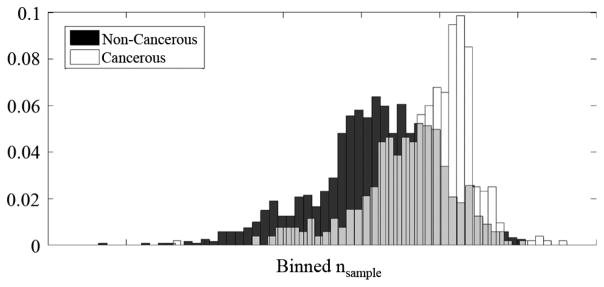
Distribution of cancerous and non-cancerous pixels.
V. Conclusion
A. Contributions of This Project
An apparatus has been designed and built which uses power reflectivity measurements at 1.89THz to locate cancer in excised human breast tissue samples. This system is able to use SFTI techniques to provide absolute refractive index values of such specimens for the first time. This pilot project will hopefully contribute to the long-term goal of helping patients by encouraging future SFTI projects in the field.
B. Evaluation of System Capability
As noted in the Results section, one way of summarizing the effectiveness of this imaging setup is with discrimination values from the receiver operating characteristic (ROC) curves. The discrimination mean of about 73% (excluding Sample 8A) is comparable to what was obtained for the best single parameter when using the TPI technique [6]. For clinical usage, doctors at the University of Massachusetts Medical School recommend specificity and sensitivity values of at least 90%. This requirement is roughly equivalent to a 90% discrimination value as could be demonstrated with an ROC plot composed of two line segments. TPI researchers have been able to increase discrimination values by employing support vector machines (SVM) and principal component analysis (PCA) involving as many as 10 parameters [6]. Similar improvement may be expected from SFTI if several parameters are analyzed.
Sample 8A was the only sample to give a discrimination value of less than 70%. A potential reason for this is that the tissues measured by the THz setup were shaved-away during the histological micrograph preparation. Other conclusions include the following:
Mean refractive index results, as shown in Table IV, indicate that malignant tissue has consistently and significantly higher refractive index than benign tissue and especially adipose tissue. This is in agreement with previous TPI results [5], [6].
Refractive index thresholds vary between samples. This might be caused by any of several possible reasons. 1) The samples might not have been handled and prepared identically. However, nthres was different for Sample 9A and Sample 10A although they were excised together and imaged consecutively. For a 90% sensitivity level, nthres would be 1.55 for Sample 9A but 1.9 for Sample 10A. 2) Different samples might have reacted differently to time in saline solution. An instance of this was mentioned in Section III. Also, we note that the TPI data were generally obtained from freshly cut samples without immersion in any liquid. 3) There may be real differences between SFTI and TPI, especially since the TPI data at our frequency of 1.89THz are at the upper end of the useful range of the TPI technique. This might be tested by performing SFTI imaging at frequencies lower than 1.89THz. 4) The need for the correction factor mentioned in Section II-G2 may indicate subtle optical problems necessitating further investigation. 5) Although the Rayleigh range should be 7 mm as calculated in Section II-C2, there may be small variations in the sample position which must be controlled.
The system sometimes has trouble differentiating carcinoma from benign dense fibrous tissue. This is probably because, as can be seen in Table II, these tissues have refractive index differences of only a few percent. A solution to this problem might be to increase the signal-to-noise ratio of the system, for which some ideas are presented in Section V-C.
Needle biopsy nectrotic fat is falsely identified as cancer tissue.
C. Future Work Suggestions
In general, THz imaging technology lags behind other imaging modalities such as MRI, Raman spectroscopy, and confocal microscopy. One way to proceed in the further development of SFTI is to combine THz imaging with other imaging techniques that might make it a more competitive tool to aid in cancer diagnosis. An example of this, albeit at optical frequencies, is the work of Patel et al., which combines dye-enhanced macroscopic polarization imaging with multimodal confocal microscopy for the detection of breast cancer [38]. Other suggestions for more short-term future work include additional continuous-velocity measurements, quartz surface normalization, polarization measurements, additional phantom experiments, additional measurements of ethanol solutions, measurements at multiple discrete frequencies, and normalization of hydration differences between samples.
Logistics might somehow be streamlined such that samples would not need to spend time in saline or formalin before THz imaging. This would address two of the four concerns in the second item of Section V-B.
There are filtering techniques that can use the point spread function (PSF) to improve the THz images, two of which are the Wiener–Kolmogorov and Richardson-Lucy algorithms. These would be especially useful if the current setup were adapted to use the continuous-velocity measurement technique, which could collect thousands of points rather than the current discrete-position measurement grid of 400 points for a typical 20 mm by 20 mm sample. With the modulation frequency set to 10Hz, there is some doubt as to whether continuous-velocity measurements could be accomplished in a practical amount of time. However, modulation frequency, platform velocity, and time constant could be experimentally adjusted in the mature setup. If necessary, the pyroelectric detector could be replaced with a detector having a faster response. Another possibility is a double modulation scheme in which low and high modulation frequencies, for accommodation of both detectors, would be simultaneously present.
A technique could be devised for the normalization of potential quartz surface aberrations. Calculation shows that, at our operating point, a difference of only a few micrometers could significantly effect measurements [36]. Unfortunately, sample cover position and orientation have not been consistent and so this could not easily be retroactively applied.
The system might be modified to measure polarization of the reflected beam, in hopes that a difference might be detected between healthy and cancerous tissue. This type of method was employed at optical frequencies by Patel et al. [38]. As far as we know, there are no published results related to such effects at THz frequencies. These effects could potentially occur due to differences in microscopic structure between tissues.
It is possible that some phantom recipes did not work because the THz system was in an immature state. This could be revisited.
Ethanol and water solutions, each having a different known dielectric constant as explained in Section II-E2, could be measured for verification or enhancement of the refractive index mapping in Section II-G2. Multiple measurements could be made within the expected medical sample ranges of refractive index.
Measuring samples at multiple discrete frequencies might improve tissue characterization. Such a multiple parameter space might be conceptually similar to the work of Fitzgerald et al. [6].
The system combines two calibration techniques. Absolute values are found by calibration with a silicon wafer, and fluctuations of the laser source are normalized by the simultaneous usage of two detectors. A third calibration scheme might be included to account for hydration differences across samples. This might involve timing various sample preparation phases or somehow measuring sample hydration immediately before THz measurement.
Finally, we return to the long-range future potential of SFTI technology as mentioned in the introduction. THz cameras with up to 10,000 pixels have recently been developed based on low-cost CMOS technology [15]. Such cameras can produce video rate images and are compatible with the SFTI technology described in this paper. CMOS THz cameras can be made as small as standard optical digital cameras and thus would consume little space in an operating room. In high volume production, CMOS THz cameras will be orders of magnitude less expensive than TPI technology such as the TPI probe presented by Ashworth et al. [39]. The remaining problem is to develop a correspondingly low-cost and compact THz source. The next stage of SFTI may employ THz multiplier sources that are now commercially available and much more compact than our gas laser. Ultimately, an SFTI system for clinical use would require something from a future generation of THz sources, such as for example the one described by Muthee et al. [40].
Acknowledgments
This work was supported by the National Cancer Institute under Award 1R21CA143660. The content is solely the responsibility of the authors and does not necessarily represent the official views of the National Cancer Institute or the National Institutes of Health. This work was funded by an R21 grant from the NIH National Institute of Biomedical Imaging and Bioengineering (NIBIB) under Grant 1R21CA143660–01A1.
The authors wish to thank Dr. D. Gupta, of NewLans Technology and Adjunct Professor of Electrical and Computer Engineering, University of Massachusetts, Amherst, for his early support in this effort.
Biographies
 Benjamin A. St. Peter received the B.S. degree from the University of Maine in 2003, and the M.S. from the University of Massachusetts/Amherst in 2012, both in electrical engineering.
He was a research assistant in the Microwave Remote Sensing (MIRSL) and THz laboratories with the University of Massachusetts/Amherst. He has worked in industry as an RF Engineer and also as a software developer. His research interests include medical imaging, adaptive optics and vision science.
 Sigfrid K. Yngvesson (M’62–SM’92–F’98–LF’02) received the Civilingenjor, Tekn. Lic., and Tekn. Dr. degrees in electrical engineering from Chalmers University of Technology, Göteborg, Sweden., in 1958, 1965, and 1968, respectively.
Since 1970, he taught in the Department of Electrical and Computer Engineering at the University of Massachusetts/Amherst, becoming a full professor in 1978, and Professor Emeritus in 2006. His research work has included low-noise receivers for radio astronomy, and integrated antenna arrays. His present main research interests are applications of nano-technology to the terahertz field as well as terahertz imaging for biomedical applications.
Dr. Yngvesson is a life fellow of the IEEE.
 Paul Siqueira (S’92–M’96) is an Associate Professor of Electrical and Computer Engineering at the University of Massachusetts in Amherst, MA, USA, where he is co-director of the Microwave Remote Sensing Laboratory (MIRSL) and Director of the department’s Biomedical Sensing and Signal Processing center (BIOSSP). Prior to joining the university, he was a senior engineer in the Radar Science and Engineering section at NASA’s Jet Propulsion Laboratory, where he was a system engineer working in the laboratory’s Radar Science and Engineering Section. He is well known for his work in microwave system development, applied signal processing and analytic modeling of electromagnetic fields.
Dr. Siqueira is a recipient of a Harvard University Bullard Fellowship for forest studies and is a Science Team member for NASA’s DESDynI mission, an L-band SAR meant to launch before the end of the decade.
 Patrick A. Kelly (S’81–M’84) received the B.S.E degree in electrical engineering and computer science from Princeton University, Princeton, NJ in 1978, and the M.S.E degree in electrical engineering and the Ph.D. degree in computer, information and control engineering from the University of Michigan, Ann Arbor, MI, USA, in 1979 and 1985, respectively.
He is currently an Associate Professor with the Department of Electrical and Computer Engineering at the University of Massachusetts, Amherst, MA, USA. His research interests include processing of biomedical signals and images.
 Ashraf Khan received the M.B.B.S. medical degree from Jawaharlal Nehru Medical College, AMU, Aligarh, India, in 1980, following which he completed postgraduate training in pathology at the same institution, receiving the M.D. (Pathology) degree in 1983. In 1985, Dr. Khan moved to the U.K., where he trained in histopathology at the Lewisham and Guy’s Hospital, University of London, U.K., and received the MRCPath (Histopathology) degree in 1991.
He is a currently Professor of Pathology and Director of Surgical at University of Massachussetts (UMass) Memorial Medical Center and the University of Massachusetts Medical School (UMMS), Worcester, MA, USA. In 1993, joined the Department of Pathology at UMMS, first as a surgical pathology fellow for one year, and later, in 2005, as a faculty member progressing to the rank of full Professor of Pathology. His translational research interests include investigating biomarkers for the diagnosis and outcome prediction of thyroid and breast cancers, as well as evaluating various imaging modalities in the diagnosis of breast cancer.
In 1999, Dr. Khan became a Fellow of the Royal College of Pathologists, London, U.K.
 Stephen J. Glick received the B.S.E.E. degree in electrical engineering from University of Vermont, Burlington, VT, USA, in 1982, and the Ph.D. degrees in biomedical engineering from Worcester Polytechnic Institute, Worcester, MA, USA, in 1988 and 1991, respectively.
He is currently a Professor with the Department of Radiology, University of Massachusetts Medical School, Worcester, MA, USA. His research interests include medical imaging with a focus on imaging of breast cancer.
 Andrew Karellas received the Ph.D. degree in medical physics from the University of California, Los Angeles, CA, USA.
He is a Professor of Radiology and Director of Radiological Physics at the University of Massachusetts Medical School, Worcester, MA, USA. He has published extensively on novel X-ray imaging techniques. His current research interests are on the development of new X-ray imaging techniques that include tomographic imaging of the breast, and fusion between tomographic X-ray and optical imaging of the breast.
Dr. Karellas is a Fellow of the American Association of Physicists in Medicine and of the American College of Radiology.
Footnotes
Almaz Optics Inc., Marlton, NJ, USA. [Online] Available: http://www.almazoptics.com/quartz.htm
Color versions of one or more of the figures in this paper are available online at http://ieeexplore.ieee.org.
Contributor Information
Benjamin St. Peter, Department of Electrical and Computer Engineering, The University of Massachusetts, Amherst, MA 01003 USA.
Sigfrid Yngvesson, Email: yngvesson@ecs.umass.edu, Department of Electrical and Computer Engineering, The University of Massachusetts, Amherst, MA 01003 USA.
Paul Siqueira, Department of Electrical and Computer Engineering, The University of Massachusetts, Amherst, MA 01003 USA.
Patrick Kelly, Department of Electrical and Computer Engineering, The University of Massachusetts, Amherst, MA 01003 USA.
Ashraf Khan, University of Massachusetts Medical School, Worcester, MA 01655 USA.
Stephen Glick, University of Massachusetts Medical School, Worcester, MA 01655 USA.
Andrew Karellas, University of Massachusetts Medical School, Worcester, MA 01655 USA.
References
- 1.Siegel P. Terahertz technology in biology and medicine. IEEE Trans Microw Theory Techn. 2004 Oct;52(10):2438–2447. [Google Scholar]
- 2.Mittleman D. Sensing with Terahertz Radiation. New York: Springer-Verlag; 2003. [Google Scholar]
- 3.Woodward R, Wallace V, Arnone D, Linfield E, Pepper M. Terahertz pulsed imaging of skin cancer in the time and frequency domain. J Biol Phys. 2003;29(2):257–259. doi: 10.1023/A:1024409329416. [DOI] [PMC free article] [PubMed] [Google Scholar]
- 4.Calvin Y, Fan S, Sun Y, Pickwell-MacPherson E. The potential of terahertz imaging for cancer diagnosis: A review of investigations to date. Quant Imag Med, Surgery. 2012;2:33–45. doi: 10.3978/j.issn.2223-4292.2012.01.04. [DOI] [PMC free article] [PubMed] [Google Scholar]
- 5.Fitzgerald AJ, Wallace VP, Jimenez-Linan M, Bobrow L, Pye RJ, Purushotham AD, Arnone DD. Terahertz pulsed imaging of human breast tumors. Radiology. 2006 May;239(2):533–540. doi: 10.1148/radiol.2392041315. [DOI] [PubMed] [Google Scholar]
- 6.Fitzgerald A, Pinder S, Purushotham AD, O’Kelly P, Ashworth PC, Wallace VP. Classification of terahertz-pulsed imaging data from excised breast tissue. J Biomed Opt. 2012 Jan;17(1):016005-1–10. doi: 10.1117/1.JBO.17.1.016005. [DOI] [PubMed] [Google Scholar]
- 7.Pickwell-MacPherson E, Lo T, Fitzgerald A, Provenzano E, Pinder S, Purushotham A, Wallace V. Application of finite difference time domain methods to terahertz spectroscopy measurements of breast cancer. IEEE MTT Symp; Honolulu, HI, USA. 2007. pp. 1379–1381. [Google Scholar]
- 8.Wilmink GJ, Rivest BD, Roth C, Ibey BL, Payne JA, Cundin LX, Grundt JE, Peralta X, Mixon DG, Roach WP. In vitro investigation of the biological effects associated with human dermal fibroblasts exposed to 2.52 THz radiation. Lasers in Surgery Med. 2011;43:152–163. doi: 10.1002/lsm.20960. [DOI] [PubMed] [Google Scholar]
- 9.Siegel PH, Pikov V. THz in biology and medicine: Towards quantifying and understanding the interaction of millimeter and sub-millimeter waves with cells and cell processes. Proc SPIE. 2010;7562 [Google Scholar]
- 10.Jacobs L. Positive margins: The challenge continues for breast surgeons. Ann Surgical Oncol. 2008 Mar;15(5):1271–1272. doi: 10.1245/s10434-007-9766-0. [DOI] [PMC free article] [PubMed] [Google Scholar]
- 11.McCahill LE, Single RM, Bowles EJA, Feigelson HS, James TA, Barney T, Engel JM, Onitilo AA. Variability in re-excision following breast conservation surgery. J AMA. 2012;307(5):467–475. doi: 10.1001/jama.2012.43. [DOI] [PubMed] [Google Scholar]
- 12.Bijker N, Peterse JL, Duchateau L, Julien JP, Fentiman IS, Duval C, Palma SD, Simony-Lafontaine J, de Mascarel I, van der Vijver MJ. Risk factors for recurrence and metastasis after breast-conserving therapy for ductal carcinoma in-situ: analysis of European organization for research and treatment of cancer trial 10853. J Clinic Oncol. 2001;19:2263–2271. doi: 10.1200/JCO.2001.19.8.2263. [DOI] [PubMed] [Google Scholar]
- 13.Singletary S. Surgical margins in patients with early stage breast cancer treated with breast conservation therapy. Amer J Surgery. 2002;184:383–393. doi: 10.1016/s0002-9610(02)01012-7. [DOI] [PubMed] [Google Scholar]
- 14.Keskek M, Kothari M, Ardehali B, Betambeau N, Nasiri N, Gui GP. Factors predisposing to cavity margin positivity following conservation surgery for breast cancer. Eur J Surgical Oncol. 2004;30:1058–1064. doi: 10.1016/j.ejso.2004.07.019. [DOI] [PubMed] [Google Scholar]
- 15.Öjefors E, Pfeiffer U, Lisauskas A, Roskos H. A 0.65 THz focal-plane array in a quarter-micron CMOS process technology. IEEE J Solid-State Circuits. 2009 Jul;44(7):1968–1976. [Google Scholar]
- 16.Joseph C, Yaroslavsky A, Neel V, Goyette T, Giles R. Continuous wave terahertz transmission imaging of non-melanoma cancers. Lasers in Surgery and Medicine. 2012;43:457–462. doi: 10.1002/lsm.21078. [DOI] [PubMed] [Google Scholar]
- 17.Joseph C, Yaroslavsky A, Neel V, Goyette T, Giles R. Continuous-wave terahertz reflection imaging of ex-vivo nonmelanoma skin cancers. Proc SPIE. 2012;8261 doi: 10.1002/lsm.21078. [DOI] [PubMed] [Google Scholar]
- 18.Gerecht E, Yngvesson S, Nicholson J, Zhuang Y, Morales FR, Zhao X, Gu D, Zannoni R, Coulombe M, Dickinson J, Goyette T, Gorveatt W, Waldman J, Khosropanah P, Groppi C, Hedden A, Golish D, Walker C, Kooi J, Chamberlin R, Stark A, Martin C, Stupak R, Tothill N, Lane A. Deployment of TREND—a low noise receiver user instrument at 1.25 THz to 1.5 THz for AST/RO at the South Pole. 14th Int. Symp. Space THz Technol; Tucson, AZ, USA. Apr. 2003. [Google Scholar]
- 19.Douglas NG. Millimetre and Submillimetre Wavelength Lasers: A Handbook of CW Measurements. Amsterdam, the Netherlands: Springer-Verlag; 1989. [Google Scholar]
- 20.Ashworth PC, Pickwell-MacPherson E, Provenzano E, Pinder SE, Purushotham AD, Pepper M, Wallace VP. Terahertz pulsed spectroscopy of freshly excised human breast cancer. Opt Express. 2009 Jul;17(15):12 444–12 454. doi: 10.1364/oe.17.012444. [DOI] [PubMed] [Google Scholar]
- 21.IntraAction. Model AG-406B21 Infrared Acousto-Optic Modulator Instruction Manual. [Google Scholar]
- 22.Zhao X. Master’s thesis. Univ. Massachusetts; Amherst, MA, USA: 2005. Integrated antennas for THz hot electron bolometer mixers. [Google Scholar]
- 23.Goldsmith PF. Quasioptical Systems: Gaussian Beam Quasioptical Propagation and Applications. New York: IEEE Press; 1998. [Google Scholar]
- 24.Zhang X, Xu J. Introduction to THz Wave Photonics. New York: Springer; 2009. [Google Scholar]
- 25.Siegman AE. Lasers. Mill Valley, CA, USA: University Science Books; 1986. [Google Scholar]
- 26.Demtröder W. Laser Spectroscopy: Basic Concepts and Instrumentation. 3. New York: Springer; 2003. [Google Scholar]
- 27.Molectron Detector, Inc. P4–40 Low Noise Instruments. :4–30. [Online]. Available: http://www.coherent.com/downloads/P430P440DataSheet.pdf.
- 28.Ji M, Musante C, Yngvesson S, Gatesman A, Waldman J. Study of parylene as anti-reflection coating for silicon optics at THz frequencies. Proc. 11th Int. Symp. Space THz Technol. ISSTT); Ann Arbor, MI, USA. May 2000; pp. 398–406. [Google Scholar]
- 29.Yngvesson S, St Peter B, Siqueira P, Kelly P, Glick S, Karellas A, Khan A. Feasibility demonstration of frequency domain terahertz imaging in breast cancer margin determination. SPIE Photon. West Conf; Jan. 2012; [DOI] [PMC free article] [PubMed] [Google Scholar]
- 30.Ulaby F. Fundamentals of Applied Electromagnetics. 5. Upper Saddle River, NJ, USA: Pearson Prentice Hall; 2006. [Google Scholar]
- 31.Jagannathan A, Gatesman AJ, Giles RH. Characterization of roughness parameters of metallic surfaces using terahertz reflection spectra. Opt Lett. 2009 Jul;34(13):1927–1929. doi: 10.1364/ol.34.001927. [DOI] [PubMed] [Google Scholar]
- 32.Jepsen P, Moller U, Merbold H. Investigation of aqueous alcohol and sugar solutions with reflection terahertz time-domain spectroscopy. Opt Express. 2007;15(22):14 717–14 737. doi: 10.1364/oe.15.014717. [DOI] [PubMed] [Google Scholar]
- 33.Png G, Choi J, Ng B, Mickan S, Abbott D, Zhang X. The impact of hydration changes in fresh bio-tissue on THz spectroscopic measurements. Phys Med Biol. 2008;53:3501–3501. doi: 10.1088/0031-9155/53/13/007. [DOI] [PubMed] [Google Scholar]
- 34.Bruce-Gregorios J. Histopathologic Techniques. Quezon City, Philippines: Goodwill Trading Co., Inc; [Google Scholar]
- 35.Knobloch P, Schildknecht C, Kleine-Ostmann T, Koch M, Hoffmann S, Hofmann M, Rehberg E, Sperling M, Donhuijsen K, Hein G. Medical THz imaging: an investigation of histo-pathological samples. Phys Med Biol. 2002;47:3875. doi: 10.1088/0031-9155/47/21/327. [DOI] [PubMed] [Google Scholar]
- 36.St Peter B. Master’s thesis. Univ. Massachussetts; Amherst, MA, USA: 2012. Terahertz imaging for cancer detection. [Google Scholar]
- 37.Reid CB, Fitzgerald A, Reese G, Goldin R, Tekkis P, O’Kelly PS, Pickwell-MacPherson E, Gibson AP, Wallace VP. Terahertz pulsed imaging of freshly excised human colonic tissues. Phys Med Biol. 2011 Jun;56:4333–4353. doi: 10.1088/0031-9155/56/14/008. [DOI] [PubMed] [Google Scholar]
- 38.Patel R, Khan A, Wirth D, Kamionek M, Kandil D, Quinlan R, Yaroslavsky AN. Multimodal optical imaging for detecting breast cancer. J Biomed Opt. 2012 Jun;17(6):066008-1–9. doi: 10.1117/1.JBO.17.6.066008. [DOI] [PubMed] [Google Scholar]
- 39.Ashworth PC, O’Kelly P, Purushotham AD, Pinder SE, Kontos M. An intra-operative THz probe for use during the surgical removal of breast tumors. Int Conf Infrared, Millim Waves THz Technol. 2008 Sep; [Google Scholar]
- 40.Muthee M, Carrion E, Nicholson J, Yngvesson SK. Antenna-coupled terahertz radiation from joule-heated single-wall carbon nanotubes. AIP Adv. 2011;1(042131) [Google Scholar]


