

Abstract
Anthropogenic CO2 is a major driver of current environmental change in most ecosystems1, and the related ocean acidification (OA) is threatening marine biota2. With increasing pCO2, calcification rates of several species decrease3, although cases of up-regulation are observed4. Here, we show that biological control over mineralization relates to species abundance along a natural pH gradient. As pCO2 increased, the mineralogy of a scleractinian coral (Balanophyllia europaea) and a mollusc (Vermetus triqueter) did not change. In contrast, two calcifying algae (Padina pavonica and Acetabularia acetabulum) reduced and changed mineralization with increasing pCO2, from aragonite to the less soluble calcium sulphates and whewellite, respectively. As pCO2 increased, the coral and mollusc abundance was severely reduced, with both species disappearing at pH < 7.8. Conversely, the two calcifying and a non-calcifying algae (Lobophora variegata) showed less severe or no reductions with increasing pCO2, and were all found at the lowest pH site. The mineralization response to decreasing pH suggests a link with the degree of control over the biomineralization process by the organism, as only species with lower control managed to thrive in the lowest pH.
Several studies on the influence of pH on crystallography and texture of calcified regions are ex situ, short-term experiments on isolated organisms5, providing important information, but unrepresentative of natural ecosystems and failing to assess long-term effects6. There is a great need of long-term analyses on OA effects on marine ecosystems acclimated to high pCO2, as found around CO2 vents. Vents are not perfect predictors of future oceans, owing to pH variability, proximity of unaffected populations, and co-varying environmental parameters7. However, vents acidify seawater on sufficiently large temporal and spatial scales to integrate ecosystem processes6, acting as “natural laboratories”. In Papua New Guinea vents, reductions in coral diversity, recruitment, abundance, and shifts in competitive interactions are found8. In Mediterranean vents, decreased diversity, biomass, trophic complexity, and abundance in many calcifying and non-calcifying organisms, and increases in macroalgae and seagrasses are observed7,9,10.
We assessed, along a natural pH gradient, the effect of pCO2 on the mineralization and abundances of the aragonitic scleractinian B. europaea, the aragonitic tube-forming gastropod V. triqueter, the brown alga P. pavonica, which deposits aragonite on the thalli surface, the green alga A. acetabulum, whose cups’ outer surfaces are calcified with aragonite and a small amount of whewellite (calcium oxalate), and the non-mineralized brown alga L. variegata. The mineralization is biologically controlled in V. triqueter (i.e., mineral is deposited in confined nucleation sites under complete biological control with minimal environmental effects), biologically induced in P. pavonica and A. acetabulum (i.e., it is strongly affected by the environment with minimal biological control), wheras B. europaea may represent an intermediate and still controversial situation11. We aimed to assess, for the first time, changes in the mineralization and abundance of species along a pCO2 gradient in relation to their control over biomineralization.
Seawater chemistry
Mean pH, CO2, saturation of calcite (Ωcalc), and of aragonite (Ωarag) differed among Sites (Kruskal-Wallis test/ANOVA, p < 0.001). The median pH values were 8.1 (Site 1), 7.9 (Site 2), 7.8 (Site 3) and 7.7 (Site 4), with increasing variability towards Site 4 (Fig. 1; Fig. S1; Table S1).
Fig. 1.

Range in pHTS and mean percentage cover of Balanophyllia europaea, Vermetus triqueter, Padina pavonica, Acetabularia acetabulum and Lobophora variegata along the pCO2 gradient. pH measures were 103-110 per Site. Horizontal bars indicate the median pH. Error bars are 95% confidence intervals.
Mineralogy
Aragonite was the only mineral phase in B. europaea skeletons (Fig. S2). Organic matrix (OM) content was homogeneous among Sites (Kruskal-Wallis test, p > 0.05; Fig. S3; Table 1). Skeletal texture displayed fibers evolving from a center of calcification (Fig. S4), but the morphology of these centers, and fiber thickness (600 ± 200 nm) were not related to pCO2 (Fig. S5). Hardness was homogeneous among sample regions and study Sites (5100 ± 600 MPa). The elastic Young’s modulus decreased (i.e., the skeleton became less stiff) along the aboral to oral direction and was lower at Sites 2 and 3 than at Site 1 (Table S2). Crystal quality and fiber thickness usually increases when crystallization occurs under lower supersaturation12. While a reduction of precipitation rate with pCO2 could increase crystal quality, other mechanisms could involve OM molecules. Corals appear to maintain a high pH at the nucleation sites within the calicoblastic layer, possibly expending significant amount of energy13. This is supported by the lack of increase in aragonite fiber thickness with decreasing seawater Ωarag, which would be expected if Ωarag of the calcification site decreased12. The reduction of skeletal stiffness with declining pH is likely associated with an increase in porosity, as confirmed by preliminary Nuclear Magnetic Resonance analyses. B. europaea skeletons have already been found to increase their porosity in stress conditions, such as increasing temperature14.
Table 1.
Summary of the main effects of OA on the mineral distribution and content in the calcified organisms with increasing proximity to the CO2 seep (declining pH). Uncertainties are one standard deviation.
|
Balanophyllia europaea
|
Vermetus triqueter
|
Padina pavonica
|
Acetabularia acetabulum
|
|||||||
|---|---|---|---|---|---|---|---|---|---|---|
| pH | Ω arag | min. phase | % min. phase# |
min. phase |
% min. phase# |
min. phases |
% min. phases |
min. phases* |
% min. phases |
|
|
|
|
|
|
|
||||||
| Site 1 | 8.1 | 3.6 | A | 97.4 ± 0.4 | A | 98.0 ± 0.5 | A CSh$ | 73.9 ± 8.3 | A Wh | 42.9 ± 3.9 |
| Site 2 | 7.9 | 2.4 | A | 97.80 ± 0.04 | A | 98.3 ± 0.2 | A CSh | 71.5 ± 10.6 | A Wh | 24.2 ± 6.9 |
| Site 3 | 7.8 | 2.1 | A | 97.8 ± 0.2 | A | 98.1 ± 0.1 | A CSh | 59.6 ± 4.9 | A Wh | 22.7 ± 7.6 |
| Site 4 | 7.7 | 1.5 | - | - | - | - | A$ CSh | 61.6 ± 4.5 | Wh | 25.4 ± 8.0 |
A, Wh and CSh indicate aragonite, whewellite and monohydrate calcium sulphate salts. The % of mineral phase(s) is reported as mass ratio.
Amorphous globular particles were also detected.
The content of organic matrix is the complement to 100 in B. europaea and V. triqueter where no significant amounts of water were detected in the skeletons and shell-tubes. P. pavonica and A. acetabulum contained a significant amount of bounded water and their percentage of organic matrix significantly increased with pCO2. When two phases were present, the most abundant one is indicated in bold.
This phase was detected in traces.
The apical regions of V. triqueter shell-tubes of similar diameter (~5 mm) were analysed. Aragonite was the only mineral phase (Fig. S2). Shell-tubes from Site 1 had four layers with different crystal texture and variable relative thickness among samples (Fig. 2). The first two layers were prismatic, with the second one made of regular prisms with a square section (500 nm side). The third was cross-lamellar with regular fibers 500 nm thick. The fourth external layer was spherulitic, with several bores and channels (Fig. 2). In one of six samples from Site 2, and in four of six from Site 3, the two internal layers were not present. Different hardnesses and elastic Young’s moduli were associated with different textures, without significant variations among Sites (Table S2). OM content was homogeneous among Sites (Kruskal-Wallis test, p > 0.05; Table 1; Fig. S3). The unaffected mineralogy of V. triqueter shell-tubes is possibly due to the exquisite control of biological macromolecules on mollusc mineralization, which occurs in confined sites resulting in complex crystalline textures (Fig. 2). During shell-tube growth, the external layers are the first to be deposited, followed by the internal ones11. A pH reduction can reduce the growth rates (calcification) of mollusc shells15, which likely explains the absence of the internal layers in shell-tubes from the most acidic Sites.
Fig. 2.
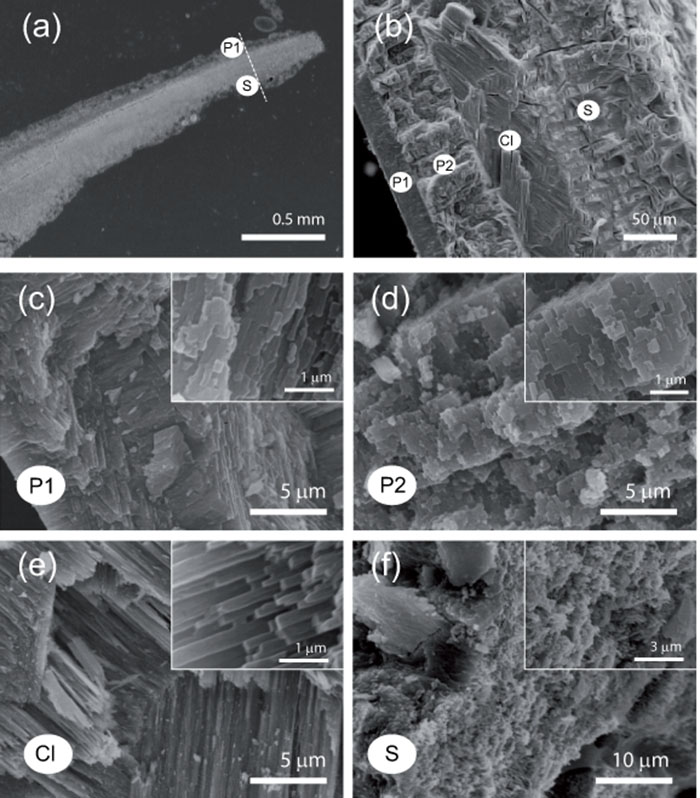
SEM images of a longitudinal section of Vermetus triqueter shell-tube. a) Apical region of shell-tube. High magnification images were taken along the dotted line from inside (P1) to outside (S) the tube. b) Shell-tubes in Site 1 consisted of four layers (P1, P2, Cl, S): c) first prismatic layer (P1); d) second prismatic layer (P2), with square cross-sections; e) cross-lamellar layer (Cl); f) spherulitic layer (S) containing bores and channels. The first two layers were not present in one sample from Site 2 and in most of the samples from Site 3.
Padina pavonica thalli tips from Site 1 were mainly aragonitic with traces of hydrate calcium sulphate salts (CSh). Aragonite concentration decreased with increasing pCO2, and almost only CSh was observed at Site 4 (Fig. S2). The presence of CSh was investigated in detail by further tests and considerations (see Supplementary Information). The overall mineral content differed among Sites (Kruskal-Wallis test, p < 0.05; Table 1, Fig. S3), and declined with increasing pCO2 (Spearman’s rho of the correlation with pH = 0.592, p < 0.01). In all samples, many aragonite needle-like crystals were aggregated or merged forming bundles. CSh crystals appeared as prisms or tablets (Fig. 3, Fig. S6). The decalcification left the thalli free of mineral deposits (Fig. S6). In P. pavonica, CSh increased with increasing pCO2. Some stabilization of CSh salts by algal molecules16,17, probably polysaccharides, is expected, as in seawater CSh converts to gypsum.
Fig. 3.

SEM images of Padina pavonica thalli and Acetabularia acetabulum cups. In ‘a’ and ‘b’, left column indicates low-magnification images and right column indicates high-magnification images. P. pavonica (a) became less mineralized with increasing pCO2. The aggregation and shape of aragonite crystals was lightly affected by pCO2. In A. acetabulum (b), needle-like crystals of aragonite (An) were above and among the globular aggregates (Ga). The amount of biomineralized material was reduced with increasing pCO2, wheras the center of the cup became more populated by spherical aggregates. Aragonite needles are shown in the inset for Site 2 and 3, and whewellite is shown in the inset for Site 4.
Acetabularia acetabulum was mainly aragonitic, with minor presence of whewellite (calcium oxalate; Fig. S2). All samples contained about 10% (w/w) of water. The content of mineral phases, estimated after pyrolysis and release of water, differed among Sites (Kruskal-Wallis test, p < 0.01; Table 1 and Fig. S3) and declined with increasing pCO2 (Spearman’s rho of the correlation with pH = 0.555, p < 0.01). The aragonite/whewellite ratio decreased with increasing pCO2. Globular granules of amorphous material rich in Ca and S were observed on the surface of needle-like aragonite aggregates at Sites 1-4 (Fig. 3 and Fig. S6). Whewellite was the only phase detected at Site 4 (Fig. S2; Fig. 3), where it appeared as prisms. After decalcification, the cup surface was free of mineral deposits (Fig. S6). In line with a mainly chemical mineralization control17, increasing pCO2 did not affect deposition of whewellite in A. acetabulum. The persistence of amorphous globular particles rich of calcium and sulphur was unexpectedly observed when aragonite disappeared. This phase, soluble in acetic acid solution, may be the result of interactions between Ca ions and the sulphonated groups of polysaccharides17, overexpressed by the algae as a response to acidification.
Within each sample, P. pavonica and A. acetabulum showed a marked reduction of mineralized areas with increasing pCO2 (Fig. 4). Their aragonite content decreased with decreasing Ωarag. At a Ωarag of 1.5, aragonite was not observed, probably because this saturation level is too low to sustain its nucleation process. The observed changes in morphology of aragonite crystals (Fig. 3) are associated with seawater chemistry18.
Fig. 4.

In situ pictures of Padina pavonica and Acetabularia acetabulum at Sites 1 and 4, showing the reduction of calcified material (white areas) with increasing pCO2.
Abundance
The percentage of cover for all species, except A. acetabulum, differed among Sites (Kruskal-Wallis test, p < 0.001), and decreased with increasing pCO2 (Table S3). B. europaea and V. triqueter were not found at Site 4 (pH = 7.7, Ωarag = 1.5; Fig. 1). Densities of A. acetabulum were homogeneous among Sites (Kruskal-Wallis test, p > 0.05). This suggests that P. pavonica and A. acetabulum are not obligate calcifiers, persisting in high pCO2 where also the non-calcifying species L. variegata survives (Fig. 1).
A changing benthic community was associated with the pCO2 gradient (Supplementary Video). The coverage of a coral, a mollusc, and two macroalgae, one of which is a calcifier, declined with increasing pCO2 (Fig. 1). This is in agreement with previous investigations at CO2 vents, documenting dramatic reductions in calcifying macroalgal abundance7,8.Calcifying organisms seem the most sensitive to elevated pCO219, even if their response is not consistent8,15,20. A. acetabulum, B. europaea and V. triqueter were previously found only outside vent areas, at a pHTS of 8.147. Instead, in our survey, B. europaea and V. triqueter survived up to pHTS 7.8 and algal species up to pHTS 7.7 (Fig. 1). The response of macroalgae to pCO2 is expected to vary among species. As an example, increased cover with decreasing pH was observed for Padina spp at CO2 seeps in Vulcano and Papua New Guinea21, and for L. variegata at CO2 seeps in Ischia10, which contrasts with our data. The responses of non-calcifying macroalgae to elevated pCO2 is variable22, depending on energy availability23. The nature of CO2-induced shifts in macroalgal community structure is likely to vary depending on other environmental factors, such as nutrient availability, temperature and solar radiation24. For instance, L. variegata were sampled in Ischia at 1 m depth and in our study at 8-12 m. Growth of the brown alga Dictyota ciliolata decreases with decreasing light intensity25. In the brown alga Fucus vesiculosus, photosynthesis and growth decrease with increasing depth26 from 1 to 6 m. At the high light of the shallow Ischia site, L. variegata may compensate for the negative effect of lowered pH through enhanced growth.
Relationships with the control over the biomineralization
We related, for the first time, the biological control over biomineralization with changes in the abundance of organisms along natural pCO2 gradients. The content of biomineralized products decreased with increasing pCO2 only in the two calcifying algal species (with a weak control over their biomineralization), but the two species with stronger biomineralization control (B. europaea and V. triqueter) tolerated less severe pCO2 increases (pH 7.8) than the algae (pH ≤7.7). Moreover, the more tolerant algae continued to grow despite their biomineralization products being profoundly altered by pCO2. Even if biomineralization in algae is only induced17, we can’t exclude that the switch from aragonite to other biominerals may represent a phenomenon of phenotypic plasticity27, which is increasingly being found to strongly contribute to persistence in the face of climate change28. The control over biomineralization may not be the only cause of the observed differences, because the coral and the mollusc have a biology completely dependent on calcification, whereas the algae do not. Moreover, the algae may benefit from pCO2 increase in terms of photosynthesis, while the coral may be less dependent on the photosynthetic process and the mollusc does not photosynthesize. This study adds new evidence to field studies on OA effects4,9,29,30, all indicating major ecological shifts as CO2 rises. It documented that (i) the mineralization response to OA seems connected with the organisms’ control of biomineralization, (ii) increasing pCO2 profoundly affects the abundance of many benthic organisms, and (iii) only the species with weaker control were observed at the lowest pH.
Methods
Study site
Fieldwork was conducted at Panarea, Italy (Supplementary Video; Fig. S1), where hydrothermally stable CO2 emissions acidify seawater, generating a pH gradient (see Supplementary Information for details).
Carbonate chemistry
Four sampling Sites were selected (Figs. 1 and S1): a control site (Site 1), two intermediate pCO2 (Site 2 and Site 3), and high pCO2 (Site 4). pH (NBS scale), temperature, and salinity were measured at each Site during several surveys between July 2010 and May 2013 with a multi-parametric probe (600R, YSI Incorporated, USA) powered from a small boat and operated by SCUBA divers. Bottom water samples for determination of total alkalinity (TA) were collected and analysed using standard methods (see Supplementary Information for details). Additional temperature data were recorded every three hours by sensors (Thermochron iButton, DS1921G, Maxim Integrated Products, USA) attached in each Site from July 2010 to May 2013. Measured pH was converted to the total scale using CO2SYS software. Median pH (back-transformed hydrogen ion concentrations) were calculated for each Site. The pH, TA, salinity and temperature were used to calculate other carbonate system parameters using the software CO2SYS (Supplementary Information).
Benthic survey
Photographs of benthos (5 to 10 per Site, 50 × 50 cm for the animals, 21.0 × 29.7 cm for the algae) were used to measure the percent cover of B. europaea, V. triqueter, P. pavonica, A. acetabulum and L. variegata at each Site. See Supplementary Information for details.
Vent gas
Gas was sampled during five surveys (June 2011-May 2013) and analysed at the Laboratory of Fluid and Rock Geochemistry of the University of Florence using standard methods (Supplementary Information). Water samples were collected and tested for dissolved H2S (Supplementary Information).
Statistical analyses
Analysis of variance (ANOVA) and the post-hoc Fisher LSD test were used to test for differences among Sites using arcsine and log-transformation for percent cover and environmental data, respectively, when necessary. Else, the non-parametric Kruskal-Wallis and Spearman’s rank correlation coefficients were used. All analyses were performed using SPSS v.20.
Biomineralization
Samples were randomly collected by SCUBA divers at all Sites and were prepared for analyses with standard methods (Supplementary Information). Microscopic observations, mechanical, and spectroscopic measurements required the preparation of cross sections of the samples (Supplementary Information). X-ray powder diffraction (XRD) and Fourier transform infrared spectroscopy (FTIR) patterns on small amounts of powdered samples were collected using standard methods (Supplementary Information). Attenuated Total Reflection FTIR (FTIR ATR) spectra of sample cross sections were acquired with standard methods (Supplementary Information). The organic matter content in the sample was determined by thermo-gravimetric analysis (TGA; Supplementary Information). Microstructures were observed using optical and scanning electronic microscopes (SEM; Supplementary Information). The mechanical properties of shell-tubes and skeletons were measured with standard nanoindentation techniques (Supplementary Information).
Supplementary Material
Acknowledgements
I. Berman-Frank helped with alkalinity measurements. B. Basile, F. Sesso, and Eolo Sub diving center assisted in the field. F. Gizzi and G. Polimeni helped during preparation and participated in field surveys. The Scientific Diving School supplied scientific, technical, and logistical support. The research leading to these results has received funding from the European Research Council under the European Union’s Seventh Framework Programme (FP/2007-2013) / ERC Grant Agreement n. [249930 – CoralWarm].
Footnotes
Competing Financial Interests
The authors declare no competing financial interests.
References
- 1.IPCC . IPCC Special Report on Renewable Energy Sources and Climate Change Mitigation. Cambridge University Press; 2011. [Google Scholar]
- 2.Orr JC, et al. Anthropogenic ocean acidification over the twenty-first century and its impact on calcifying organisms. Nature. 2005;437:681–686. doi: 10.1038/nature04095. [DOI] [PubMed] [Google Scholar]
- 3.Fabry VJ, Seibel BA, Feely RA, Orr JC. Impacts of ocean acidification on marine fauna and ecosystem processes. ICES J. Mar. Sci. 2008;65:414–432. [Google Scholar]
- 4.Rodolfo-Metalpa R, Martin S, Ferrier-Pages C, Gattuso JP. Response of Mediterranean corals to ocean acidification. Biogeosciences Discuss. 2010;6:7103–7131. [Google Scholar]
- 5.Hahn S, et al. Marine bivalve shell geochemistry and ultrastructure from modern low pH environments: environmental effect versus experimental bias. Biogeosciences. 2012;9:1897–1914. [Google Scholar]
- 6.Barry JP, Hall-Spencer JM, Tyrrell T. Guide to Best Practices for Ocean Acidification Research and Data Reporting. Publications Office of the European Union; 2010. [Google Scholar]
- 7.Hall-Spencer JM, et al. Volcanic carbon dioxide vents show ecosystem effects of ocean acidification. Nature. 2008;454:96–99. doi: 10.1038/nature07051. [DOI] [PubMed] [Google Scholar]
- 8.Fabricius KE, et al. Losers and winners in coral reefs acclimatized to elevated carbon dioxide concentrations. Nat. Clim. Chang. 2011;1:165–169. [Google Scholar]
- 9.Cigliano M, Gambi MC, Rodolfo-Metalpa R, Patti FP, Hall-Spencer JM. Effects of ocean acidification on invertebrate settlement at volcanic CO2 vents. Mar. Biol. 2010;157:2489–2502. [Google Scholar]
- 10.Porzio L, Buia MC, Hall-Spencer JM. Effects of ocean acidification on macroalgal communities. J. Exp. Mar. Biol. Ecol. 2011;400:278–287. [Google Scholar]
- 11.Lowenstam HA, Weiner S. On Biomineralization. Oxford University Press; 1989. [Google Scholar]
- 12.Holcomb M, Cohen AL, Gabitov RI, Hutter JL. Compositional and morphological features of aragonite precipitated experimentally from seawater and biogenically by corals. Geochim. Cosmochim. Acta. 2009;73:4166–4179. [Google Scholar]
- 13.Venn AA, et al. Impact of seawater acidification on pH at the tissue-skeleton interface and calcification in reef corals. Proc. Natl. Acad. Sci. USA. 2013;110:1634–1639. doi: 10.1073/pnas.1216153110. [DOI] [PMC free article] [PubMed] [Google Scholar]
- 14.Fantazzini P, et al. A time-domain nuclear magnetic resonance study of Mediterranean scleractinian corals reveals skeletal-porosity sensitivity to environmental changes. Environ. Sci. Technol. 2013;47:12679–12686. doi: 10.1021/es402521b. [DOI] [PubMed] [Google Scholar]
- 15.Ries JB, Cohen AL, McCorkle DC. Marine calcifiers exhibit mixed responses to CO2-induced ocean acidification. Geology. 2009;37:1131–1134. [Google Scholar]
- 16.McCandless EL, Craigie JS. Sulfated polysaccharides in red and brown algae. Ann. Rev. Plant Physiol. 1979;30:41–53. [Google Scholar]
- 17.Mann S, Webb J, Williams RJP. Biomineralization: Chemical and Biochemical Perspectives. VCH Verlagsgesellschaft; 1989. 1989. [Google Scholar]
- 18.Robbins LL, Knorr PO, Hallock P. Response of Halimeda to ocean acidification: field and laboratory evidence. Biogeosciences Discuss. 2009;6:4895–4918. [Google Scholar]
- 19.Kroeker KJ, Kordas RL, Crim RN, Singh GG. Meta-analysis reveals negative yet variable effects of ocean acidification on marine organisms. Ecol. Lett. 2010;13:1419–1434. doi: 10.1111/j.1461-0248.2010.01518.x. [DOI] [PubMed] [Google Scholar]
- 20.Fabry VJ. Marine calcifiers in a high-CO2 ocean. Science. 2008;320:1020–1022. doi: 10.1126/science.1157130. [DOI] [PubMed] [Google Scholar]
- 21.Johnson VR, Russell BD, Fabricius KE, Brownlee C, Hall-Spencer JM. Temperate and tropical brown macroalgae thrive, despite decalcification, along natural CO2 gradients. Glob. Change Biol. 2012;18:2792–2803. doi: 10.1111/j.1365-2486.2012.02716.x. [DOI] [PubMed] [Google Scholar]
- 22.Cornwall CE, et al. Carbon-use strategies in macroalgae: differential responses to lowered pH and implications for ocean acidification. J. Phycol. 2012;48:137–144. doi: 10.1111/j.1529-8817.2011.01085.x. [DOI] [PubMed] [Google Scholar]
- 23.Hofmann LC, Straub S, Bischof K. Competition between calcifying and noncalcifying temperate marine macroalgae under elevated CO2 levels. Mar. Ecol. Prog. Ser. 2012;464:89–105. [Google Scholar]
- 24.Sarker MY, Bartsch I, Olischläger M, Gutow L, Wiencke C. Combined effects of CO2, temperature, irradiance and time on the physiological performance of Chondrus crispus (Rhodophyta) Bot. Mar. 2013;56:63–74. [Google Scholar]
- 25.Cronin G, Hay ME. Effects of light and nutrient availability on the growth, secondary chemistry, and resistance to herbivory of two brown seaweeds. Oikos. 1996;77:93–106. [Google Scholar]
- 26.Rohde S, Hiebenthal C, Wahl M, Karez R, Bischof K. Decreased depth distribution of Fucus vesiculosus (Phaeophyceae) in the Western Baltic: effects of light deficiency and epibionts on growth and photosynthesis. Eur. J. Phycol. 2008;43:143–150. [Google Scholar]
- 27.Munday PL, Warner RR, Monro K, Pandolfi JM, Marshall DJ. Predicting evolutionary responses to climate change in the sea. Ecol. Lett. 2013;16:1488–1500. doi: 10.1111/ele.12185. [DOI] [PubMed] [Google Scholar]
- 28.Anderson JT, Inouye DW, McKinney AM, Colautti RI, Mitchell-Olds T. Phenotipic plasticity and adaptive evolution contribute to advancing flowering phenology in response to climate change. Proc. R. Soc. B-Biol. Sci. 2012;279:3843–3852. doi: 10.1098/rspb.2012.1051. [DOI] [PMC free article] [PubMed] [Google Scholar]
- 29.Dias BB, Hart MB, Smart CW, Hall-Spencer JM. Modern seawater acidification: The response of foraminifera to high-CO2 conditions in the Mediterranean Sea. J. Geol. Soc. 2010;167:843–846. [Google Scholar]
- 30.Calosi P, et al. Distribution of sea urchins living near shallow water CO2 vents is dependent upon species acid-base and ion-regulatory abilities. Mar. Pollut. Bull. 2013;73:470–484. doi: 10.1016/j.marpolbul.2012.11.040. [DOI] [PubMed] [Google Scholar]
Associated Data
This section collects any data citations, data availability statements, or supplementary materials included in this article.