

Abstract
The symptoms witnessed in unexplained death in epilepsy (SUDEP) suggest a breakdown of central autonomic control. Since the brainstem plays a crucial role in autonomic control, the objectives of this study were 1. To investigate if temporal lobe epilepsy (TLE) is associated with brainstem atrophy and to characterize it using graph Analysis 2. To compare the findings with those in two probable TLESUDEP. T1 images were obtained from 17 controls, 30 TLE (16 with mesial-temporal-sclerosis (TLE-MTS) and 14 without (TLE-no)) and from 2 patients who died of SUDEP. The brainstem was extracted, warped onto a brainstem atlas and Jacobian determinants maps (JDM) calculated. SPM8 was used to compare the JDMs at the group level, z-score maps were calculated for single subject analysis. Brainstem regions encompassing autonomic structures were identified based on macroscopic landmarks and mean z-scores from 5 × 5 × 5 voxel cubes extracted to calculate a new measure called atrophy-similarity index (ASI) for graph analysis. TLE-MTS had volume loss in the dorsal mesencephalon. The SUDEP cases had severe and more extensive volume loss in the same region. Nodal degrees and participation coefficients were decreased and local efficiency increased in SUDEP compared to controls. TLE is associated with volume loss in brainstem regions involved in autonomic control. Structural damage in these regions might increase the risk for a fatal dysregulation during situations with increased demand such as following severe seizures.
Keywords: Deformation based morphometry, TLEgraph analysis, autonomic control, SUDEP
Highlights
Patients with temporal lobe epilepsy (TLE) were studied.
Two had died of Sudden Unexplained Death in Epilepsy (TLE-SUDEP)The brainstem was studied with deformation-based morphometry and graph analysis TLE has volume loss in the dorsal mesencephalon.TLE-SUDEP have more extensive brainstem damage and evidence for network breakdown.
1. Introduction
Descriptions of epilepsy patients dying unexpectedly after seizures have existed since the 19th century, but only recently has it been recognized that sudden unexplained death in epilepsy (SUDEP) is the leading cause of premature death (10-50%) in epilepsy patients (Shorvon and Tomson, 2011, Tomson et al., 2008, Ryvlin et a., 2013). The observations in patients dying of SUDEP in epilepsy monitoring units suggest that a postictal breakdown of central autonomic control characterized by a severe alteration of the respiratory and cardiac function that leads to a generalized EEG suppression and finally to a terminal cardio-respiratory arrest might play a major role (Bateman et al. 2010, Seyal et al., 2012). This raises the question to what degree epilepsy associated structural alterations in brain structures involved in central autonomic control could contribute to such a breakdown.
The central autonomic system can be divided into two subsystems. One is the brainstem/medulla system that responds typically to non-conscious stimuli from internal sensors, i.e., baro- and chemoreceptors, etc, and encompasses the nuclei (ncl.) of the solitary tract, ambiguous ncl, dorsal vagal ncl, pre-Bötzinger/Bötzinger complex, parabrachial and Kölliker-Fuse ncl, the rostral and caudal ventral respiratory group, the serotoninergic raphe and the mesencephalic periaqueductal gray/reticular formation. The other is the cortical and subcortical autonomic system which responds conscious stimuli, e.g., fear or anxiety caused by external stimuli, by initiating the appropriate response via the brainstem/medulla system. Its main components are the hypothalamus and thalamus, particularly the ventral posterior medial and lateral nuclei and the mesial prefrontal cortex and the insular cortex. Animal studies but also human clinical studies suggest that the posterior insula might play a prominent role in cortical and cortical/brainstem autonomic integration (Nagai et al., 2010).
The progress in quantitative image analyses in recent years has led to the insight that even well defined epilepsy types, e.g., temporal lobe epilepsy (TLE) with mesial temporal sclerosis (MTS), are associated with brain structural abnormalities beyond the epileptogenic focus that encompass remote but anatomically connected cortical and subcortical regions and most importantly regions belonging to the central autonomic system, e.g. prefrontal mesial cortex, insula (Scanlon et al., 2013; Mueller et al., 2009; Bernhardt et al., 2008). To our knowledge there is no study that investigated if there are also structural abnormalities in brainstem structures in TLE. The first objective of this study was therefore to investigate if TLE with (TLE-MTS) and without MTS (TLE-no) is associated with volume losses in the brainstem and to compare the findings in these two groups with those in two TLE patients who had been studied with the same MR protocol but had later died under circumstances consistent with SUDEP. It was hypothesized that a subset of TLE-MTS and TLE-no patients would have regional brainstem atrophy as would the two SUDEP patients but that the atrophic changes in the latter would be more severe.
The fact that abnormalities in the cortical autonomic control system are apparent at the level of group analyses indicates that they are probably fairly common at the single subject level. This suggests that structural abnormalities within the autonomic control system per se are eventually not enough to cause serious disturbances of the autonomic control but that they need to fulfill very specific characteristics, e.g., to be particularly severe or to encompass very specific regions, to become critical. The second objective was therefore to use graph analysis and a new measure, the atrophy similarity index (cf. Methods for details) that was designed to capture differences in the severity and the spatial extent of atrophic changes to further characterize brainstem volume losses in TLE and SUDEP TLE. It was hypothesized that SUDEP TLE patients would have a different pattern of graph analytical abnormalities than TLE-MTS or TLE-no that would be consistent with a reduced interaction between atrophic brain regions.
2. Methods
2.1. Study population
The committees of human research at the University of California San Francisco (UCSF), California Pacific Medical Center, San Francisco (CPMC) and VA Medical Center, San Francisco approved the study, and written informed consent was obtained from each subject according to the Declaration of Helsinki. The study population consisted of 49 subjects. Seventeen were controls (mean age: 39.0 ± 13.9 years, female/male: 11/6, no current neurological or other condition affecting brain function or structure, no history of epilepsy or other neurological or psychiatric diseases, normal MRI reads by a board certified neuroradiologist). Sixteen were patients suffering from TLE with mesial temporal seizure origin and ipsilateral mesial-temporal sclerosis (TLE-MTS) (mean age: 41.1 ± 11.0 years, female/male: 8/8, left/right/bilateral onset: 10/5/1, mean age at onset: 7.9 ± 6.6 years, mean epilepsy duration: 33.1 ± 12.3 years) and 14 were patients suffering from TLE with unilateral mesial-temporal seizure origin and normal MRI (TLE-no) (mean age: 34.6 ± 11.4 years, female/male: 10/4, left/right onset: 9/5, mean age at onset: 23.3 ± 11.6 years, mean epilepsy duration: 12.1 ± 9.7 years). Finally, there were two TLE patients who later died under circumstances consistent with probable SUDEP. One of them was a 48 years old male TLE-no patient (bilateral onset, age at onset 40 years, duration 8 years), and the other one a 39 years old male TLE-MTS patient (left onset, age at onset 25 years, duration 14 years). The identification of the epileptogenic focus was based on seizure semiology and prolonged ictal and interictal Video/EEG/Telemetry (VET) in all patients. The presence/absence of MTS in TLE was based on a visual inspection of a T2 weighted high resolution image of the hippocampal formation and confirmed by subfield volumetry (Mueller et al., 2009). None of patient’s MRI showed other lesions besides the MTS. The two epilepsy groups and the controls did not differ in age. TLE-MTS were significantly younger at onset and had longer duration of their epilepsy than TLE-no (p < 0.05). All patients reported having been seizure free for at least 24 h before the 4T study.
2.2. MRI acquisition
All studies were performed on a Bruker MedSpec 4T system controlled by a Siemens TrioTM console and equipped with a U.S.A. instruments eight channel array coil. The following sequences, which were part of a larger research imaging and spectroscopy protocol, were acquired: 1) T1-weighted whole brain gradient echo MRI TR/TE/TI = 2300/3/950 ms, 1.0 × 1.0 × 1.0 mm3 resolution, acquisition time: 5.1 min. 2) 3D T2-weighted turbo spin-echo sequence, TR/TE = 3500/356 ms, 1.0 × 1.0 × 1.0 mm3 resolution (for calculation of intracranial volume), acquisition time: 3.4 min. 3) high resolution T2 weighted fast spin echo sequence for hippocampal subfield volumetry (TR/TE: 3500/19 ms, 0.4 × 0.4 mm in plane resolution, 2 mm slice thickness, 24 interleaved slices, angulated perpendicular to the long axis of the hippocampal formation, acquisition time: 7.30 min. Total acquisition time for structural MRIs: ~20 min.
2.3. Image Processing and Voxel-Based Group comparisons
The processing/analysis procedures are depicted as a flow chart in Supplementary Fig. 1. The T1 images were processed in Freesurfer 5.1 (http://surfer.nmr.mgh.harvard.edu). The labels cerebellum gray and white, brainstem, left and right diencephalon, left and right thalamus that are produced in the Freesurfer subcortical segmentation stream (Fischl et al., 2002) were used to generate a brainstem mask for each subject that encompassed the brainstem, the cerebellum and the diencephalon including the thalami. This mask was used to generate a T1 brainstem image by extracting the corresponding regions from each subject’s gray scale image. The template building routine from DARTEL toolbox (Ashburner et al., 2007) as implemented in SPM8 (http://www.fil.ion.ucl.ac.uk/spm/) and running Matlab (version 8.1.0.604) was used to generate a brainstem template from the T1 brainstem images of the control group. Each subjects T1 brainstem image was warped onto this template using the high dimensional warping algorithm of the DARTEL toolbox and the Jacobian determinants calculated from the resulting transformation matrices. The resulting Jacobian determinant maps (JDM) were masked to suppress the background and corrected for differences of head size using the intracranial volume that had been calculated from the skull-stripped T2 images.
2.4. Single subject analyses
The JDM were converted into z-score maps using the following formula: z-score = (JDMsubject – mean JDMcontrols/standard deviation of JDMcontrols). The resulting z-score maps were processed in two ways:
-
A
Voxel-wise atrophy whole brainstem analysis: Atrophy maps were generated for each subject by thresholding them at z-score ≤ −2. Subjects with more than 504 subthreshold voxels (504 = mean subthreshold voxelscontrols + 2 standard deviation controls) were considered to have pathological z-score maps (Crawford and Howell, 1998).
-
B
Definition of autonomic system for graph analysis: A 5 × 5 × 5 voxel grid was overlaid on each z-score map to divide it into equally sized cubes. Brainstem nuclei/regions involved in the autonomic control are not distinguishable on in vivo 4T T1. Therefore macroscopic landmarks based on the atlas of histological and 9.4 T high resolution sections of the brainstem/medulla by Naidich et al. (2009) were used to identify altogether 16 cubes of interest (COI) with a high probability to encompass the following structures: COIs 1–4: Caudal Autonomic region with a ventral (CAV) and a dorsal (CAD) aspect that contain the caudal parts of ambiguous, solitary tract and dorsal vagal nuclei. COIs 5,6: Caudal Respiratory (CR) region that contains the pre-Bötzinger and Bötzinger Complex. COIs 7,8: Rostral Autonomic (RA) region that encompasses the rostral parts of the ambiguous nucleus. COIs 9–12: Rostral Respiratory (RR) region which encompass the parabrachial and Kölliker-Fuse nuclei and a section of the reticular formation (lateral tegmental field) and COIs 13–16: Periaqueductal gray (Periaqc) that encompasses the periaqueductal gray and parts of the raphe nuclei. Individual mean z-scores were calculated for each of these 16 COIs (cf. Fig. 1).
Fig. 1.
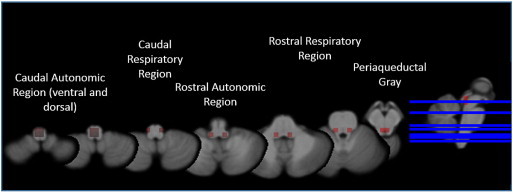
Brainstem parcellation: caudal autonomic region ventral (CAV) and dorsal (CAD) aspect contains the caudal parts of ambiguous, solitary tract and dorsal vagal nuclei. Caudal respiratory (CR) region contains the pre-Bötzinger and Bötzinger complex. Rostral autonomic (RA) region encompasses the rostral parts of the ambiguous nucleus. Rostral respiratory (RR) region contains the parabrachial and Kölliker-Fuse nuclei and a section of the reticular formation (lateral tegmental field). Periaqueductal gray (Periaqc) encompasses the periaqueductal gray and parts of the raphe nuclei.
2.5. Graph analysis
Previous studies have shown evidence for a structural morphological connectivity (He and Evans, 2010) in the human brain, i.e., evidence for an anatomically plausible robust correlation between volumetric features derived from T1 images, for example, cortical thickness or gray matter volumes, of different brain areas. The nature of the correlation of these measures across regions is not clear and several potential factors, e.g. common afferent/efferent pathways, genetic, maturational/developmental influences, and experience related plasticity alone or in combination have been discussed in this context (Alexander-Bloch et al., 2013; Carlo et al., 2013; Chen et al., 2011; Evans, 2013). In this study we used a variant of the just described structural morphological connectivity, the atrophy similarity index (ASI), that connects regions with similar degree of atrophy. The ASI is based on the assumption that a pathological process causing neuronal loss/atrophy in one region leads to deafferentation and consequently atrophic changes of similar severity in neighboring and remote regions connected to this region. The ASI between regions A and B is defined as follows: raw ASI = ((z-score of the region with the lower score of the two)/(absolute difference between z-score in region A and region B)). This definition of the denominator would result in an infinite number in the unlikely event that two different COIs have exactly the same z-scores or in a very small value and consequently a very large ASI if the z-scores of two different COIs are very close. To control for this, the minimal possible difference between two COI was set to be 0.00001 even for COI pairs with smaller differences. However, in this data set the differences between COIs were always larger. The raw ASI is converted into the final ASI by multiplying it with a normalization term n defined as n = (–1/ (range of all raw ASI in subject)). Based on that formula, severe atrophy due to the same process and thus of similar severity in A and B (homogeneous atrophy) results in a positive ASI close to 1. If B is not in the immediate neighborhood of A but in a remote region that receives input from A, the loss of this input produces a mild atrophy in B and a lower but positive ASI with A. If B is not atrophied because it is neither directly nor indirectly affected by the pathological process in A, the ASI will be negative. If there is a second pathological process (heterogeneous atrophy) that affects mostly a region C but indirectly also B that receives input from C, the relationship between A and B is weakened and the ASI between them lowered. In contrast to the traditional measures of structural connectivity using volumetric measures, e.g. regional cortical thickness, that are based on correlations of this measure between two regions across multiple subjects, the ASI has the advantage that it can be calculated for individual subjects.
Graph theory provides a theoretical framework to characterize the connectivity of a network and is increasingly being used to describe the functional and structural connectivity of healthy and diseased brains (Sporns et al., 2000). It describes a network as a system of nodes and edges that connect nodes with similar properties. In terms of in vivo imaging nodes typically represent brain regions for which the property of interest, e.g. cortical thickness, time course of the BOLD signal or in the case of this study the z-score, is known and the edges represent the strength of the relationship of this measure between any two regions. In this study, the strength of the relationship corresponds to the magnitude of the ASI. The result is a matrix that describes this relationship for every possible combination of regions. In this study this relationship is described by the 16 × 16 ASI matrix that has been calculated from the mean z-scores of the 16 COIs or nodes encompassing brainstem structures involved in autonomic control. The routines provided by the Brain Connectivity Toolbox (https://sites.google.com/site/bctnet/) were used to extract network measures from these matrices. Graph analysis usually requires a thresholding step to remove weak and thus probably physiologically meaning less connections. This can be done by either standardizing the number of edges (cost threshold) or by standardizing the number of nodes (density threshold) across individual networks. The former approach often leads to networks with a different number of nodes across subjects while the latter generates networks with different numbers of edges. For the purpose of this study, the ASI matrices were thresholded at minimal density (density is defined as the fraction of present edges to all possible edges and minimal density is the threshold below which some of the COIs or nodes are no longer included in the network, i.e., the network is no longer fully connected) because this allows for a better description of the whole range of atrophy than thresholding by cost that would have only captured the most atrophied regions. Graph analysis based on the ASI matrices was used to further characterize the type of brainstem atrophy, i.e., to distinguish between homogeneous and heterogeneous atrophy. The following measures were used for that purpose: 1. Nodal degree which is defined as the number of edges that an individual node shares with other nodes. Given the definition of the ASI, it was expected that nodes in regions with severe homogeneous atrophy have a high nodal degree and nodes in regions with heterogeneous atrophy a lower nodal degree. 2. Nodal efficiency which is a measure of the path length or number of edges that are necessary to connect this node with each of the other nodes. A high nodal efficiency indicates that most of these connections are direct, i.e. one edge. In the context of the ASI, it was assumed that the nodal efficiency will be high in subjects with homogeneous but also heterogeneous atrophy but low in subjects with mild or no atrophy. 3. Nodal betweenness centrality corresponds to the fraction of all shortest paths in the network that include this node. Given the definition of the ASI, it can be expected that a node in a region with heterogeneous atrophy tends to have a higher nodal betweenness centrality than regions with homogeneous atrophy. 4. Network modularity (Louvain algorithm) and participation coefficient. Modules are groups of nodes that are highly interconnected while having comparatively few connections with nodes in other modules. The participation coefficient is a measure of the diversity of the intermodular connections of node, i.e. is low in nodes that mostly interact with nodes within the same module. In the context of the ASI, nodes from COIs with homogeneous atrophy are likely to belong to the same module while nodes from COIs of heterogeneous atrophy are more likely to be in different modules. The number of modules is increased in homogeneous and heterogeneous atrophy but more so in the latter. The participation coefficient was expected to be higher in regions with homogeneous atrophy indicating an interaction between the nodes of different modules and low in regions with heterogeneous atrophy indicating a breakdown of these interactions.
2.6. Statistical analysis
SPM8 was used to identify regions with significant volume loss in the brainstem/diencephalon/thalamus region in TLE-MTS and TLE-no compared to controls (t-test, p < 0.05 FDR to correct for multiple comparisons). Multiple t-tests (p < 0.05 FDR to correct for multiple comparisons) were used to compare the mean z-scores of the 16 COIs of the two patient groups with those of the control group. Accounting for the fact that the graph analytical measures were not normally distributed, two-sided Mann–Whitney tests were used to compare the nodal degree, nodal efficiency, modularity and participation coefficients between the patient groups and the controls. Given the a priori hypotheses outlined in the introduction and the methods section (graph analysis), no correction for multiple comparisons was applied. The non-parametric bootstrap algorithm provided by Matlab and the bias corrected and accelerated percentile method for the calculation of confidence intervals were used to calculate the 95% confidence interval of the medians in the control group for the measures nodal degree, local efficiency and nodal betweenness centrality. COIs or nodes with measures outside these confidence intervals and in accordance with the a priori hypotheses consistent with the pattern of heterogenous atrophy were considered to be “abnormal” in the two SUDEP cases. A modification of this procedure (all subjects (controls, TLE-MTS or TLE-no with at least 3 modules) was used to determine nodes with an abnormal participation coefficient in the two SUDEP cases. This modification was necessary to account for the fact that the participation coefficient is influenced by the number of modules.
3. Results
3.1. Voxel-based group and single subject comparisons
Fig. 2 shows a significant volume loss in the mesencephalon of TLE-MTS compared to controls that is maximal in the regions of the inferior and superior colliculi and periaqueductal gray/mesencephalic reticular formation and extends into the region of the raphe and reticular nuclei and medial and inferior thalamus/diencephalon bilaterally. The volume loss in TLE-no did not exceed the threshold for significance. Based on the number of sub-threshold voxels in their z-score map, 1 control, 8 TLE-MTS and 3 TLE-no were considered to have pathological z-score maps. The finding of the single subject analysis suggests that brainstem abnormalities occur in TLE-MTS and TLE-no but that they are less common in the latter group and thus not necessarily detectable in group comparisons. TLE-MTS with pathological maps did not differ from TLE-MTS with normal maps regarding age at onset (9.3 ± 8.6 vs 6.8 ± 4.9 years) or epilepsy duration (34.7 ± 15.8 vs 31.9 ± 9.6 years) nor did TLE-no with pathological maps differ from TLE-no with normal maps (age at onset: 18.2 ± 4.5 vs 24.9 ± 12.8 years, duration of epilepsy: 9.5 ± 4.1 vs 12.9 ± 10.9) (all p > 0.05 with Wilcoxon test). 54.5 percent of the TLE with pathological maps had secondarily generalized seizures compared to 36.8% of the TLE with normal maps. Both SUDEP TLE patients had pathological z-score maps with 25,591 and 7624 sub-threshold voxels respectively, which corresponded to the highest and third highest number of sub-threshold voxels in the patient population (cf. Fig. 3 for the detailed maps).
Fig. 2.
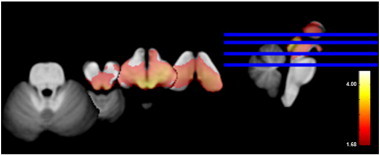
Volume loss in TLE-MTS compared to the control group (p > 0.05 FDR at voxel level). Cf. text for description.
Fig. 3.
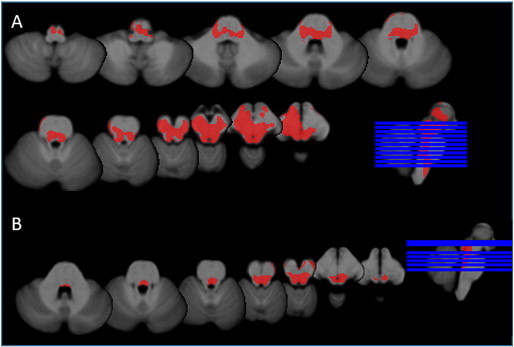
Subthreshold voxels in SUDEP cases. A. SUDEP TLE-MTS: widespread volume loss in the ventral diencephalon, thalamus, mesencephalon including pontine tegmentum and rostral medulla oblongata. B. SUDEP TLE-no: significant volume losses were found in the region of the inferior colliculi/periacqueductal gray extending into the region of the rostral pontine tegmentum.
3.2. Graph analysis
Table 1 shows the detailed results of the graph analysis, Fig. 4 shows the ASI matrices. As expected based on the definition of the ASI most of the group differences were found in COIs with significant volume losses. TLE-MTS were characterized by increased nodal degree and efficiency in COIs/nodes from the periaqueductal gray and superior/inferior colliculi. Nodal betweenness centrality and the participation coefficient were also increased but the differences did not reach significance. Similar changes were found in the TLE-no group but did not reach significance. Controls had on average 2.47 (1.18) brainstem modules while TLE-MTS had 3.31 (1.3) and TLE-no 2.57 (1.28) brainstem modules.
Table 1.
Graph analysis node by node summary.
| Measure | Group | CAD | CAD | CAV | CAV | CR | CR | RA | RA | RR | RR | RR | RR | Periaqc | Periaqc | Periaqc | Periaqc |
|---|---|---|---|---|---|---|---|---|---|---|---|---|---|---|---|---|---|
| Z-scores | Control | –0.046 | –0.111 | –0.130 | –0.173 | –0.048 | –0.191 | –0.179 | –0.201 | –0.185 | –0.178 | –0.145 | –0.117 | –0.005 | –0.028 | 0.044 | 0.019 |
| Means | SD ± | 0.922 | 0.909 | 0.894 | 0.895 | 0.882 | 0.802 | 0.918 | 0.884 | 0.918 | 0.875 | 0.902 | 0.861 | 0.910 | 0.913 | 0.932 | 0.924 |
| TLE-MTS | –0.170 | –0.299 | –0.300 | –0.414 | –0.222 | –0.425 | –0.508 | –0.528 | –0.548 | –0.578 | –0.622 | –0.547 | –1.074 | –1.061 | –1.268 | –1.252 | |
| SD ± | 0.647 | 0.594 | 0.575 | 0.519 | 0.880 | 0.741 | 0.705 | 0.626 | 0.763 | 0.781 | 0.864 | 0.890 | 0.806 | 0.798 | 0.792 | 0.812 | |
| TLE-no | –0.303 | –0.331 | –0.216 | –0.257 | 0.048 | –0.253 | –0.446 | –0.203 | –0.443 | –0.324 | –0.448 | –0.285 | –0.287 | –0.303 | –0.332 | –0.332 | |
| SD ± | 0.983 | 0.767 | 0.923 | 0.727 | 0.837 | 0.678 | 0.803 | 0.639 | 0.812 | 0.801 | 0.824 | 0.785 | 0.699 | 0.676 | 0.798 | 0.775 | |
| SUDEP TLE-no | –0.533 | –0.388 | –0.757 | –0.582 | –1.512 | –1.470 | –1.219 | –1.135 | –1.237 | –1.285 | –1.758 | –1.892 | –2.722 | –2.759 | –2.733 | –2.950 | |
| SUDEP TLE-MTS | –1.276 | –1.393 | –2.175 | –1.723 | –2.022 | –1.823 | –1.587 | –1.815 | –1.698 | –1.917 | –2.029 | –2.112 | –2.399 | –2.243 | –2.471 | –2.295 | |
| Degree | Control | 8.00 | 8.00 | 10.00 | 10.00 | 3.00 | 3.00 | 10.00 | 5.00 | 10.00 | 9.00 | 4.00 | 3.00 | 4.00 | 3.00 | 1.00 | 3.00 |
| Medians | 95% CL | 1–11 | 2–12 | 2–13 | 3–12 | 1–11 | 1–13 | 2–14 | 2–13 | 2–14 | 2–13 | 2–12 | 1–10 | 2–11 | 2–12 | 1–6 | 1–13 |
| TLE-MTS | 2.00 | 3.50 | 4.00 | 4.50 | 2.50 | 7.50 | 11.50 | 8.50 | 9.00 | 11.00 | 9.00 | 7.50 | 11.50 | 11.00 | 13.50 | 12.00 | |
| 95% CL | 1–3.5 | 2–11 | 2–13 | 2.5–13.5 | 1–11 | 3–13 | 4–13 | 4–14 | 4–13 | 3.5-14 | 2–13 | 3–11 | 7–14 | 7–14 | 9–14.5 | 9–14 | |
| TLE-no | 8.00 | 8.00 | 5.50 | 8.00 | 1.50 | 9.50 | 10.00 | 7.00 | 11.50 | 8.00 | 9.50 | 11.00 | 9.00 | 8.50 | 5.50 | 8.50 | |
| 95% CL | 1–14 | 2–11 | 2–13 | 2.5–13.5 | 1–11 | 3–13 | 4–13 | 4–14 | 4–13 | 3.5-14 | 2–13 | 3–11 | 7–14 | 7–14 | 9 14.5 | 9–14 | |
| SUDEP TLE-no | 2.00 | 1.00 | 1.00 | 2.00 | 7.00 | 7.00 | 5.00 | 5.00 | 5.00 | 6.00 | 4.00 | 3.00 | 3.00 | 3.00 | 3.00 | 3.00 | |
| SUDEP TLE-MTS | 1.00 | 1.00 | 5.00 | 4.00 | 4.00 | 4.00 | 2.00 | 4.00 | 4.00 | 4.00 | 4.00 | 5.00 | 3.00 | 4.00 | 2.00 | 5.00 | |
| Local efficiency | Control | 0.005 | 0.009 | 0.005 | 0.008 | 0.009 | 0.003 | 0.009 | 0.011 | 0.008 | 0.007 | 0.007 | 0.006 | 0.005 | 0.006 | 0.000 | 0.003 |
| Medians | 95% CL | 0–0.026 | 0–0.021 | 0–0.014 | 0–0.016 | 0–0.034 | 0–0.019 | 0.005–0.022 | 0.003–0.045 | 0–0.024 | 0–0.043 | 0–0.026 | 0–0.025 | 0–0.024 | 0–0.024 | 0–0.000 | 0–0.022 |
| TLE-MTS | 0.004 | 0.010 | 0.017 | 0.028 | 0.019 | 0.021 | 0.029 | 0.026 | 0.027 | 0.031 | 0.026 | 0.017 | 0.033 | 0.034 | 0.030 | 0.031 | |
| 95% CL | 0–0.016 | 0.003–0.025 | 0.005–0.026 | 0.008–0.052 | 0–0.031 | 0.003–0.033 | 0.017–0.043 | 0.010–0.039 | 0.008–0.042 | 0.012–0.040 | 0.009–0.045 | 0.004–0.053 | 0.016–0.056 | 0.017–0.047 | 0.010–0.050 | 0.014–0.048 | |
| TLE-no | 0.009 | 0.019 | 0.008 | 0.016 | 0.002 | 0.015 | 0.027 | 0.025 | 0.026 | 0.017 | 0.020 | 0.021 | 0.021 | 0.016 | 0.013 | 0.016 | |
| 95% CL | 0–0.044 | 0.005–0.041 | 0–0.021 | 0.005–0.044 | 0–0.013 | 0.005–0.039 | 0.010–0.067 | 0.008–0.045 | 0.010–0.042 | 0.005–0.047 | 0.008–0.047 | 0.006–0.047 | 0.006–0.049 | 0.006–0.047 | 0–0.042 | 0.004–0.046 | |
| SUDEP TLE-no | 0.000 | 0.000 | 0.000 | 0.000 | 0.029 | 0.029 | 0.053 | 0.038 | 0.054 | 0.039 | 0.028 | 0.031 | 0.239 | 0.229 | 0.244 | 0.112 | |
| SUDEP TLE-MTS | 0.000 | 0.000 | 0.081 | 0.088 | 0.116 | 0.110 | 0.086 | 0.111 | 0.084 | 0.055 | 0.117 | 0.083 | 0.079 | 0.081 | 0.081 | 0.069 | |
| Nodal Betw. | Control | 0.00 | 0.00 | 0.00 | 0.00 | 0.00 | 0.00 | 0.00 | 0.00 | 0.00 | 0.00 | 0.00 | 0.00 | 0.00 | 0.00 | 0.00 | 0.00 |
| Centrality | 95% CL | 0.00–2.00 | 0.00–10.00 | 0.00-0.00 | 0.00-0.00 | 0.00-0.00 | 0.00-0.00 | 0.00–2.00 | 0.00–6.00 | 0.00–2.00 | 0.00-0.00 | 0.00–2.00 | 0.00-0.00 | 0.00–12.00 | 0.00-0.00 | 0.00-0.00 | 0.00–8.00 |
| Medians | TLE-MTS | 0.00 | 0.00 | 0.00 | 0.00 | 0.00 | 0.00 | 0.00 | 0.00 | 0.00 | 0.00 | 0.00 | 3.00 | 0.00 | 0.00 | 3.00 | 6.00 |
| 95% CL | 0.00–4.00 | 0.00–5.00 | 0.00–1.00 | 0.00-0.00 | 0.00-0.00 | 0.00–4.00 | 0.00-0.00 | 0.00–4.00 | 0.00-0.00 | 0.00–2.00 | 0.00-0.00 | 0.00–13.00 | 0.00-0.00 | 0.00–2.00 | 0.00–28.00 | 0.00–28.00 | |
| TLE-no | 0.00 | 0.00 | 0.00 | 0.00 | 0.00 | 0.00 | 0.00 | 0.00 | 0.00 | 0.00 | 0.00 | 0.00 | 0.00 | 0.00 | 0.00 | 0.00 | |
| 95% CL | 0.00-0.00 | 0.00-0.00 | 0.00–2.00 | 0.00–12.00 | 0.00–2.00 | 0.00–2.00 | 0.00–2.00 | 0.00-0.00 | 0.00–4.00 | 0.00-0.00 | 0.00–28.00 | 0.00–8.00 | 0.00–7.00 | 0.00–7.00 | 0.00–2.00 | 0.00–22.00 | |
| SUDEP TLE-no | 4.00 | 0.00 | 0.00 | 4.00 | 16.00 | 10.00 | 0.00 | 2.00 | 0.00 | 0.00 | 0.00 | 0.00 | 0.00 | 0.00 | 0.00 | 6.00 | |
| SUDEP TLE-MTS | 0.00 | 0.00 | 36.00 | 0.00 | 36.00 | 0.00 | 2.00 | 54.00 | 24.00 | 80.00 | 36.00 | 34.00 | 0.00 | 16.00 | 0.00 | 28.00 | |
| Participation | Control | 0.259 | 0.319 | 0.276 | 0.281 | 0.237 | 0.238 | 0.320 | 0.277 | 0.312 | 0.315 | 0.262 | 0.233 | 0.234 | 0.256 | 0.155 | 0.170 |
| Coefficient | 95% CL | 0–0.506 | 0–0.590 | 0–0.575 | 0–0.561 | 0–0.416 | 0–0.473 | 0–0.606 | 0–0.467 | 0–0.511 | 0–0.516 | 0–0.459 | 0–0.447 | 0–0.425 | 0–0.474 | 0–0.363 | 0–0.342 |
| Medians | TLE-MTS | 0.000 | 0.327 | 0.138 | 0.247 | 0.112 | 0.498 | 0.478 | 0.464 | 0.375 | 0.406 | 0.467 | 0.379 | 0.402 | 0.403 | 0.343 | 0.306 |
| 95% CL | 0–0.302 | 0–0.451 | 0–0.511 | 0–0.486 | 0–0.451 | 0.212–0.577 | 0.35–0.548 | 0.346–0.545 | 0.302–0.499 | 0–0.509 | 0–0.498 | 0–0.499 | 0.331–0.497 | 0.344–0.489 | 0.187–0.504 | 0.22–0.368 | |
| TLE-no | 0.262 | 0.278 | 0.068 | 0.260 | 0.000 | 0.404 | 0.353 | 0.210 | 0.316 | 0.279 | 0.408 | 0.268 | 0.298 | 0.297 | 0.167 | 0.175 | |
| 95% CL | 0–0.46 | 0–0.377 | 0–0.419 | 0–0.478 | 0–0.247 | 0–0.541 | 0.152–0.492 | 0–0.436 | 0.230–0.468 | 0.049–0.452 | 0.249–0.491 | 0.107–0.424 | 0–0.460 | 0.160–0.500 | 0–0.483 | 0–0.451 | |
| SUDEP TLE-no | 0.000 | 0.000* | 0.000 | 0.000 | 0.000 | 0.000* | 0.000* | 0.000* | 0.000* | 0.000* | 0.000* | 0.000* | 0.000* | 0.000* | 0.000 | 0.000* | |
| SUDEP TLE-MTS | 0.000 | 0.000* | 0.376 | 0.435 | 0.297 | 0.198* | 0.000* | 0.210* | 0.390 | 0.500 | 0.302* | 0.491 | 0.000* | 0.000* | 0.000 | 0.000* |
The results are presented for each Cube of interest (COI). Some of the autonomic regions encompass more than one COI. To account for the fact that the atrophy can be very localized, the results are reported for each individual COI/node belonging to an autonomic region.
CAD, caudal autonomic region dorsal aspect; CAV, caudal autonomic region ventral aspect; RA, rostral autonomic; RR, rostral respiratory; Periaqc, periaqueductal region, please see legend to Fig. 1 for more information.
TLE, temporal lobe epilepsy; MTS, mesial temporal sclerosis, no, normal MRI, measures are reported as mean (z-score) or median (graph) for group comparisons.
Bold, p < 0.05 for group comparisons (please see statistical analyses for details), Bold Italic, measure outside the 95% confidence interval of the control group.
only subjects with 3 or modules (9 controls, 12 TLE-MTS, 6 TLE-no) were used to calculate the 95% CI to account for the fact that the participation coefficient is influenced by the number of modules.
Fig. 4.
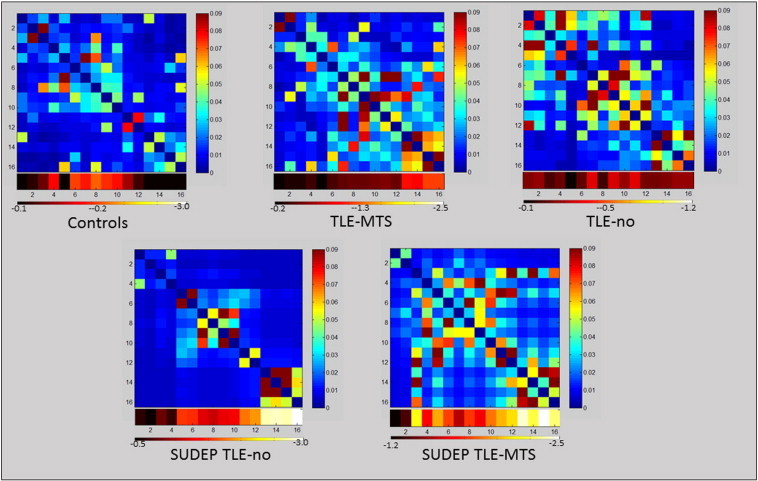
Upper panel: mean ASI matrices of the control, TLE-MTS and TLE-no group. Lower panel: single subject ASI matrices of the two SUDEP TLE subjects. The heat bars below the ASI matrices represents the z-scores at each Cube of interest (COI) (group means for upper panel, individual z-scores for lower panel. COIs 1–4: caudal autonomic region with a ventral (CAV) and a dorsal (CAD) COIs 5,6: caudal respiratory (CR) region. COIs 7,8: rostral autonomic (RA) region COIs 9–12: rostral respiratory (RR) region COIs 13–16: periaqueductal gray (Periaqc).
Despite the severe, widespread brainstem atrophy the graph analytical measures in the two SUDEP TLE subjects did not just show a more exaggerated version of the changes seen in the TLE-MTS group. Even in COIs or nodes from regions with pronounced atrophy, nodal degree tended to be lower and local efficiency was clearly higher compared to the TLE-MTS. Nodal betweenness centrality was increased in both SUDEP cases compared to controls but also compared to TLE. Compared to the control group and TLE-MTS the participation coefficients were low even in COIs or nodes from regions with prominent atrophy. This is particular striking in the SUDEP TLE-no patient in whom 3 brainstem modules were identified but all nodes had a participation coefficient of 0. The SUDEP TLE-MTS patient had 5 brainstem modules and also comparatively low participation coefficients even when accounting for the number of modules (cf. Table 1).
4. Discussion
There were three major findings in this study. 1. TLE-MTS and to a lesser degree TLE-no is associated with volume loss in the dorsal mesencephalon that is most prominent in the region of the periaqueductal gray, colliculi, raphe and reticular formation and extends into the diencephalon particularly the medial posterior thalamus. 2. Graph analysis based on a measure that favored the interaction between regions with a similar degree of atrophy was used to characterize the impact of the mesencephalic volume loss on brainstem regions containing nuclei involved in the central autonomic controls. Nodal degree and local efficiency were increased in regions with volume loss in TLE-MTS compared controls. A similar pattern of graph analytical abnormalities was found in the mesencephalic nodes of TLE-no but these abnormalities did not reach significance. 3. Mesencephalic volume losses were also seen in the two SUDEP TLE patients. In contrast to the two TLE groups though, this volume loss was not only more severe but in the case of the SUDEP TLE-MTS patient also more widespread, i.e. extended into the dorsal section of the pons and even upper medulla oblongata. The graph analytical signature of these abnormalities was different from that observed in TLE, i.e. was characterized by comparatively decreased nodal degree and nodal participation coefficients but increased local efficiency and nodal betweenness centrality. Taken together, we found evidence for volume loss/atrophy in brainstem regions involved in the autonomic control in TLE. These changes were not only more pronounced in the two SUDEP cases but also associated with graph analytical abnormalities that indicated an impaired interaction between those regions. The following paragraphs will discuss these findings and propose a scenario how the observed brainstem abnormalities might lead to SUDEP.
The refinement of quantitative image analysis methods in the recent years has led to the insight that even epilepsy types with well-defined epileptic focus such as TLE-MTS are associated with widespread structural abnormalities beyond the epileptogenic focus (Mueller et al., 2009; Bernhardt et al., 2008). The current study adds the dorsal mesencephalon to the list of regions showing volume loss in TLE. The brainstem has a very complex anatomy with a great number of tightly packed structures. Many structures are not well defined though and in vivo MRI at 4T does not even resolve those that are easily recognizable in histological preparations. This impacts the precision by which deformation based morphometry can localize volume losses in the brainstem and constitutes an important limitation that has to be kept in mind in the following discussions. The regions with the most pronounced atrophy encompass the mesencephalic periaqueductal gray, the mesencephalic raphe and reticular formation and the monoaminergic cell groups in these regions. This region is part of a larger brainstem region that interacts via the dorsal longitudinal fascicle and medial forebrain bundle with the hypothalamus, thalamus, amygdala, hippocampus and mesial prefrontal cortex (Nieuwenhuys et al., 1988-1989), i.e. regions that are typically atrophied in TLE. One possible explanation for this mesencephalic volume loss is therefore loss of afferent input from forebrain regions that are atrophied in TLE. An alternative explanation is neuronal cell loss due to excitotoxic effects of TLE seizures propagating into the mesencephalon. The graph analytical abnormalities in both TLE groups were restricted to the regions with the most pronounced atrophy and were consistent with the pattern of homogeneous atrophy or a single mechanism causing the atrophy.
The two SUDEP TLE patients had volume losses in the dorsal mesencephalon that had a similar pattern as that observed in the single subject analysis of the TLE-MTS and TLE-no cases. However, the volume losses were more severe and in the case of the SUDEP TLE-MTS expanded into pontine and even medullary regions. Furthermore, the pattern of the graph analytical abnormalities in these two patients was consistent with heterogeneous atrophy, i.e., more than one mechanism contributing to the volume loss. Given the similarities with the TLE group, it is reasonable to assume that the same mechanisms that were discussed for TLE, i.e., deafferentation or excitotoxic effects of propagating seizure activity also caused the volume losses in that region in the two SUDEP TLE patients (mechanism 1). Animal studies suggest that volume losses in dorsal mesencephalon can negatively affect seizure control. For example, electrical or chemical stimulation of the colliculi or the mesencephalic periaqueductal gray in genetically epilepsy prone rats can cause brainstem seizures that can spread to the forebrain with repeated stimulation (Redgrave et al., 1992; Merrill et al., 2003, Peterson et al., 2000). Based on that, it could be hypothesized that a volume loss in these regions could predispose patients to suffer longer lasting and/or more severe seizures with increased risk for secondary generalization (Magdaleno-Madrigal et al., 2002; Faingold, 2012). More important in the context of SUDEP however is that several structures in the most severely affected region, e.g. the periaqueductal gray and the cuneiform nucleus, belong to a network of brainstem structures involved the cardio-vascular control (Pelosi et al., 2012; Dampney et al., 2013; Nasimi et al., 2012; Korte et al., 1992). Structural abnormalities in these regions could therefore impair the autonomic control in the interictal state (Surges et al., 2009) and cause critical autonomic disturbances, e.g., cardiac arrhythmias and respiratory impairment severe enough to result in hypoxemia, during the ictal and immediately postictal period (Ryvlin et al., 2013). In situations of heightened demand due to seizures (Blumenfeld et al., 2004), even relatively short phases of hypoxemia could then lead to additional damage in vulnerable regions, e.g. the watershed area that encompasses the solitary tract nucleus (Jaster et al., 2008; De Caro et al., 2000; Lorin de la Grandmaison et al., 2001; Sarnat et al., 2004), and so not only aggravate the existing damage but also cause additional damage in hitherto unaffected brainstem regions (mechanism 2). Over time the damage caused by such seizure-related hypoxic episodes could accumulate and ultimately become severe enough to lead to the type of complete breakdown of the autonomic control in a situation of heightened demand that seems to be the hallmark of SUDEP (Jaster et al., 2008; Ryvelin et al., 2013). This scenario indicates that this seizure related lesion in the dorsal mesencephalon, if it affects structures involved in autonomic control, could be sufficient to pose a risk factor for SUDEP. However, as mentioned previously, the autonomic control system has also a cortical representation and these regions can be affected in TLE as well. Therefore it cannot be excluded that cortical lesions in the autonomic control system also play a role in SUDEP, either alone or in a combination with a brainstem lesion. A preliminary investigation of this question in the two SUDEP patients reported here, showed that the SUDEP TLE-no patient had regions of severe gray matter loss in the posterior insula bilaterally (z-score ← 2) but that the SUDEP TLE-MTS patient had only relatively mild (z-score ← 1.0 >-2.0) gray matter losses in those regions. Further studies that investigate the impact of cortical and brainstem lesions on autonomic control in the interictal and ictal state will be necessary to understand the potential contribution of these two regions to SUDEP.
The study has several limitations 1. As pointed out above, the contrast properties and resolution of an in vivo MRI are not sufficient to delineate even histologically well defined brainstem structures which reduces the accuracy by which the region of maximal volume loss can be localized. However special care was taken to ensure that the same upper and lower brainstem boundaries were applied to each extracted brainstem and so the localization of the volume loss along the rostral-causal axis should be accurate. 2. The network used for graph analysis consisted of only 16 nodes that had been identified as having high probability to include crucial autonomic structures based on macroscopic landmarks. This is a relatively small network and it cannot be excluded that its size might have influenced the findings. The rationale behind this strategy was to restrict the analysis to regions belonging to the autonomic network and to exclude input from regions not involved into the autonomic control that could have obscured the disturbances within the autonomic control system. 3. The sample size of this study was small and the findings need to be confirmed in a larger population of TLE and SUDEP TLE but also in other epilepsy types.
In conclusion, TLE can be associated with atrophic changes in brainstem regions involved in central autonomic control that could be responsible for interictal and ictal autonomic disturbances which can aggravate the damage to critical parts of the autonomic control system and thus potentially increase the risk for SUDEP. The preliminary findings in this study suggest that deformation-based morphometry using a standard MRI exam in combination with advanced graph analysis does not only detect this volume loss but might also be able to identify features that indicate that the volume loss is severe enough to critically impair the autonomic system making a life threatening breakdown of the autonomic control during a seizure possible. If these findings are confirmed, brainstem deformation-based morphometry combined with graph analysis could be used to identify patients at risk in whom an intensive surveillance and aggressive seizure control are warranted (Ryvlin et al., 2013b).
Acknowledgment
This work was supported by the NIH grant RO1-NS31966 to K.D.L. None of the authors has a conflict of interest to declare with regards to the findings reported in this manuscript.
Appendix A. Supplementary material
Supplementary Fig. 1.
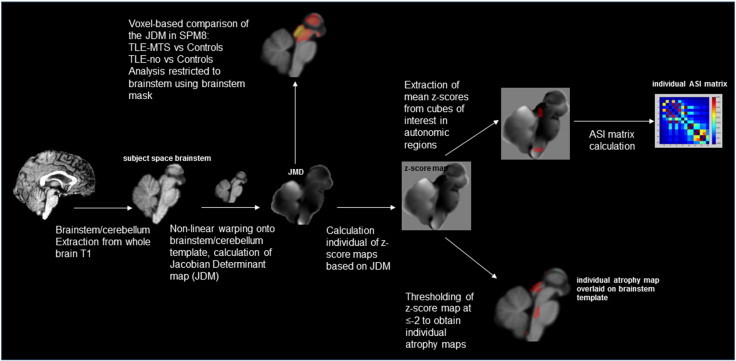
Step by step image processing and generation of ASI matrices. Please see annotations in figure and description in the methods section for more details.
References
- Shorvon S., Tomson T. Sudden unexpected death in epilepsy. Lancet. 2011;378:2028–2038. doi: 10.1016/S0140-6736(11)60176-1. [DOI] [PubMed] [Google Scholar]
- Tomson T., Nashef L., Ryvlin P. Sudden unexpected death in epilepsy: Current knowledge and future directions. Lancet Neurology. 2008;7:1021–1031. doi: 10.1016/S1474-4422(08)70202-3. [DOI] [PubMed] [Google Scholar]
- Ryvlin P., Nashef L., Lhatoo S.D., Bateman L.M., Bird J., Bleasel A., Boon P., Crespel A., Dworetzky B.A., Høgenhaven H., Lerche H., Maillard L., Malter M.P., Marchal C., Murthy J.M.K., Nitsche M., Pataraia E., Rabben T., Rheims S., Sadzot B., Schulze-Bonhage A., Seyal M., So E.L., Spitz M., Szucs A., Tan M., Tao J.X., Tomson T. Incidence and mechanisms of cardiorespiratory arrests in epilepsy monitoring units (MORTEMUS): A retrospective study. Lancet Neurology. 2013;12:966–977. doi: 10.1016/S1474-4422(13)70214-X. [DOI] [PubMed] [Google Scholar]
- Bateman L.M., Spitz M., Seyal M. Ictal hypoventilation contributes to cardiac arrhythmia and SUDEP: Report on two deaths in video-EEG-monitored patients. Epilepsia. 2010;51:916–920. doi: 10.1111/j.1528-1167.2009.02513.x. [DOI] [PubMed] [Google Scholar]
- Seyal M., Hardin K.A., Bateman L.M. Postictal generalized EEG suppression is linked to seizure-associated respiratory dysfunction but not postictal apnea. Epilepsia. 2012;53:825–831. doi: 10.1111/j.1528-1167.2012.03443.x. [DOI] [PubMed] [Google Scholar]
- Scanlon C., Mueller S.G., Cheong I., Hartig M., Weiner M.W., Laxer K.D. Grey and white matter abnormalities in temporal lobe epilepsy with and without mesial temporal sclerosis. Journal of Neurology. 2013;260:2320–2329. doi: 10.1007/s00415-013-6974-3. [DOI] [PMC free article] [PubMed] [Google Scholar]
- Mueller S.G., Laxer K.D., Barakos J., Cheong I., Garcia P., Weiner M.W. Widespread neocortical abnormalities in temporal lobe epilepsy with and without mesial sclerosis. NeuroImage. 2009;46:353–359. doi: 10.1016/j.neuroimage.2009.02.020. [DOI] [PMC free article] [PubMed] [Google Scholar]
- Bernhardt B.C., Worsley K.J., Besson P., Concha L., Lerch J.P., Evans A.C., Bernasconi N. Mapping limbic network organization in temporal lobe epilepsy using morphometric correlations: Insights on the relation between mesiotemporal connectivity and cortical atrophy. Neuroimage. 2008;42:515–524. doi: 10.1016/j.neuroimage.2008.04.261. [DOI] [PubMed] [Google Scholar]
- Mueller S.G., Laxer K.D., Barakos J., Cheong I., Garcia P., Weiner M.W. Subfield atrophy pattern in temporal lobe epilepsy with and without mesial sclerosis detected by high-resolution MRI at 4 Tesla: Preliminary results. Epilepsia. 2009;50:1474–1483. doi: 10.1111/j.1528-1167.2009.02010.x. [DOI] [PMC free article] [PubMed] [Google Scholar]
- Nagai M., Hoshide S., Kario K. The insular cortex and cardiovascular system: A new insight into the brain-heart axis. Journal of the American Society of Hypertension: JASH. 2010;4:174–182. doi: 10.1016/j.jash.2010.05.001. [DOI] [PubMed] [Google Scholar]
- Fischl B., Salat D.H., Busa E., Albert M., Dieterich M., Haselgrove C., van der Kouwe A., Killiany R., Kennedy D., Klaveness S., Montillo A., Makris N., Rosen B., Dale A.M. Whole brain segmentation: Automated labeling of neuroanatomical structures in the human brain. Neuron. 2002;33:341–355. doi: 10.1016/s0896-6273(02)00569-x. [DOI] [PubMed] [Google Scholar]
- Ashburner J. A fast diffeomorphic image registration algorithm. Neuroimage. 2007;38:95–113. doi: 10.1016/j.neuroimage.2007.07.007. [DOI] [PubMed] [Google Scholar]
- Crawford J.R., Howell D.C. Comparing an individual’s test score against norms derived from small samples. Clinical Neuropsychologist (Neuropsychology, Development and Cognition: Section D) 1998;12:482–486. [Google Scholar]
- Naidich T.P., Duvernoy H.M., Delman B.N., Sorensen A.G., Kollias S.S., Haacke E.M. Duvernoy’s Atlas of the Human Brain Stem and Cerebellum. High Field MRI: Surface Anatomy, Internal Structure, Vascularization and 3D Sectional Anatomy. Springer; Verlag/Wien: 2009. [Google Scholar]
- He Y., Evans A. Graph theoretical modeling of brain connectivity. Current Opinion in Neurology. 2010;23:341–350. doi: 10.1097/WCO.0b013e32833aa567. [DOI] [PubMed] [Google Scholar]
- Alexander-Bloch A., Raznahan A., Bullmore E., Giedd J. The convergence of maturational change and structural covariance in human cortical networks. Journal of Neuroscience: the Official Journal of the Society for Neuroscience. 2013;33:2889–2899. doi: 10.1523/JNEUROSCI.3554-12.2013. [DOI] [PMC free article] [PubMed] [Google Scholar]
- Carlo C.N., Stevens C.F. Structural uniformity of neocortex, revisited. Proceedings of the National Academy of Sciences of the United States of America. 2013;110:1488–1493. doi: 10.1073/pnas.1221398110. [DOI] [PMC free article] [PubMed] [Google Scholar]
- Chen C.H., Panizzon M.S., Eyler L.T., Jernigan T.L., Thompson W., Fennema-Notestine C., Jak A.J., Neale M.C., Franz C.E., Hamza S., Lyons M.J., Grant M.D., Fischl B., Seidman L.J., Tsuang M.T., Kremen W.S., Dale A.M. Genetic influences on cortical regionalization in the human brain. Neuron. 2011;72:537–544. doi: 10.1016/j.neuron.2011.08.021. [DOI] [PMC free article] [PubMed] [Google Scholar]
- Evans A.C. Networks of anatomical covariance. Neuroimage. 2013;80:489–504. doi: 10.1016/j.neuroimage.2013.05.054. [DOI] [PubMed] [Google Scholar]
- Sporns O., Tononi G., Edelman G.M. Theoretical neuroanatomy: Relating anatomical and functional connectivity in graphs and cortical connection matrices. Cerebral Cortex (New York, N.Y.: 1991) 2000;10:127–141. doi: 10.1093/cercor/10.2.127. [DOI] [PubMed] [Google Scholar]
- Nieuwenhuys R., Veening J.G., van Domburg P. Core and paracores; some new chemoarchitectural entities in the mammalian neuraxis. Acta Morphologica Neerlando-Scandinavica. 1988-1989;26:131–163. [PubMed] [Google Scholar]
- Redgrave P., Simkins M., Overton P. Anticonvulsant role of nigrotectal projection in the maximal electroshock model of epilepsy--I. Mapping of dorsal midbrain with bicuculline. Neuroscience. 1992;46:379–390. doi: 10.1016/0306-4522(92)90059-b. [DOI] [PubMed] [Google Scholar]
- Merrill M.A., Clough R.W., Jobe P.C., Browning R.A. Role of the superior colliculus and the intercollicular nucleus in the brainstem seizure circuitry of the genetically epilepsy-prone rat. Epilepsia. 2003;44:305–314. doi: 10.1046/j.1528-1157.2003.31802.x. [DOI] [PubMed] [Google Scholar]
- Peterson S.L., Armstrong J.J., Walker M.K. Focal microinjection of carbachol into the periaqueductal gray induces seizures in the forebrain of the rat. Epilepsy Research. 2000;42:169–181. doi: 10.1016/s0920-1211(00)00177-7. [DOI] [PubMed] [Google Scholar]
- Magdaleno-Madrigal V.M., Valdés-Cruz A., Martínez-Vargas D., Martínez A., Almazán S., Fernández-Mas R., Fernández-Guardiola A. Effect of electrical stimulation of the nucleus of the solitary tract on the development of electrical amygdaloid kindling in the cat. Epilepsia. 2002;43:964–969. doi: 10.1046/j.1528-1157.2002.05702.x. [DOI] [PubMed] [Google Scholar]
- Faingold C.L. Brainstem Networks: Reticulocortical synchronization in generalized convulsive seizures. In: Noebels J.L., Avoli M., Rogawski M.A., Olsen R.W., Delgado-Escueta A.V., editors. Jasper’s Basic Mechanisms of the Epilepsies. fourth edition. Bethesda (M.D.) National Center for Biotechnology Information (US); 2012. [PubMed] [Google Scholar]
- Pelosi G.G., Busnardo C., Tavares R.F., Corrêa F.M. Cardiovascular responses to glutamate microinjection in the dorsomedial periaqueductal gray of unanesthetized rats. Journal of Neuroscience Research. 2012;90:2193–2200. doi: 10.1002/jnr.23094. [DOI] [PubMed] [Google Scholar]
- Dampney R.A., Furlong T.M., Horiuchi J., Iigaya K. Role of dorsolateral periaqueductal grey in the coordinated regulation of cardiovascular and respiratory function. Autonomic Neuroscience: Basic & Clinical. 2013;175:17–25. doi: 10.1016/j.autneu.2012.12.008. [DOI] [PubMed] [Google Scholar]
- Nasimi A., Shafei M.N., Alaei H. Glutamate injection into the cuneiform nucleus in rat, produces correlated single unit activities in the Kolliker-Fuse nucleus and cardiovascular responses. Neuroscience. 2012;223:439–446. doi: 10.1016/j.neuroscience.2012.07.041. [DOI] [PubMed] [Google Scholar]
- Korte S.M., Jaarsma D., Luiten P.G.M., Bohus B. Mesencephalic cuneiform nucleus and its ascending and descending projections serve stress-related cardiovascular responses in the rat. Journal of the Autonomic Nervous System. 1992;41:157–176. doi: 10.1016/0165-1838(92)90137-6. [DOI] [PubMed] [Google Scholar]
- Surges R., Henneberger C., Adjei P., Scott C.A., Sander J.W., Walker M.C. Do alterations in inter-ictal heart rate variability predict sudden unexpected death in epilepsy? Epilepsy Research. 2009;87:277–280. doi: 10.1016/j.eplepsyres.2009.08.008. [DOI] [PubMed] [Google Scholar]
- Blumenfeld H., McNally K.A., Vanderhill S.D., Paige A.L., Chung R., Davis K., Norden A.D., Stokking R., Studholme C., Novotny E.J., Zubal G., Spencer S.S. Positive and negative network correlations in temporal lobe epilepsy. Cerebral Cortex (New York, N.Y.: 1991) 2004;14:892–902. doi: 10.1093/cercor/bhh048. [DOI] [PubMed] [Google Scholar]
- Jaster J.H., Ottaviani G., Matturri L., Lavezzi A.M., Zamecnik J., Smith T.W. Sudden unexpected death related to medullary brain lesions. American Journal of Forensic Medicine and Pathology. 2008;29:371–374. doi: 10.1097/PAF.0b013e3181847dfc. [DOI] [PubMed] [Google Scholar]
- De Caro R., Raffaele De Caro, Parenti A., Montisci M., Guidolin D. Solitary tract nuclei in acute heart failure. Stroke; a Journal of Cerebral Circulation. 2000;31:1187–1193. doi: 10.1161/01.str.31.5.1187. [DOI] [PubMed] [Google Scholar]
- Lorin de la Grandmaison G., Paraire F., Onaya M., Gray F. Symmetrical necrosis of the solitary tract nuclei as a contributory cause of death. International Journal of Legal Medicine. 2001;115:170–172. doi: 10.1007/s004140100245. [DOI] [PubMed] [Google Scholar]
- Sarnat H.B. Watershed infarcts in the fetal and neonatal brainstem. An aetiology of central hypoventilation, dysphagia, Möibius syndrome and micrognathia. European Journal of Paediatric Neurology: EJPN: Official Journal of the European Paediatric Neurology Society. 2004;8:71–87. doi: 10.1016/j.ejpn.2003.12.005. [DOI] [PubMed] [Google Scholar]
- Ryvlin P., Nashef L., Tomson T. Prevention of sudden unexpected death in epilepsy: A realistic goal? Epilepsia. 2013;54(Suppl 2):23–28. doi: 10.1111/epi.12180. [DOI] [PubMed] [Google Scholar]