

Abstract
We report a DNA-gold nanoparticle (DNA-GNP) based lateral flow nucleic acid biosensor for visual detection of microRNA (miRNA)-215 in aqueous solutions and biological samples with low-cost and short analysis time. Sandwich-type hybridization reactions among GNP-labeled DNA probe, miRNA-215 and biotin-modified DNA probes were performed on the lateral flow device. The accumulation of GNPs on the test zone of the biosensor enables the visual detection of miRNA-215. After systematic optimization, the biosensor was able to detect a minimum concentration of 60 pM miRNA-215. The biosensor was applied to detect miRNA-215 from A549 cell lysate directly without complex sample treatment, and the detection limit of 0.148 million cells was obtained. This study provides a simple, rapid, specific and low-cost approach for miRNA detection in aqueous solutions and biological samples, showing great promise for clinical application and biomedical diagnosis in some malignant diseases.
Keywords: MicroRNA, Lateral flow biosensor, Nucleic acid, Visual detection
1. Introduction
MicroRNAs (miRNAs) are a class of small (∼18-25 nucleotides) noncoding RNAs that serve as post-transcriptional regulators of gene expression in a broad range of plants, viruses and mammals (Heidenreich et al. 2010; Wightman et al. 1993). Mature miRNAs are considered to regulate gene expression by catalyzing the cleavage of messenger RNA and incorporation into RNA-induced silencing complex (RISC) where they interact with complementary sites on messenger RNA as well as downstream regulation of the expression of target messenger RNA molecules (Engels and Hutvagner 2006; Meister and Tuschl 2004). Especially, some miRNA expression patterns are associated with some malignant diseases such as liver-related diseases, cardiovascular diseases and cancers. Therefore, miRNAs are considered as potential biomarkers specific to corresponding tissues or diseases (Bartel 2004). The detection of microRNA is a challenge due to its instability, short sequence, trace-amounts, and the complex interferences from biological samples miRNA (Engels and Hutvagner 2006; Meister and Tuschl 2004). Conventional methods, such as real-time polymerase chain reaction (RT-PCR), northern blotting and microarray analysis, offer high accuracy and sensitivity for miRNAs measurement (Heidenreich et al. 2010; Peng and Gao 2011). However, most of these methods require time-consuming sample pretreatment, tedious and complicated procedures and harsh experimental conditions as well as high experimental cost (Jia et al. 2010; Li et al. 2011; Linsen et al. 2009; Válóczi et al. 2004; Wark et al. 2008). These issues dramatically restrict their further practical applications. As a result, it is highly desirable to develop a facile, rapid, and economical approach for accurate detection of miRNA.
Nowadays, with the achievements of nanotechnology, nanoparticles-based biosensors have aroused great interests, because nanoparticles could favour the signal amplification to achieve high sensitivity and selectivity for target analysis (Dong et al. 2013; Su et al. 2013; Zhang et al. 2013). A kind of lateral flow strip biosensor that combines nanoparticles with conventional immunoassay has attracted significant attention in biological analysis and clinical diagnosis in recent years (Singer and Plotz 1956; Zhang et al. 2006). The lateral flow strip biosensors are considered as one of the most promising technologies owing to their simplicity, rapid analysis, low costs, high sensitivity and specificity (Zhang et al. 2006). In addition, they show less interference and long-term stability over a wide range of climates (Cho et al. 2005). To date, several lateral flow strip biosensors have been developed to detect many objects such as DNA, mRNA, proteins (Mao et al. 2009; Xu et al. 2008), biological agents (Fisher et al. 2009; Liu et al. 2009; Nakasone et al. 2007; O'Keeffe et al. 2003; Xia et al. 2009) and chemical contaminants (He et al. 2011; Li et al. 2007). Nevertheless, there are very few reports on miRNA analysis using the lateral flow strip biosensors.
Herein, we report a lateral flow nucleic acid biosensor (LFNAB) for specific qualitative (visual)/quantitative analysis of miRNA in aqueous solutions and biological samples. MiRNA-215 was chosen as the target analyte, which plays crucial regulatory roles in A549 cell cycle progression through coordinately regulating the expression of key cell cycle transcripts (Georges et al. 2008). Experimental conditions were optimized on LFNABs by testing miRNA-215 in aqueous solution. Under the optimal conditions, target miRNA-215 was successfully detected by LFNABs in A549 cell lysate without complex sample treatment. The promising properties of the approach are reported in the following sections.
2. Experimental
2.1. Production of cell lysates
CCRF-CEM (CCL-119, Peripheral Blood, Human/Homo sapiens) and A549 (CCL-185, Lung Carcinoma, Human/Homo sapiens) were purchased from the American Type Culture Collection (ATCC) and cultivated followed the cell culture methods of ATCC.
Cell layer was firstly washed by phosphate buffered saline (PBS, pH 7.0), and then rinsed with 3 mL of Trypsin-EDTA solution (0.25% (w/v) Trypsin-0.53 mM EDTA) at 37°C until cell layer was dispersed (usually within 5 to 15 minutes). After the incubation, the dispersed cells were centrifuged at a rate of 1800 rpm for 5 minutes at 10°C, and then washed with 10 mL of PBS twice. After discarding the supernatant, the resulted cells were re-suspended in cell lysis buffer, and the solution was harvested by QIA shredder (Mini spin column). The resulting cell lysate was obtained through QIA shredder and collected in 1.5 mL EP tube. The cell lysate should be stored at -80°C for further use.
2.2. Apparatus and reagents
The Airjet AJQ 3000 dispenser, Biojet BJQ 3000 dispenser, Clamshell Laminator, and the Guillotine cutting module CM 4000 were purchased from Biodot LTD (Irvine, CA). The DT1030 portable strip reader was purchased from Shanghai Goldbio Tech. Co., LTD (Shanghai, China). Labconco class II biosafety cabinet (LFBSC class II type A2) was provided by Labconco (USA). Cellometer Auto T4 plus cell counter was provided by Nexcelom Bioscience (USA).
Streptavidin was purchased from Streptomyces avidinii. HAuCl4, sucrose, hydroxylamine, Na3PO4·12H2O, Tween 20, Triton X-100, trisodium citrate, deoxyadenosine triphosphate (dATP-sodium citrate (SSC) buffer (pH = 7.0), PBS (pH = 7.4) trypsin, EDTA and trypan blue solution (0.4%) were purchased from Sigma-Aldrich and used without further purification. Glass fibers (GFCP000800), cellulose fiber sample pads (CFSP001700), laminated cards (HF000MC100), and nitrocellulose membranes (HFB18004 and HFB 24004) were purchased from Millipore (Billerica, MA). Target miRNAs and oligonucleotide probes used in this study were obtained from Integrated DNA Technologies, Inc. (Coralville, IA) and have the following sequences:
Target miRNA-215 (has-miR-215): 5′-AUG ACC UAU GAA UUA ACA GAC-3′ (Georges et al. 2008; Pichiorri et al. 2010)
Target miRNA-224 (has-miR-224):5′-AAA AUG GUG CCC UAG UGA CUA CA-3′ (Feitelson and Lee 2007; Wang et al. 2008)
Detection probe (probe 1): 5′-/ThioMC6-D/GTC TGT CAA-3′
Capture probe (probe 2): 5′-ATA GGT CAT/Biotin/-3′
Control probe (probe 3): 5′-/Biotin/TGG ACA GAC-3′
2.3. Preparation of DNA/GNPs conjugate
The DNA/GNPs conjugate was prepared according to the reported methods with slight modifications. (He et al. 2011; Zhao et al., 2007) dATP was added into 1 mL of concentrated GNPs solution (final concentration of dATP is 7.05 μM, GNPs with the average diameter of 15 ± 3.5 nm were synthesized following the procedures reported previously (Xu et al. 2008)). The mixture was incubated at room temperature for 20 minutes. 15 μL of 1% of SDS was slowly added into the mixture, and incubated on shaker for 10 minutes. 50 μL of 2 M of NaCl was dropped into the mixture at a rate of 2 μL/2 min. Then 0.25 OD of thiolated DNA (probe 1) was added and the mixture was incubated for 3 hours in water bath at 60°C. The use of dATP was to protect GNPs from salt-induced aggregation by the mononucleotide (A) adsorption in the preparation of thiol-DNA/GNPs conjugate. (Zhao et al. 2007) After the incubation, the mixture was centrifuged at 12000 rpm for 15 minutes, and the supernatant was discarded, then washed with 1 mL of PBS for 3 times, the as-obtained ruby sediments were re-suspended in 1 mL of Eluent Buffer (20 nM of Na3PO4·12H2O containing 5% BSA, 0.25% Tween 20 and 10% sucrose).
2.4. Preparation of streptavidin-biotinylated DNA conjugate
200 μL of 2.5 mg/ml of streptavidin was mixed with 50 nmol biotinylated DNA probe (probe 2 / probe 3). The mixture was incubated on shaker for 1 hour. After adding 500 μL PBS into the mixture, the solution was centrifuged in dialysis tube for 20 minutes at 6000 rpm under 4°C. The above step was repeated for 3 times. The remaining solution in filter was diluted to 600 μL with PBS.
2.5. Preparation of LFNAB
The LFNAB consisted of four components: sample application pad, conjugate pad, nitrocellulose membrane, and absorbent pad. All components were laminated into a sheet of plastic orderly using the Clamshell Laminator (Biodot, Irvin, CA). The sample application pad (17 mm × 30 cm) was made from glass fiber (CFSP001700, Millipore) and saturated with a Tris-HCl buffer (pH 8.0) containing 0.23% of Triton X-100, 0.05 M of Tris-HCl and 0.15 M of NaCl. Then, the pad was dried at 37°C for 2 h and stored in desiccators at room temperature (RT) (Liu et al. 2009; Mao et al. 2009). The test zone and control zone on the nitrocellulose (NC) membrane were prepared by dispensing streptavidin-biotinylated capture probe and streptavidin-biotinylated control probe solutions, respectively. The distance between the test and control zones was 3 mm. The membrane was then dried at 37°C for 1 h and stored at 4°C in a dry state. Finally, the sample pad, conjugate pad, nitrocellulose membrane, and absorption pad were assembled on a plastic adhesive backing (60 mm × 30 cm) using the clamshell laminator (He et al. 2011). Each part overlapped 2 mm to ensure that the solution could migrate through the strip during the assay. Strips with a 3-mm width were cut using the Guillotin CM 4000 cutting module. The DNA/GNPs conjugate was dropped on the conjugate pad.
2.6. Assay procedure
In a typical miRNA test on LFNAB, 100 μL of running buffer (25% SSC buffer containing 4% BSA) with the desired amount of target miRNA-215 was applied to the sample pad. 5 μL of DNA/GNPs conjugate was loaded on the conjugate pad. During the assay process, the solution migrated up by capillary force. The test zone and control zone were evaluated visually within 20 min. For quantitative measurements, the optical intensity of the red band was recorded using the portable “strip reader” instrument combined with “GoldBio strip reader” software.
In the case of detecting target miRNA in CCRF-CEM (CCL-119) cell lysate and A549 (CCL-185) cell lysate, 20 μL of cell lysate containing certain amount of cells was mixed with 80 μL of running buffer, and the performances were tested on LFNABs followed the procedures described above.
3. Results and discussion
3.1. Principle of LFNAB
The principle of the LFNAB measurement is based on sandwich type of “DNA-miRNA-DNA/GNPs” hybridization reactions. The configuration and measurement principle are illustrated in Scheme 1. In this study, three DNA probes were used: the two biotin-DNA probe (probe 2 and probe 3) were firstly linked with streptavidin and then dispensed on the nitrocellulose membrane to form the test zone and control zone, respectively. The thiolated detection DNA probe (probe 1) was immobilized on the GNPs and the resulting DNA/GNPs conjugate was loaded on the conjugate pad (Scheme 1A). In a typical assay, the sample solution containing desired amount of target miRNA was applied onto the sample pad. Subsequently, the solution migrated by capillary action and passed the conjugate pad, and then the hybridization between the target miRNA and DNA probe 1 of the DNA/GNPs conjugates occurred, and the formed miRNA-DNA/GNPs complexes continued to migrate along the strip. When the resulting complexes reached the test zone, they were captured by the second hybridization between the miRNA and the DNA probe 2 (capture probe). The accumulation of GNPs produced a characteristic red band on the test zone. Then the excess DNA/GNPs conjugates continued to migrate through the control zone and captured by DNA probe 3 (control probe, complementary with DNA probe 1) (Scheme 1B). Finally, two red bands were shown (Scheme 1C left). In the absence of miRNAs, only one red band was observed in the control zone (Scheme 1C right). In this case, the red band in the control zone showed that the biosensor is working properly. Qualitative analysis was simply performed by observing the colour change of the test zone. For quantitative measurements, the optical intensities of the red bands were read using the portable “strip reader” instrument combined with “GoldBio strip reader” software. Scheme 1D displays the typical photo images and corresponding optical responses of the LFNAB in the presence (2.5 nM) and absence (0 nM) of miRNA-215. Two red bands could be observed in the presence of target miRNA-215 (Scheme 1D left), whereas only one red band was observed in the absence of target miRNA (Scheme 1D right).
Scheme 1.
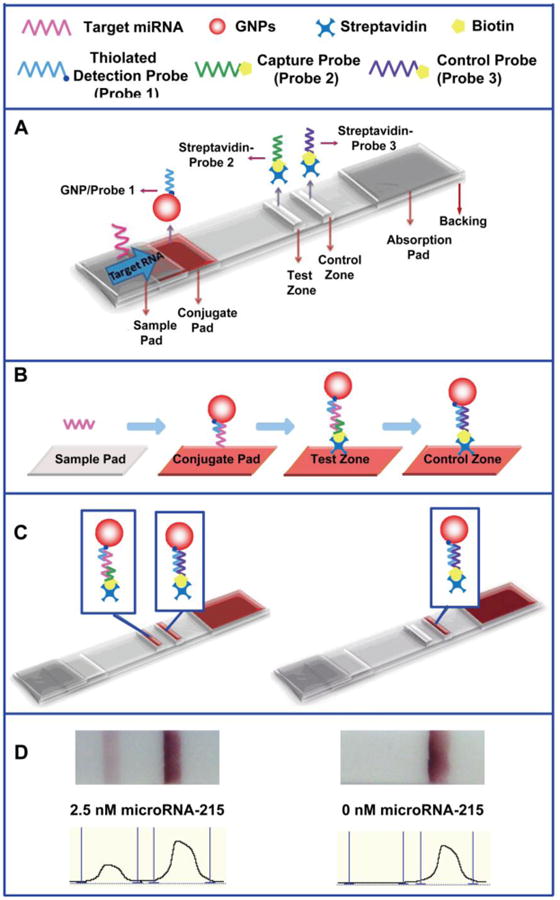
A) Schematic illustration of the configuration and measurement principle of the LFNAB; B) schematic illustration of the sandwich assay procedure; C) the principle of visual detection in the presence (left) and absence (right) of miRNA-215; D) typical photo images and recorded optical responses of LFNABs in the presence (2.5 nM) and absence (0 nM) of miRNA-215. Assay time: 20 min.
3.2. Optimization of the preparation of LFNAB
Considering that the accumulation of GNPs on the test and control zone could affect the responses of the LFNAB, various factors were systematically investigated by comparing the analytical performances of the LFNABs on detecting 1-nM miRNA-215, including membrane material, the concentration of GNPs, the volume of DNA/GNPs conjugate loaded on the sample pad and the amounts of streptavidin-biotinylated DNA conjugate dispensed on the test zone. In our study, two kinds of membranes including HFB18004 and HFB24004 (the corresponding migration time was 3 min and 4 min, respectively) were used to test the response of miRNA on LFNAB. Fig. 1A demonstrates that the S/N ratio of LFNABs prepared with the HFB24004 nitrocellulose membrane is higher than the responses of those prepared with the HFB18004 nitrocellulose membrane, indicating that longer migration time is favorable for the performing of sandwich-type complexes on LFNAB. The whole reaction time was around 20 min when utilizing HFB18004 nitrocellulose membrane as the test membrane material. The concentration of GNPs used to prepare the DNA/GNPs conjugates and the volume of DNA/GNPs conjugates loaded on the conjugate pad were also optimized. GNPs with different concentrations were prepared by concentrating the GNP stock solutions at different folds. Five-fold, ten-fold and sixteen-fold of GNPs were used to prepare the DNA/GNPs conjugates while the DNA concentrations were kept at the same level in the preparations. As depicted in Fig. 1B, with the increasing concentration of GNPs, the correlated S/N ratio rises. Therefore, sixteen-fold of GNPs was used in the following experiments. The amount of DNA/GNPs conjugate loaded on the conjugate pad has a great effect on the intensities of both test and control zones. To this regard, we studied the effect of DNA/GNPs conjugate on the LFNAB response by loading different volumes of DNA/GNPs conjugate on the conjugate pad (Fig. 1C). It can be seen the S/N ratio increased with the increase of the conjugate volume, further increasing of the conjugate amount led to the decrease of the S/N ratio because of the increased background signal. Therefore, 5 μL of DNA/GNPs conjugate on conjugate pad was the optimal amount, and was adopted in the further experiments. The dispensing time of streptavidin-biotinylated DNA conjugate dispensed on the test zone also influence the response of the LFNAB. Fig. 1D indicates that 4 dispensing times of test zone could obtain the highest S/N ratio. The further increase of the dispensing times would enhance the nonspecific adsorption on the test zone. Therefore, LFNABs with 4 dispensing times of test zone were used in the following study.
Figure 1.
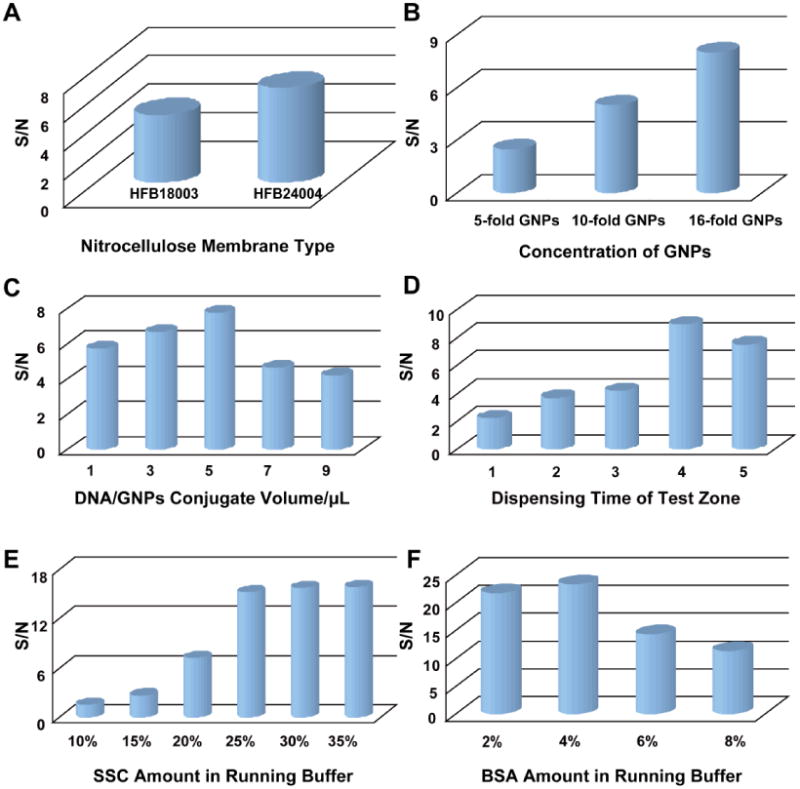
A) effect of membrane material on the S/N ratio of LFNABs; B) effect of the GNPs concentration on the S/N ratio of LFNABs; C) effect of the volume of DNA/GNPs conjugate on the S/N ratio of the LFNABs; D) effect of the dispensing times of the capture DNA probe the test zon on the S/N ratio of the LFNABs; E) effect of SSC concentration and F) BSA concentration in running buffer on the S/N ratios of the LFNABs. Assay time: 20 min; miRNA-215 concentration: 1 nM.
Running buffer plays an important role in hybridization efficiency of DNA and miRNA. Thus suitable buffers would improve the sensitivity, selectivity and reproducibility, and simultaneously, minimize the nonspecific adsorption of the LFNAB. As shown in Fig. 1E, with an increasing amount of SSC from 10% to 25%, the corresponding responses increase significantly. When the concentration of SSC exceeds 25%, the responses remain almost the same. To obtain a maximum response using a minimal amount, buffer containing 25% of SSC was found to be optimal. Another important function of the running buffer is to reduce the nonspecific adsorption of DNA/GNPs conjugate on the nitrocellulose membrane. In the current study, BSA was used to reduce the nonspecific adsorption and thereby enhance the accuracy of the biosensor. As shown in Fig. 1F, the best result is obtained with the 25%) of SSC buffer containing 4% of BSA.
3.3. Analytical characteristics
To investigate the ability of detection of the LFNAB, sample solutions containing different concentrations of target miRNA-215 were examined under the optimized experimental conditions. Fig. 2A displays the typical photo image of the LFNABs in the presence of different miRNA-215 concentrations ranging from 0-10 nM. For qualitative analysis, the red bands in the test zone were observed with as low as 75 pM of miRNA. Quantitative detections were performed by recording the intensities of the test lines with the portable strip reader. The resulting calibration plot (Figure 5) of the intensities of the test bands (peak area) versus miRNA concentration is linear over the 0.075 to 10 nM range and is suitable for quantitative work. The detection limit of 60 pM (based on S/N=3) was estimated. (Fig. 2B) This detection limit (40 pg or 6 fmole) is comparable with that obtained with electrochemical detection. (see Table S1 in supporting material) Since the analytical stability and signal reproducibility were two of the most important criteria to evaluate the biosensor, sample solutions containing 0 nM, 0.5 nM and 2.5 nM of target miRNA-215 were used to examine the performance of the LFNABs. Each concentration was tested six times on six LFNABs. As shown in Fig. 2C, similar responses could be obtained against each concentration. The corresponding RSD values of optical responses were 0.16%, 6.3% and 4.6% respectively, indicating excellent analytical stability and reproducibility.
Figure 2.
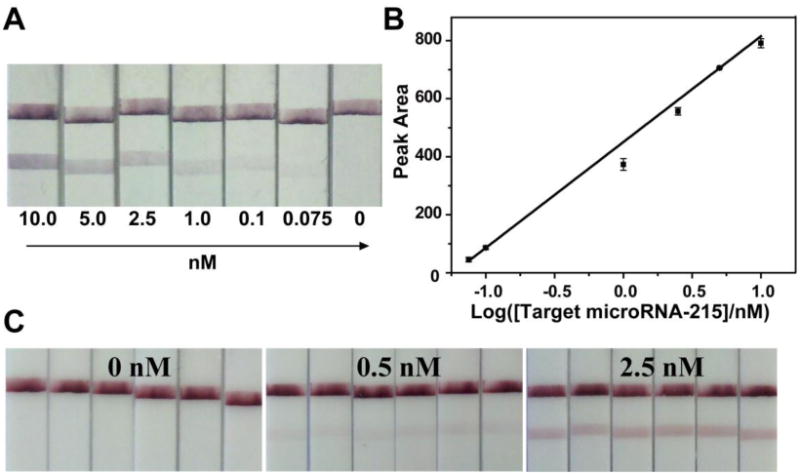
A) Typical photo images of the LFNABs after applying different concentrations of miRNA-215; B) The resulting calibration curve of the intensities of the test bands (peak area) versus miRNA concentration; C) Typical photo images of the LFNABs with different concentrations of target miRNA-215. All of the photo images of the LFNABs were recorded with a digital camera while the optical responses of test zones on the LFNABs were recorded with a strip reader. Assay time: 20 min; running buffer: 25% SSC + 4% BSA; dispensing times of the capture DNA probes on the test zone: 4; the volume of DNA/GNPs conjugate loaded on the conjugate pad: 5 μL.
3.4. Selectivity tests on LFNAB
To implement the detection of target miRNA in real samples, it is essential to assess the analytical selectivity and specificity of the LFNAB against possible interferences in biological samples. Cell lysate contains DNAs, RNAs, proteins and miRNAs, which may interfere the detection of miRNA-215. We testedthe responses of unrelated miRNA and CCRF-CEM cell lysate (control cell line) on LFNABs (Fig. 3). First, LFNABs were employed to test 1-nM miRNA-215, 1-nM miRNA-224, and the mixture of target miRNA-215 (1 nM) and miRNA-224 (1 nM), respectively. Responses from miRNA-224 can be ignored by comparing the responses from target miRNA-215. And no distinct response differences were obtained between the target miRNA-215 and the mixture of miRNA-215 and miRNA-224 (Fig. 3A), indicating that in the analytical procedure, the two DNA probes (capture probe and detection probe) were binding accurately to the correct target sequence. With regards to the binding specificity, the performances of LFNABs in CCRF-CEM (CCL-119) cell lysate were also examined. Certain concentrations of CCRF-CEM cell lysate were spiked with standardized target miRNA-215 at different concentrations (1 nM and 0 nM), and the control experiments were carried out by testing target miRNA-215 in running buffer (Fig. 3B). Under the same concentration of target miRNA-215, no obvious response differences could be observed from the target miRNA and miRNA-cell lysate mixtures, demonstrating that unrelated nucleic acids, proteins or other components existing in cell lysate have no substantial influence on the reaction system. This result suggests the intrinsically binding selectivity and specificity of the LFNABs in biological samples. Apparently, the fascinating LFNABs are readily applied in the facile and rapid detection of miRNAs in real biological samples.
Figure 3.
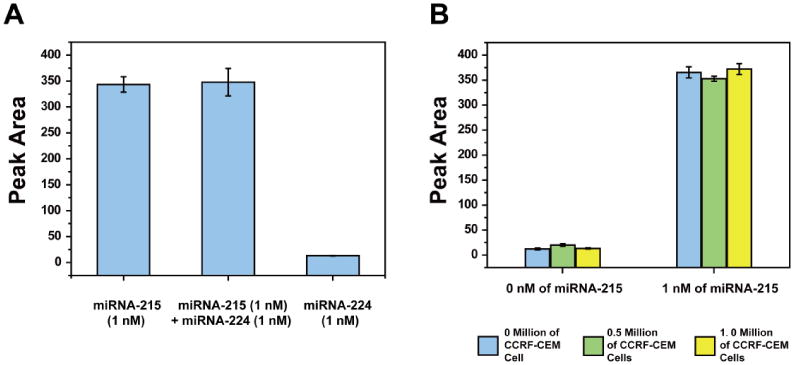
A) The optical intensities (peak areas) of the LFNAB test zones analyzed in the presence of 1-nM miRNA-215, mixture of 1-nM miRNA-215 and 1-nM miRNA-224, and 1-nM miRNA-224; B) the optical intensities of the LFNAB test zones in the presence (1 nM) and absence (0 nM) of target miRNA-215 with different amounts of CCRF-CEM (CCL-119) cells in cell lysate. Blue column (left): 0 million of CCRF-CEM cells; Green column (middle): 0.5 million of CCRF-CEM cells; Yellow column (right): 1.0 million of CCRF-CEM cells. Experimental conditions were same as in Figure 2.
3.5. Analysis of miRNA-215 in A549 cell lysate
To further confirm that this biosensor can be applied for miRNA analysis in biological samples, performances of the LFNABs were challenged by detecting miRNA-215 in complex cell lysate. A549 (CCL-185) was chosen as the target cell line, as the miRNA-215 plays key regulatory roles in A549 cell cycle progression. CCRF-CEM (CCL-119) cell lysate was used as control. Under the optimal experimental conditions, 20 μL of cell lysate samples containing different amounts of lysed A549 and CCRF-CEM cells were mixed with 80 μL of running buffer and the performances were tested on LFNABs. Fig. 4 shows the results for the detection of miRNA-215 in cell lysate samples on LFNABs. As shown in Fig. 4A, the color changes of the test zone could be observed with lower to 0.148 million of target A549 cells. No obvious red bands can be observed from CCRF-CEM cell lysate and cell lysis buffer, indicating that cell lysis buffer and control cell lysate have no substantial influence on this reaction system. For quantitative measurements, the optical intensities of the test zones were recorded by the “strip reader” and shown in Fig. 4B. To our best of knowledge, this is the first time of the successful application of the lateral flow strip biosensor in detection of miRNA in biological sample without any complex purification or separation procedures, suggesting the potential clinical application of miRNA analysis in biomedical diagnosis.
Figure 4.
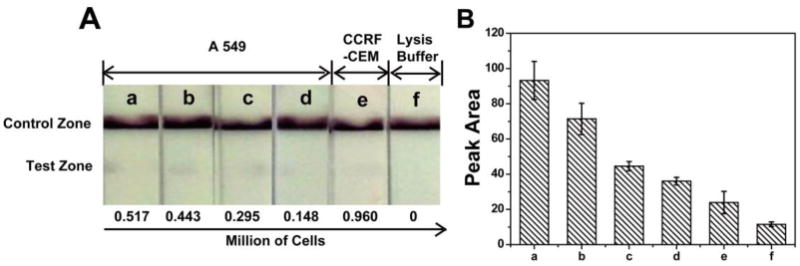
Photo images A) of the LFNABs with different amounts of cells in cell lysate and the resulting optical responses B), the photo images of the LFNABs were recorded with a digital camera, and the optical responses of test zone on the LFNABs were recorded with a strip reader, the corresponding amounts of A549 cells (from a to d) were 0.517 million, 0.443 million, 0.296 million, 0.148 million, respectively; e was 0. 960 million of CCRF-CEM cells; f was lysis buffer. Experimental conditions, same as in Figure 2.
4. Conclusion
We developed DNA-GNP based LFNAB for simple and specific visual sensing of miRNA-215 in aqueous solutions and biological samples. The target miRNA could be easily detected by observing the change of the color and quantified by a simple “strip reader” instrument. Under optimal conditions, a visual and quantitative detection limit of 60 pM in aqueous solutions was obtained within 20 min. The interference from other components in the real complicated biological samples could be negligible during the analysis. In addition, the target miRNA-215 could be successfully detected in A549 cell lysate without complex purification or separation procedures. Compared to other traditional methods (see Table S1 in supporting material), our method offers a simple, fast, selective and sensitive approach to detect miRNA without any complex sample treatment and expensive instrument. Furthermore, the biosensor can be extended to detect other types of miRNA. This study is opening new opportunities for miRNA detection in real biological samples and showing great promise in clinical application and biomedical diagnosis. The concept can be extended to detect other types of miRNA. Improvements in the sensitivity of the LFNAB could be achieved by using horseradish peroxidase (HRP)-GNP dual labels. Further study will include the detection mismatched miRNA and multiplex miRNA detection on the LFNAB.
Supplementary Material
Research Highlights.
This paper reports a visual detection method for microRNA.
The analysis time is 20 min.
MicroRNA is identified in the cell lysate.
Acknowledgments
This research was supported by Award Number R21CA137703 from the National Cancer Institute. X. Zhang acknowledges financial support from the Beijing Natural Science Foundation (Grant No. 2122038), the Fundamental Research Funds for the Central Universities and the Chinese 1000 Elites program and USTB start-up fund.
Footnotes
Publisher's Disclaimer: This is a PDF file of an unedited manuscript that has been accepted for publication. As a service to our customers we are providing this early version of the manuscript. The manuscript will undergo copyediting, typesetting, and review of the resulting proof before it is published in its final citable form. Please note that during the production process errors may be discovered which could affect the content, and all legal disclaimers that apply to the journal pertain.
Contributor Information
Xueji Zhang, Email: zhangxueji@ustb.edu.cn.
Guodong Liu, Email: guodong.liu@ndsu.edu.
References
- Bartel DP. Cell. 2004;116(2):281–297. doi: 10.1016/s0092-8674(04)00045-5. [DOI] [PubMed] [Google Scholar]
- Cho YJ, Lee DH, Kim DO, Min WK, Bong KT, Lee GG, Seo JH. J Agric Food Chem. 2005;53(22):8447–8451. doi: 10.1021/jf051681q. [DOI] [PubMed] [Google Scholar]
- Dong H, Lei J, Ding L, Wen Y, Ju H, Zhang X. Chem Rev. 2013;113(8):6207–6233. doi: 10.1021/cr300362f. [DOI] [PubMed] [Google Scholar]
- Engels B, Hutvagner G. Oncogene. 2006;25(46):6163–6169. doi: 10.1038/sj.onc.1209909. [DOI] [PubMed] [Google Scholar]
- Feitelson MA, Lee J. Cancer Lett. 2007;252(2):157–170. doi: 10.1016/j.canlet.2006.11.010. [DOI] [PubMed] [Google Scholar]
- Fisher M, Atiya-Nasagi Y, Simon I, Gordin M, Mechaly A, Yitzhaki S. Lett Appl Microbiol. 2009;48(4):413–418. doi: 10.1111/j.1472-765X.2008.02542.x. [DOI] [PubMed] [Google Scholar]
- Georges SA, Biery MC, Kim SY, Schelter JM, Guo J, Chang AN, Jackson AL, Carleton MO, Linsley PS, Cleary MA. Cancer Res. 2008;68(24):10105–10112. doi: 10.1158/0008-5472.CAN-08-1846. [DOI] [PubMed] [Google Scholar]
- He Y, Zhang S, Zhang X, Baloda M, Gurung AS, Xu H, Zhang X, Liu G. Biosens Bioelectron. 2011;26(5):2018–2024. doi: 10.1016/j.bios.2010.08.079. [DOI] [PubMed] [Google Scholar]
- Heidenreich B, Pohlmann C, Sprinzl M, Gareis M. J Food Prot. 2010;73(11):2025–2033. doi: 10.4315/0362-028x-73.11.2025. [DOI] [PubMed] [Google Scholar]
- Jia H, Li Z, Liu C, Cheng Y. Angew Chem Int Ed. 2010;49(32):5498–5501. doi: 10.1002/anie.201001375. [DOI] [PubMed] [Google Scholar]
- Li C, Li Z, Jia H, Yan J. Chem Commun. 2011;47(9):2595–2597. doi: 10.1039/c0cc03957h. [DOI] [PubMed] [Google Scholar]
- Li K, Liu L, Xu C, Chu X. Anal Sci. 2007;23(11):1281–1284. doi: 10.2116/analsci.23.1281. [DOI] [PubMed] [Google Scholar]
- Linsen SE, de Wit E, Janssens G, Heater S, Chapman L, Parkin RK, Fritz B, Wyman SK, de Bruijn E, Voest EE. Nat Methods. 2009;6(7):474–476. doi: 10.1038/nmeth0709-474. [DOI] [PubMed] [Google Scholar]
- Liu G, Mao X, Phillips JA, Xu H, Tan W, Zeng L. Anal Chem. 2009;81(24):10013–10018. doi: 10.1021/ac901889s. [DOI] [PMC free article] [PubMed] [Google Scholar]
- Mao X, Ma Y, Zhang A, Zhang L, Zeng L, Liu G. Anal Chem. 2009;81(4):1660–1668. doi: 10.1021/ac8024653. [DOI] [PubMed] [Google Scholar]
- Meister G, Tuschl T. Nature. 2004;431(7006):343–349. doi: 10.1038/nature02873. [DOI] [PubMed] [Google Scholar]
- Nakasone N, Toma C, Lu Y, Iwanaga M. Diagn Microbiol Infect Dis. 2007;57(1):21–25. doi: 10.1016/j.diagmicrobio.2006.05.012. [DOI] [PubMed] [Google Scholar]
- O'Keeffe M, Crabbe P, Salden M, Wichers J, Van Peteghem C, Kohen F, Pieraccini G, Moneti G. J Immunol Methods. 2003;278(1):117–126. doi: 10.1016/s0022-1759(03)00207-2. [DOI] [PubMed] [Google Scholar]
- Peng Y, Gao Z. Anal Chem. 2011;83(3):820–827. doi: 10.1021/ac102370s. [DOI] [PubMed] [Google Scholar]
- Pichiorri F, Suh SS, Rocci A, De Luca L, Taccioli C, Santhanam R, Zhou W, Benson DM, Jr, Hofmainster C, Alder H. Cancer Cell. 2010;18(4):367–381. doi: 10.1016/j.ccr.2010.09.005. [DOI] [PMC free article] [PubMed] [Google Scholar] [Retracted]
- Singer JM, Plotz CM. Am J Med. 1956;21(6):888–892. [PubMed] [Google Scholar]
- Su L, Shu T, Wang Z, Cheng J, Xue F, Li C, Zhang X. Biosens Bioelectron. 2013;44:16–20. doi: 10.1016/j.bios.2013.01.005. [DOI] [PubMed] [Google Scholar]
- Válóczi A, Hornyik C, Varga N, Burgyán J, Kauppinen S, Havelda Z. Nucleic Acids Res. 2004;32(22):e175–e175. doi: 10.1093/nar/gnh171. [DOI] [PMC free article] [PubMed] [Google Scholar]
- Wang Y, Lee AT, Ma JZ, Wang J, Ren J, Yang Y, Tantoso E, Li KB, Ooi LLJ, Tan P. J Biol Chem. 2008;283(19):13205–13215. doi: 10.1074/jbc.M707629200. [DOI] [PubMed] [Google Scholar]
- Wark AW, Lee HJ, Corn RM. Angew Chem Int Ed. 2008;47(4):644–652. doi: 10.1002/anie.200702450. [DOI] [PMC free article] [PubMed] [Google Scholar]
- Wightman B, Ha I, Ruvkun G. Cell. 1993;75(5):855–862. doi: 10.1016/0092-8674(93)90530-4. [DOI] [PubMed] [Google Scholar]
- Xia X, Xu Y, Zhao X, Li Q. Clin Chem. 2009;55(1):179–182. doi: 10.1373/clinchem.2008.114561. [DOI] [PubMed] [Google Scholar]
- Xu H, Mao X, Zeng Q, Wang S, Kawde AN, Liu G. Anal Chem. 2008;81(2):669–675. doi: 10.1021/ac8020592. [DOI] [PubMed] [Google Scholar]
- Zhang G, Wang X, Yang J, Yang Y, Xing G, Li Q, Zhao D, Chai S, Guo J. J Immunol Methods. 2006;312(1):27–33. doi: 10.1016/j.jim.2006.02.017. [DOI] [PubMed] [Google Scholar]
- Zhang Y, Guo Y, Xianyu Y, Chen W, Zhao Y, Jiang X. Adv Mater. 2013;25(28):3802–3819. doi: 10.1002/adma.201301334. [DOI] [PubMed] [Google Scholar]
- Zhao W, Lee TM, Leung SS, Hsing IM. Langmuir. 2007;23:7143–7147. doi: 10.1021/la7006843. [DOI] [PubMed] [Google Scholar]
Associated Data
This section collects any data citations, data availability statements, or supplementary materials included in this article.