Abstract
Introduction
We investigated the value of lung perfusion imaging in predicting the risk of developing pulmonary complications after chemoradiation (CRT) or RT for lung cancer.
Methods
Fifty patients who underwent lung perfusion imaging prior to RT for lung cancer were included. Planar and SPECT/CT images of the lungs were obtained. Lung perfusion score (LPS) was developed to visually grade localized perfusion defect per lung on a scale of 0-4 and perfusion pattern in the remaining lungs on a scale of 1-4. The LPS is the sum of the score for the localized perfusion defect in each lung plus the score for the remaining lungs perfusion. LPSs were correlated with pulmonary function tests (PFT) and the patients were followed for 8 months after therapy to determine the incidence of grade 2 to 5 symptomatic therapy related pulmonary complications according to the common terminology criteria for adverse events (CTCAE 3.0).
Results
Thirty four patients underwent CRT and 16 underwent RT. The mean total radiation dose delivered was 56.1 ± 10.4 Gy. Eighteen patients (36%) suffered from pulmonary complications at a mean interval of 3.4 months after therapy. Nine patients had grade 2, 7 had grade 3, 1 had grade 4 and 1 had grade 5 pulmonary complications. The mean LPS was 4.9 in patients who developed pulmonary complications versus 3.5 in patients who did not (p=0.01). There were no significant difference between PFTs in the patients with pulmonary complications and the patient without. Additionally, there were no significant differences between the mean lung radiation dose, the volume of lung irradiated or the percentage of lung receiving greater than 20 Gy between the two groups.
Conclusions
LPS using lung perfusion imaging is useful for predicting possible pulmonary complications after CRT or RT in lung cancer patients.
Keywords: Lung Perfusion Imaging, SPECT-CT, Lung Cancer, Pulmonary Complications
INTRODUCTION
Although the main aim of radiation therapy (RT) is to deliver sufficient radiation to the targeted tumor, the inclusion of surrounding tissues and organs is unavoidable. This becomes a challenge when the surrounding tissues or organs are diseased or compromised by a prior surgical resection or prior RT. Lung cancer patients, who frequently suffer from underlying chronic obstructive pulmonary disease (COPD) or prior resections and/or radiation, present a major population where RT faces this challenge. RT must be carefully and conservatively planned for such patients to minimize comorbidities and complications related to surrounding lung injury. The reported incidence of radiation pneumonitis (RP) has varied widely in clinical studies ranging from 0% to 54% (1). This wide range is probably the result of differences in the total radiation doses, number of fractions and fraction dose, and the differences in associated chemotherapy regimens.
Multiple tests and imaging procedures were proposed to guide RT planning or to predict the effect of radiation dose on pulmonary function or degree of tissue damage and fibrosis in patients with lung cancer (2-6). These procedures included computed tomography (CT), pulmonary function tests (PFTs), differential pulmonary function mapping, lung perfusion and/or ventilation imaging, and oxygen enhanced magnetic resonance imaging (7, 8). Single photon emission computed tomography (SPECT) perfusion and/or ventilation imaging of the lungs provides functional information that is not provided by CT (9). Different areas of the lung may have different degrees of perfusion and function as demonstrated using SPECT lung perfusion imaging but appearing of the same lung density on CT. Also an area of inflammation or fibrosis on CT may appear smaller than the actual associated functional perfusion defect on lung perfusion imaging (10, 11). Sparing of the better perfused regions of the lung during RT planning would be ideal if the tumor size and location allow modification of RT beams. Lung perfusion SPECT has been demonstrated to add important functional lung information for RT planning for different tumors in the chest (12-13). Also, multiple investigators have also demonstrated a decrease in pulmonary function after RT using PFTs (14-19). Previous attempts at using lung perfusion scanning to predict post RT pulmonary function in comparison with PFTs have been reported with suboptimal results (20-22). These reports used planar quantitative lung perfusion images to estimate the post-RT pulmonary function as used for prediction of postoperative pulmonary function after lung resection.
To our knowledge, the ability of lung perfusion imaging to predict clinical patient outcome after chemoradiation (CRT) or RT alone to the chest has not been investigated. A method of prospectively identifying patients who cannot tolerate the changes related to radiation pneumonitis and the fibrotic permanent late effect of RT is needed. Therefore, in this study, we investigated the value of lung perfusion SPECT-CT in predicting pulmonary morbidity and complications after CRT or RT alone in patients with lung cancer. We developed a lung perfusion score (LPS) that reflects the degree of loss of perfusion prior to initiation of RT and correlated the results with the patients’ clinical outcomes.
MATERIALS AND METHODS
After obtaining approval of the study from The University of Texas M.D. Anderson Cancer Center Institutional Review Board, 50 consecutive patients with lung cancer who underwent lung perfusion SPECT-CT scanning were obtained from a prospectively collected data base in the nuclear medicine department. The scans were performed within 6 weeks prior to the initiation of RT (mean=12 days) except in one patient it was performed 83 days prior to RT. The SPECT-CT scans were considered baseline scans for future repeat scans to evaluate the extent of lung damage caused by the RT field. RT planning was performed using simulation CT. Data regarding the total RT dose, mean lung dose, total irradiated lung volume and percentage lung volume receiving greater than 20 Gy (V20) were collected from the RT plans.
Lung Perfusion SPECT-CT
The patients were administered 185 MBq of Tc-99m Macroaggregated Albumin (MAA) particles intravenously while lying in the supine position over a flat-bed imaging table. The Tc-99m MAA dose was thoroughly shaken immediately prior to intravenous administration. With the arms above the head, anterior and posterior static images were subsequently obtained for 700K counts. This was followed by a SPECT-CT acquisition using a six slice Symbia T6 (Siemens Medical Solutions) equipped with a low-energy high-resolution collimators. The CT scans were acquired during shallow breathing using 130 kVp, 90 mAs, 6×2mm collimation, and pitch 1.2. The SPECT scans were acquired using a non-circular orbit and step-and-shoot mode over a 360 degrees arc, in 128 frames, 19 sec/frame at 3 degree angles into 128×128 matrices. After attenuation and scatter correction, the SPECT slices were reconstructed using three dimensional ordered-subset expectation maximization iterative reconstruction with resolution, scatter and attenuation correction. Regions of interest were drawn around each lung on planar views to obtain the geometric means of counts and split lung perfusion percentage in each lung and in three zones over each lung (apex, mid, and base).
Lung Perfusion Score
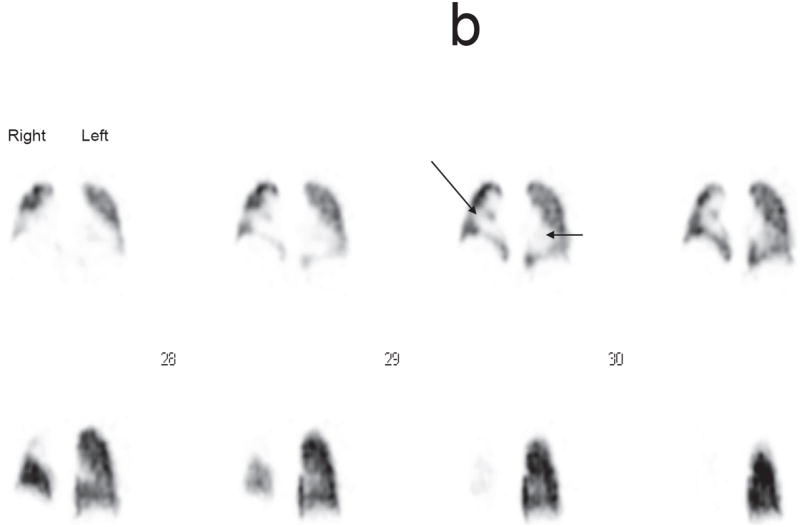
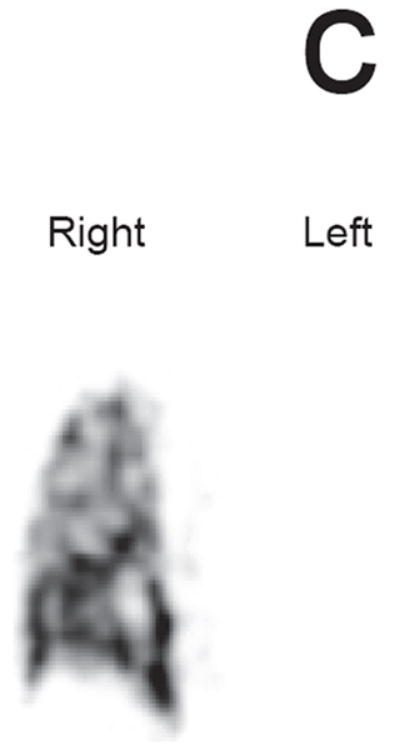
We developed a LPS that visually grades the largest localized perfusion defect in either lung as seen on the SPECT slices on a scale of 0 to 4 and in the remaining lung fields as seen on the static and SPECT-CT images on a scale of 1 to 4 (Fig 1 and 2). The largest localized perfusion defect score in each lung were added to the remaining lung perfusion pattern score to provide the total LPS. Thus, the total LPS ranged from 1 to 12 (Table 1). This developed LPS provided semiquantitative functional lung results that took into account both localized perfusion defects and diffuse underlying parenchymal lung disease. This LPS was developed to account for balanced diffuse lung disease that is not demonstrated by the available conventional lung perfusion quantitation software.
FIGURE 1.
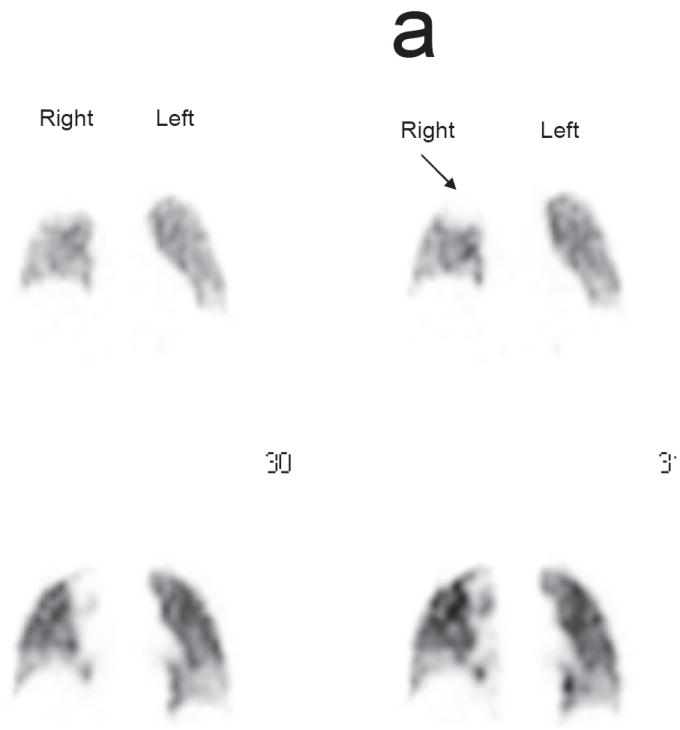
a. Localized perfusion defect in the right upper lung (arrow) equivalent to a score of 1 on the LPS
b. Localized perfusion defect in the left lung equivalent to a score of 2 (short arrow) and in the right lung (long arrow) equivalent to a score of 3 on the LPS
c. Absent left lung after pneumonectomy equivalent to a score of 4 on the LPS
FIGURE 2.
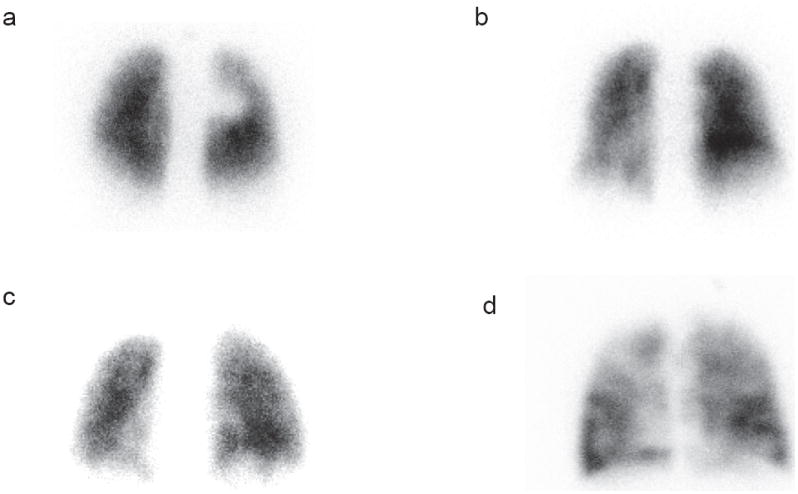
Different patterns of the remaining lung perfusion (A-D) that corresponds to the different points on the LPS (1-4). A is homogeneous=score of 1, B is mild heterogeneity= score of 2, C is moderate heterogeneity=score of 3, D is marked heterogeneity= score of 4.
Table 1.
Lung Perfusion Score System as a Mean of Evaluating Lung Function
| Largest Localized Perfusion Defect Score (DS) in Each Lung |
| 0= No defect |
| 1= Defect < 25% of one lung |
| 2= Defect 25-49% of one lung |
| 3= Defect 50-74% of one lung |
| 4= Defect 75-100% of one lung |
| Remaining Luns Perfusion Score (RLPS) |
| 1= Homogeneous |
| 2= Mild heterogeneity |
| 3= Moderate heterogeneity |
| 4= Marked heterogeneity
|
| Total Lung Perfusion Score (LPS) = Right Lung DS + Left Lung DS + RLPS = 1-12 |
Image interpretation
The reproducibility of the LPS was tested through using repeat reading of the 50 lung perfusion scans by multiple readers. Five readers at different levels of expertise were introduced to the LPS and shown how to apply it and use it in the image interpretations. The readers were blinded to the patients’ clinical information except for the tumor site. The readers mostly used the SPECT images to score the largest localized perfusion defect in either lung. A combination of the SPECT-CT and the planar images was used to score the perfusion pattern in the remaining lung fields. The SPECT/CT images for two patients were not available for review and only the planar images were used for determining the LPS.
Clinical Outcomes
The patients’ medical records were reviewed to extract information about pulmonary complaints or morbidities after CRT or RT. These included increasing shortness of breath, symptomatic radiation pneumonitis, increasing oxygen dependence in patients with COPD and respiratory failure. The patients’ pulmonary complications were categorized as grade 2 to 5 according to the Common Terminology Criteria for Adverse Events, CTCAE 3.0 (23). Patients who had other causes that might have contributed to their pulmonary complaints including evidence of tumor progression were not considered as CRT or RT related pulmonary complication. The LPSs for patients with posttherapy pulmonary complications were compared with LPSs for patients who did not experience any symptomatic pulmonary complications or who developed pulmonary complications related to other etiologies, such as. cardiac etiology. Additionally, LPSs were correlated with pulmonary function tests (PFT) results performed at a median of 13 days of the lung perfusion scan and 23 days of the start of RT. PFT results were compared in the group of patients who developed radiation related pulmonary complications versus the group who did not develop such complications. LPSs were also specifically correlated with forced vital capacity (FVC), forced expiratory volume at one second (FEV1), vital capacity (VC), and lung diffusion capacity of carbon monoxide (DLCO) results.
Statistical Analysis
Descriptive statistics for the different components of the LPSs for the different readers were calculated. Interobserver agreement was assessed using Shrout and Fleiss’s intraclass correlation coefficient (ICC) (24). The ICC is defined as the proportion of subject plus reader variance that is associated with differences among the scores of the subjects. We used the data from the five readers to calculate a mean lung score for each patient and then compared the mean lung score for those with and without complications using a t-test with p values less than 0.05 considered statistically significant. Univariate logistic regression models were fit to assess the association between complications and covariates of interest, including lung score, age, sex, history of COPD, tumor stage, RT technique, total RT dose, mean lung dose, and V20. Odds ratios and corresponding 95% confidence intervals were estimated from these models. A multivariate analysis was also performed to assess the association between complications and lung score after taking into account the other covariates. By using these models we also constructed receiver operating characteristic (ROC) curves to assess the ability of the LPS to discriminate between those with and without complications. Each point on the ROC curve provides the sensitivity and specificity measures associated with a LPS cutpoint in the probability scale. Fisher’s exact test was used to test for significant difference in mean lung volumes included in the RT field in the group of patients who had radiation related pulmonary complication versus the group who did not experience such complications. Additionally regression analysis was performed to determine the degree of correlation between the LPSs and PFT results.
RESULTS
The characteristics of the patients who developed pulmonary complications after RT, the patients who did not experience such complications and the total study population are summarized in table 2. Two patients were already oxygen-dependent from COPD prior to RT, one had a history of asthma and sleep apnea and one had a history of idiopathic pulmonary fibrosis. Thirty-two patients received concurrent CRT, 1 patient received chemotherapy 2.5 months prior to RT, another patient received chemotherapy 4.5 months prior to RT and 16 patients received RT alone. Streotactic RT was delivered in 4 fractions and 2D conformal and IMRT RT was delivered in 12-35 fractions. The mean lung volume irradiated in the group of patients who did not experience pulmonary complications after RT was 1453.5 ± 839.4 cm3 versus in those who developed such complications was 1544.7 ± 822.5 cm3 (p=0.4). The median V20 and median for mean lung doses were 29.5% and 14.8 Gy in the group of patients who had pulmonary complications and 29.5% and 18.2 Gy in the group of patients who did not have complications. Additionally, there was no statistically significant difference in mean lung dose and mean V20 in the two groups with p = 0.70 and 0.76, respectively.
Table 2.
Characteristics of patients in the group who developed radiation related pulmonary complications versus the group of patients who did not develop such complications
| No RT Pulmonary Complications (n=32) | RT Pulmonary Complications (n=18) | Total Study Population (n=50) | |
|---|---|---|---|
| Mean age (yr) | 67.2 | 68.4 | 67.6 |
| Sex (M:F) | 16:16 | 10:8 | 26:24 |
| Tumor stage | |||
| I | 8 (25%) | 6 (33.3%) | 14 |
| II | 1 (3.1%) | 0 (0.0%) | 1 |
| III | 11 (34.4%) | 9 (50.0%) | 20 |
| IV | 5 (15.6%) | 0 (0.0%) | 5 |
| Recurrence | 7 (21.9%) | 3 (16.7%) | 10 |
| RT Technique | |||
| Streotactic | 11 (34.4%) | 6 (33.3%) | 17 |
| IMRT* | 17 (53.1%) | 9 (50.0%) | 26 |
| 3D-Conformal | 3 (9.4%) | 2 (11.1%) | 5 |
| Proton Therapy | 1 (3.1%) | 1 (5.6%) | 2 |
| Mean Total RT dose (Gy) | 56.8±9.9 | 55.1±11.4 | 56.1±10.4 |
| Mean Lung Dose (Gy) | 15.0±8.1 | 15.9±7.5 | 15.5±7.6 |
| V20 (%) ** | 26.5±13.3 | 27.7±13.5 | 26.9±13.4 |
| Prior RT | 3 (9.4%) | 5 (27.8%) | 8 |
| Prior Surgical Resection | 3 (9.4%) | 2 (11.1%) | 5 |
| Prior COPD | 9 (28%) | 6 (33%) | 15 |
| Chemotherapy | 25 (78.1%) | 9 (50%) | 34 |
IMRT=Intensity Modulated Radiation Therapy,
V20= Percent lung volume irradiated with >20Gy.
The mean LPS ranged from 3.5 to 4.7 for the five readers. One of the readers consistently had the lowest scores whereas another consistently had the highest scores (Table 3). The interobserver agreement rate for the LPS was 0.7 for the five readers. This indicated a good agreement among the readers and the reproducibility of the LPS by different readers.
Table 3.
Different Readers Scoring of Lung Perfusion Scans According to the LPS Criteria
| Reader 1 Mean (sd*) (range) | Reader 2 Mean (sd) (range) | Reader 3 Mean (sd) (range) | Reader 4 Mean (sd) (range) | Reader 5 Mean (sd) (range) | |
|---|---|---|---|---|---|
| Total LPS* | 4.1 (2.0) (1-9) | 4.7 (1.5) (1-8) | 3.5 (1.7) (1-9) | 4.6 (1.8) (2-9) | 4.0 (2.2) (1-9) |
| Left Lung DS* | 0.8 (0.9) (0-3) | 0.9 (0.8) (0-3) | 0.5 (0.8) (0-3) | 0.9 (0.8) (0-3) | 0.8 (0.8) (0-3) |
| Right Lung DS | 1.3 (1.1) (0-3) | 1.0 (0.6) (0-3) | 0.9 (0.9) (0-3) | 1.2 (1.0) (0-3) | 1.0 (0.9) (0-4) |
| RLPS* | 2.3 (1.6) (1-6) | 3.2 (1.6) (1-6) | 2.2 (1.3) (1-6) | 2.9 (1.7) (1-6) | 2.6 (1.8) (1-6) |
LPS, Lung Perfusion Score; DS, Defect Score; RLPS, Remaining Lung Perfusion Score; sd, Standard Deviation.
Eighteen patients (36%) had developed pulmonary complication at a mean interval of 3.4 months after RT in the absence of radiologic or clinical evidence of tumor recurrence or progression. Nine of these patients were grade 2, seven were grade 3, one was grade 4 and 1 was grade 5 pulmonary complication according to the CTCAE 3.0 criteria (Fig. 3). The mean LPS in the patients who developed pulmonary complications was significantly higher than that for the 34 patients who did not develop pulmonary complications (4.9 versus 3.5, p=0.01). As the patients’ lung score increased, so did the odds of the patient having complications (unadjusted OR=1.60, 95% CI: 1.07-2.39). Multivariate analysis; after adjustment for age, sex, history of COPD, stage of tumor, RT technique, total RT dose, mean lung dose, and V20; demonstrated significant association between LPS and radiation related pulmonary complications (OR=3.25, 95% CI: 1.37-7.70). An ROC curve to assess the ability of the LPS to discriminate between those with and without pulmonary complications is shown in figure 4. The calculated area under the curve is 0.7 which is suggestive of good predictive value of the LPS in identifying patients who may have pulmonary complications after CRT or RT. A LPS cutpoint of ≥ 4 provided 78% sensitivity and 59% specificity in identifying patient with potential for developing pulmonary complications after RT.
FIGURE 3.
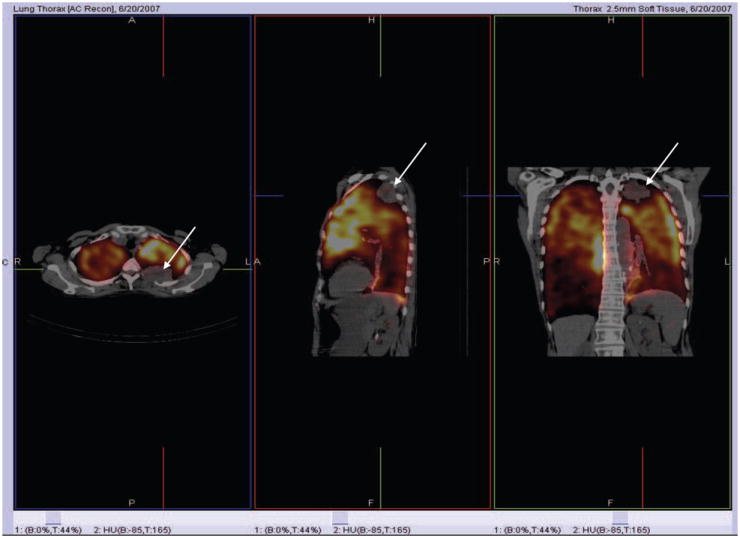
Lung Perfusion SPECT/CT in a Patient with a Small LUL Cancer but Poor Perfusion in the Remaining Lung who Developed Respiratory Failure after RT.
FIGURE 4.
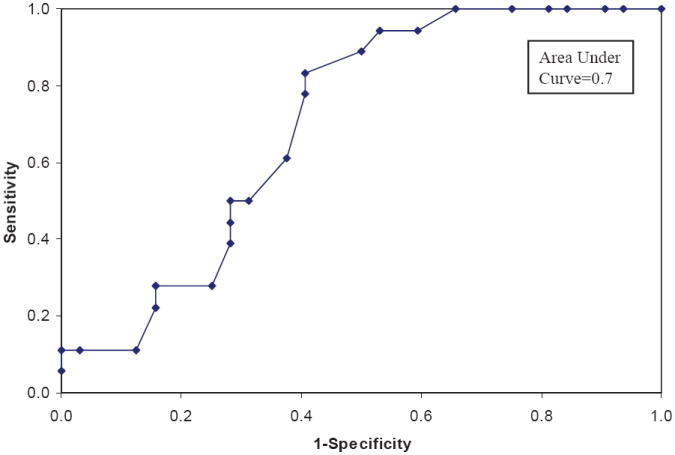
Receiver Operating Characteristic (ROC) Curves to Assess the Ability of the Lung Perfusion Score to Discriminate Between Patients with and without Pulmonary Complications.
Complete PFT results were available for 41 patients whereas only FEV1 and DLCO results were available for 3 additional patients. When PFT results were compared between the group of patients who developed pulmonary complication and the group who did not develop pulmonary complication related to RT, there was no significant difference in means for FVC, FEV1, VC, DLCO, and TLC. Thus, PFTs could not identify patients who are at higher risk of developing pulmonary complications (Table 4). The best correlation between the LPS and PFTs was obtained with the FEV1 with r = -0.70 followed by the DLCO with r = -0.61. The LPS correlation with VC and FVC were fair at -0.59 and -0.52, respectively.
Table 4.
Comparison between PFTs results in the patients who developed RT related complications versus the patients who did not have RT pulmonary complications
| No RT Pulmonary Complications Group | RT Pulmonary Complications Group | P Value | |
|---|---|---|---|
| FVC | 85.4 | 76.8 | 0.25 |
| FEV1 | 75.1 | 61.4 | 0.08 |
| VC | 90.0 | 76.0 | 0.08 |
| DLCO | 67.2 | 58.1 | 0.19 |
| TLC | 109.5 | 113.6 | 0.48 |
DISCUSSION
In this study we developed a semiquantitative LPS and tested its predictive value in risk stratifying patients with lung cancer who may experience clinically symptomatic pulmonary complications after CRT or RT. A LPS >4 is associated with higher likelihood of developing pulmonary complications after RT. This should alert a radiation oncologist to perform a conservative radiation therapy planning to spare as much functional lung tissue as possible or alternatively to use a more targeted RT technique. The group of patient who developed pulmonary complications after therapy and the group who did not develop such complication were comparable in their RT metrics (mean lung dose, V20, irradiated lung volume) since the lung perfusion scan was obtained only as a baseline study for repeat imaging after RT to evaluate extent of RT damage. This study population represented our initial group of patient where lung perfusion imaging was performed and it did not alter the RT planning which was performed using the standard simulation CT. Thus we were able to demonstrate that the degree of decreased functional lung reserve as reflected in the LPS is an important predictor of future pulmonary complication after CRT or RT.
LPS was superior to previous attempts at using lung scintigraphy to predict posttherapy pulmonary function in patients with lung cancer in that it accounted for both localized perfusion defects and the remaining global lung perfusion. Our study addresses a missing link between the regional and global lung function after RT that was previously raised by Fan et al (25). Previous studies focused mostly on visualization of localized perfusion defects using lung scintigraphy for optimization of RT planning (9, 26). Additionally, most studies focused on quantification of the localized perfusion defect size as a percentage of the total lung in conjunction with PFTs in predicting the pulmonary function after RT (20-22). Both Rubenstein and Curran et al (21, 22) have used a RT planned field overlapping a planar lung perfusion scan to estimate the percent lung perfusion defect caused by RT and multiplications of the remaining percentage of lung perfusion by the pre-RT FEV1 to predict the expected patient’s FEV1 after RT. This is similar to the method used for pre-surgical estimation of residual pulmonary function after lung resection. In Rubenstein et al study 20/22 patients had measured FEV1s after RT that were higher than the predicted values using the planar lung perfusion scan. On the other hand, Curran et al demonstrated no change in FEV1 in 53% of their patients post RT, an improved FEV1 in 19%, a decline in the FEV1 toward the predicted in 22% and a decline below the predicted value in 5% at a mean interval of 11 months post RT. The suboptimal results with regards to prediction of post-RT pulmonary function in these two studies is probably related to the use of planar lung images to try to quantify the volumetric effect of RT on the lung and the use of PFTs to estimate the status of the remaining lung function. PFTs have their own limitations to be a useful method of predicting lung function after CRT. The reproducibility of PFTs is generally considered to be ~5-10% (27) and it is probably worse in patients with prior pulmonary compromise. On the other hand, evaluation of global lung perfusion and function in such patient population becomes crucial to predict the ability of the lungs to withstand an additional CRT injury. Thirty-four percent of our patient population had a history of COPD or diffuse lung disease and 26% had a history of prior RT or surgical resection. Our results also demonstrated the inability of PFT in risk stratify patients for developing RT related pulmonary complications. There was reasonable correlation of the LPS with FEV1 but only fair correlation with DLCO, FVC and VC. Multiple studies have proven PFTs to be a weak predictor of post RT pulmonary function and did not seem to correlate well with patients’ clinical outcome (13, 21, 28). This is probably due to the complex and changing interactive effects of the tumor, RT, chemotherapy, surgical resection and/or underlying lung disease on PFTs performed for patients with lung cancer.
Our observation is that the size of a localized lung perfusion defect was better visualized and estimated on the SPECT-CT images than on planar images due to the 3 dimensional nature of the SPECT display. The CT portion added the value of attenuation correction of the SPECT slices. CT images also provided useful adjunctive information to the readers in scoring the degree of heterogeneity in the remaining lung in the presence of emphysematous changes on CT. Although not tested in our study, we anticipate that LPSs obtained from lung perfusion SPECT alone would have similar results in predicting pulmonary complications post RT to the chest. A rim of apparent increased tracer concentration at the periphery of the lungs, particularly at the bases was noted in some cases and was attributed to attenuation/respiratory motion artifacts. However, this did not interfere with the LPS and the interpretation of the images by any of the readers.
We developed the LPS to meet an important clinical need for an absolute quantitative or semiquantitative measurement that truly reflects the status of lung perfusion. The present available software programs provide relative percentages of lung perfusion that would mask a diffuse pulmonary lung disease. For example a patient may have a balanced severe diffuse COPD in both lungs but still demonstrates equal perfusion percentages in both lungs whereas the LPS may be high due to the severe heterogeneity of lung perfusion reflective of the diffuse nature of the compromised lung perfusion. Thus, the ability to quantify the degree of heterogeneity in a lung perfusion or ventilation scan would provide useful information. Additionally, since the lungs are relatively large organ, quantitative software programs that would provide a more accurate sizing of a localized perfusion defect from the SPECT volume information would be superior to planar images (29). Actually, the readers consistently noted that a localized perfusion defect is larger in 3 D display mode as seen on SPECT slices than what is perceived on planar images.
One limitation of the LPS was the difference in the degree of heterogeneity seen on planar versus SPECT images in the lungs. The readers used a combination of planar images and SPECT-CT to make the best judgment on the score of heterogeneity of perfusion in the lungs. Despite this limitation, the performance of the LPS in identifying patients vulnerable for future pulmonary complications was good.
Until more precise quantitative software programs for quantification and evaluation of lung perfusion and ventilation are developed, we propose the use of the clinically useful LPS developed and tested in this study. Our LPS is reflective of the pulmonary function reserve and can be used for risk stratification of patients that are at higher risk of developing pulmonary complications after CRT or RT to the chest. This may guide patient management in the use of more conservative RT field or a more targeted RT technique. It will also alert clinicians toward closer monitoring of these patients after RT. Future studies to evaluate the impact of the LPS on changes in RT planning and consequently on consequent decreases in the incidence of pulmonary complications are needed.
In conclusion lung perfusion imaging is useful for predicting possible pulmonary complications after CRT or RT in lung cancer patients. Patients with pretherapy LPS of > 4 are more likely to develop pulmonary complications after RT or CRT.
References
- 1.Roach M, III, Gandara DR, Yuo HS, et al. Radiation pneumonitis following combined modality therapy for lung cancer: analysis of prognostic factors. J Clin Oncol. 1995;10:2606–12. doi: 10.1200/JCO.1995.13.10.2606. [DOI] [PubMed] [Google Scholar]
- 2.Marks LB, Spencer DP, Sherouse GW, et al. The role of three dimensional functional lung imaging in radiation treatment planning: the functional dose-volume histogram. Int J Radiat Oncol Biol Phys. 1995;33(1):65–75. doi: 10.1016/0360-3016(95)00091-C. [DOI] [PubMed] [Google Scholar]
- 3.Boersma LJ, Damen EM, de Boer RW, et al. A new method to determine dose-effect relations for local lung-function changes using correlated SPECT and CT data. Radiother Oncol. 1993;29(2):110–6. doi: 10.1016/0167-8140(93)90235-z. [DOI] [PubMed] [Google Scholar]
- 4.Fu X-L, Huang H, Bentel G, Clough R, et al. Predicting the risk of symptomatic radiation-induced lung injury using both the physical and biologic parameters V (30) and transforming growth factor beta. Int J Radiat Oncol Biol Phys. 2001;5(4):899–908. doi: 10.1016/s0360-3016(01)01524-3. [DOI] [PubMed] [Google Scholar]
- 5.Marks LB, Munley M, Spencer D, et al. Quantification of radiation-induced regional lung injury with perfusion imaging. Int J Radiat Oncol Biol Phys. 1997;38(2):399–409. doi: 10.1016/s0360-3016(97)00013-8. [DOI] [PubMed] [Google Scholar]
- 6.Boersma LJ, Damen EM, de Boer RW, et al. Dose-effect relations for local functional and structural changes of the lung after irradiation for malignant lymphoma. Radiother Oncol. 1994;32(3):201–9. doi: 10.1016/0167-8140(94)90019-1. [DOI] [PubMed] [Google Scholar]
- 7.Mehta V. Radiation pneumonitis and pulmonary fibrosis in non-small-cell lung cancer: pulmonary function, prediction, and prevention. Int J Radiat Oncol Biol Phys. 2005;63(1):5–24. doi: 10.1016/j.ijrobp.2005.03.047. [DOI] [PubMed] [Google Scholar]
- 8.Muller CJ, Schwaiblmair M, Scheider J, et al. Pulmonary diffusing capacity: assessment with oxygen-enhanced lung MR imaging preliminary findings. Radiology. 2002;222(2):499–506. doi: 10.1148/radiol.2222000869. [DOI] [PubMed] [Google Scholar]
- 9.Levinson B, Marks LB, Munley MT, et al. Regional dose response to pulmonary irradiation using a manual method. Radiother Oncol. 1998;48(1):53–60. doi: 10.1016/s0167-8140(98)00057-7. [DOI] [PubMed] [Google Scholar]
- 10.Bell J, McGivern D, Bullimore J, et al. Diagnostic imaging of post-irradiation changes in the chest. Clin Radiol. 1988;39(2):109–19. doi: 10.1016/s0009-9260(88)80003-5. [DOI] [PubMed] [Google Scholar]
- 11.Prato FS, Kurdyak R, Saibil EA, et al. Regional and total lung function in patients following pulmonary irradiation. Invest Radiol. 1977;12(3):224–37. doi: 10.1097/00004424-197705000-00004. [DOI] [PubMed] [Google Scholar]
- 12.Marks LB, Spencer DP, Bentel GC, et al. The utility of SPECT lung perfusion scans in minimizing and assessing the physiologic consequences of thoracic irradiation. Int J Radiat Oncol Biol Phys. 1993;26(4):659–68. doi: 10.1016/0360-3016(93)90285-4. [DOI] [PubMed] [Google Scholar]
- 13.DeJaeger K, Seppenwoolde Y, Boersma LJ, et al. Pulmonary function following high-dose radiotherapy of non-small-cell lung cancer. Int J Radiat Oncol Biol Phys. 2003;55(5):1331–40. doi: 10.1016/s0360-3016(02)04389-4. [DOI] [PubMed] [Google Scholar]
- 14.Sunyach MP, Falchero L, Pommier P, et al. Prospective evaluation of early lung toxicity following three-dimensional conformal radiation therapy in non-small-cell lung cancer: Preliminary results. Int J Radiat Oncol Biol Phys. 2000;48:459–463. doi: 10.1016/s0360-3016(00)00618-0. [DOI] [PubMed] [Google Scholar]
- 15.Van den Brande P, De Ruysscher D, Vansteenkiste J, et al. Sequential treatment with vindesine-ifosfamide-platinum (VIP) chemotherapy followed by platinum sensitized radiotherapy in stage IIIB non-small cell lung cancer: A phase II trial. Lung Canc. 1998;22:45–53. doi: 10.1016/s0169-5002(98)00071-3. [DOI] [PubMed] [Google Scholar]
- 16.Mattson K, Holsti LR, Poppius H, et al. Radiation pneumonitis and fibrosis following split-course radiation therapy for lung cancer: A radiologic and physiologic study. Acta Oncol. 1987;26:193–196. doi: 10.3109/02841868709091430. [DOI] [PubMed] [Google Scholar]
- 17.Choi N, Kanarek D, Grillo H. Effect of post-operative radiotherapy on changes in pulmonary function in patients with stage II and IIIa lung carcinoma. Int J Radiat Oncol Biol Phys. 1990;18:95–99. doi: 10.1016/0360-3016(90)90272-l. [DOI] [PubMed] [Google Scholar]
- 18.Robert F, Childs HA, Spencer SA, et al. Phase I/IIa study of concurrent paclitaxel and cisplatin with radiation therapy in locally advanced non-small cell lung cancer: Analysis of early and late pulmonary morbidity. Semin Radiat Oncol. 1999;9:136–147. [PubMed] [Google Scholar]
- 19.Bonnet RB, Bush D, Cheek G, et al. Effects of proton and combined proton/ photon beam radiation on pulmonary function on patients with resectable but medically inoperable non-small cell lung cancer. Chest. 2001;120:1803–1810. doi: 10.1378/chest.120.6.1803. [DOI] [PubMed] [Google Scholar]
- 20.Choi N, Kanarek D, Kazem H. Physiologic changes in pulmonary function after thoracic radiotherapy for patients with lung cancer and role of regional pulmonary function studies in predicting post-radiotherapy pulmonary function before radiotherapy. Cancer Treat Sym. 1985;2:119–130. [Google Scholar]
- 21.Rubenstein JH, Richter MP, Moldofsky PJ, et al. Prospective prediction of post-radiation therapy lung function using quantitative lung scans and pulmonary function testing. Int J Radiat Oncol Biol Phys. 1988;15:83–87. doi: 10.1016/0360-3016(88)90350-1. [DOI] [PubMed] [Google Scholar]
- 22.Curran WJ, Jr, Moldofsky PJ, Solin LJ. Observations on the predictive value of perfusion lung scans on post-irradiation pulmonary function among 210 patients with bronchogenic carcinoma. Int J Radiat Oncol Biol Phys. 1992;24(1):31–6. doi: 10.1016/0360-3016(92)91017-h. [DOI] [PubMed] [Google Scholar]
- 23.National Cancer Institute. Common Terminology Criteria for Adverse Events v3.0 (CTCAE) 2006:56–59. [Google Scholar]
- 24.Shrout PE, Fleiss JL. Intraclass correlations: uses in assessing rater reliability. Psychological Bulletin. 1979;86:420–428. doi: 10.1037//0033-2909.86.2.420. [DOI] [PubMed] [Google Scholar]
- 25.Fan M, Marks LB, Hollis D, et al. Can we predict radiation-induced changes in pulmonary function based on the sum of predicted regional dysfunction. J Clin Oncol. 2001;19(2):543–50. doi: 10.1200/JCO.2001.19.2.543. [DOI] [PubMed] [Google Scholar]
- 26.Marks LB, Spencer DP, Sherouse GW, et al. The role of three dimensional functional lung imaging in radiation treatment planning: the functional dose-volume histogram. Int J Radiat Oncol Biol Phys. 1995;33(1):65–75. doi: 10.1016/0360-3016(95)00091-C. [DOI] [PubMed] [Google Scholar]
- 27.Quanjer P, Anderson L, Tammeling G. Clinical respiratory physiology. Bull Eur Physiopathol Respir. 1983;19:11–21. [Google Scholar]
- 28.Marks LB, Munley MT, Bentel G, et al. Physical and biological predictors of changes in whole-lung function following thoracic irradiation. Int J Radiat Oncol Biol Phys. 1997;39(3):563–70. doi: 10.1016/s0360-3016(97)00343-x. [DOI] [PubMed] [Google Scholar]
- 29.Damen EM, Muller SH, Boersma LJ, et al. Quantifying local lung perfusion and ventilation using correlated SPECT and CT data. J Nucl Med. 1994;35(5):784–92. [PubMed] [Google Scholar]


