

Abstract
We describe a hairpin oligonucleotide (HO) with double-target DNA binding sequences in the loop and 11-base in the stem for visual detection of single-base mismatches (SBM) in DNA with highly specificity. The thiol-modified HO was immobilized on gold nanoparticle (Au-NP) surface through a self-assembling process. The strategy of detecting SBM depends on the unique molecular recognition properties of HO to the perfect-matched DNA and SBM to generate different quantities of duplex DNA on the Au-NP surface, which are captured on the test zone of lateral flow test strip via the DNA hybridization reaction between the duplex DNA and preimmobilized DNA probe. Accumulation of Au-NPs produces the characteristic red bands, enabling visual detection of SBM. It was found that the ability of HO to differentiate perfect-matched DNA and SBM was increased dramatically by incorporating double-target DNA binding sequences in the loop of HO. The signal ratio between perfect-matched DNA and SBM was up to 28, which is much higher than that of conventional HO or molecular beacon. The approach was applied to detect the mutation sites, Arg142Cys and Gly529Ile, of transglutaminase 1 gene in autosomal recessive congenital ichthyosis. The results presented here show that the new HO is a potential molecular recognition probe for the future development of nucleic acid-based biosensors and bioassays. The approach can be used for point-of-care diagnosis of genetic diseases and detecting infectious agents or warning against bio-warfare agents.
1. Introduction
The detection of single-base mismatches (SBM) in DNA is of central importance to the diagnosis and treatment of genetic diseases, to the detection of infection agents and drug discovery (Drummond et al., 2003; Merkoci, 2010). Extensive research efforts have been made to develop DNA biosensors (electrical (Karadeniz et al., 2011; Rivas et al., 2006), optical (Peng et al., 2011) and mechanical (Arlett et al., 2011)), DNA microarray (Erdogan et al., 2001), polymerase chain reactions (PCR) (Kaltenboeck et al., 2005) and nucleic acid protocols (Toubanaki et al., 2009; Hoogendoorn et al., 1999), for the detection of SBMs in DNA. One of the most important components in the above methods is the recognition probes, which can differentiate the SBM and wild-type DNA in DNA pools. Various nucleic acid probes including molecular beacons (MB) (Barreiro et al., 2009), peptide nucleic acids (PNA) (Gaylord et al., 2005) and locked nucleic acids (LNA) (Johnson et al., 2004) have been developed for the SBM detection. In particular, MB has attracted considerable interests because of the inherent signaling mechanism by energy transfer and the high selectivity (Goel et al., 2005). The unique stem-loop structure, fluorophore-quencher pair, and the capability to discriminate single-base mutation enable the simple, rapid, and sensitive detection of SBMs (Wang et al., 2008). The sensitivities of MBs have been improved by the modifications of MB with nanoparticles (quantum dots (Kim et al., 2004; Liu et al., 2011) and gold nanoparticles (Dubertret et al., 2001)), conjugated polymers (Chen et al., 1999) or the combinations of MB with catalytic DNAs (DNA enzymes) (Stojanovic et al., 2001). Current limitations of MB technology include the high cost of MB synthesis and a high fluorescence background, which results a low differentiating ability between the SBM and wild-type DNA (Goel et al., 2005; Kim et al., 2008). The efforts, therefore, in this respect are directed toward simplification and/or generalization of the beacon design and new detection methods.
DNA-functionalized Au-NPs have been used to construct nanoparticle structures (Taton et al., 2000) and develop colorimetric approaches for sensitive DNA detection (Fritzsche and Taton, 2003). Recently we reported a simple and fast approach for visual detection of DNA and single-nucleotide polymorphism (SNP) using hairpin oligonucleotide-functionalized gold nanoparticle (HO-Au-NP) probes and lateral flow strips (LFS) (Mao et al., 2009; He et al., 2010). The HO modified with a thiol at the 5′-end and a biotin at the 3′-end was conjugated with Au-NP through a self-assembling process. DNA hybridization reactions between the HO and target DNA induced the conformational changes of HO, and activated the attached biotin on the Au-NP surface. The activated biotin was captured by streptavidin on the LFS test zone. The accumulations of Au-NPs on the test zone enable the visual detection of DNA (He et al., 2010). However, the approach suffered from low differentiation ability because of the background signal and double modifications of HO.
In this article, we designed a HO with double-target DNA binding sequences in the loop and 11-base in the stem for visual detection of SBM in DNAs. The ability of the new HO to differentiate SBM and wild-type DNA was increased dramatically by incorporating double-target DNA binding sequences in the HO loop and increase the length of HO stem. The signal ratio between SBM and wild-type DNA was up to 28, which is much higher than that of conventional HO or MB. The new HO probe was applied to detect the mutation sites, Arg142Cys (R142C) and Gly529Ile (G529I), of transglutaminase 1 (TGM1) gene in autosomal recessive congenital ichthyosis (ARCI). The attractive characteristics of the new HO are reported in the following sections.
2. Materials and Methods
2.1 Materials
The Airjet AJQ 3000 dispenser, Biojet BJQ 3000 dispenser, Clamshell Laminator, and Guillotine cutting module CM 4000 were from Biodot, LTD (Irvine, CA). A portable strip reader (DT1030) was purchased from Shanghai Goldbio Tech. Co., LTD (Shanghai, China). The Deoxyadenosine triphosphate (dATP), dithiothreitol (DTT), DMSO, sucrose, hydroxylamine, Tween 20, Triton X-100, trisodium citrate, bovine serum albumin (BSA), sodium chloride-sodium citrate (SSC) Buffer 20×concentrate (pH 7.0), and phosphate buffer saline (PBS, pH 7.4, 0.01 M) were purchased from Sigma-Aldrich (St. Louis). HAuCl4, glass fibers (GFCP000800), cellulose fiber sample pads (CFSP001700), laminated cards (HF000MC100), and nitrocellulose membranes (HFB18004) were purchased from Millipore (Billerica, MA). The DNA oligonucleotide probes, hairpin oligonucleotides, SBM, wild-type DNA were obtained from Integrated DNA Technologies, Inc. (Coralville, IA). The oligonucleotide sequences are shown in Table 1.
Table 1.
Oligonucleotide sequences.
| Oligonucleotide Name | Sequence |
|---|---|
| Traditional HO-R142C | 5′- Thio/MC6-D/ CGT ATC CA TG CCC GCAGCG CAC TATCAG TG GAT ACG-3 |
| New HO-R142C | 5′-Thio/MC6-D/CGT ATC ACG CGA TG CCC GCAGCG CAC TAT CAG TG CCC GCAGCG CAC TAT CAG TCG CGT GAT ACG-3′ |
| R142C mutant | 5′-CTG ATA GTG CGCTGC GGG CA- 3′ |
| R142C wild-type DNA | 5′-CTG ATA GTG CGCCGC GGG CA -3′ |
| Noncomplementary DNA | 5′ – TGC AAG CTG TCA GTA TAA TC-3′ |
| DNA probe 1-R142C on the test zone of LFS | 5′-Biotin/MC6-D/ CGT ATC ACG CGA-3′ |
| DNA probe 2-R142C on the control zone of LFS | 5′-Biotin/MC6-D/ CGT ATC ACG CGA CTG ATA GTG TGC GGG CA-3′ |
| G529I mutant | 5′-CTC ATT GTC ATA AAG GCC ATC-3′ |
| G529I wild-type DNA | 5′- CTC ATT GTC ACA AAG GCC ATC -3′ |
| HO-G529I | 5′-Thio/MC6-D/CGT CTA GAC GCG GAT GGC CTT TAT GAC AAT GAG GAT GGC CTT TAT GAC AAT GAG CGC GTC TAG ACG-3′ |
| DNA probe 3-G529I on the test zone of LFS | 5′-Biotin/MC6-D/CGT CTA GAC GCG-3′ |
All chemicals used were analytical reagent grade. Other solutions were prepared with ultrapure (>18 MΩ) water from a Millipore Milli-Q water purification system (Billerica, MA).
2.2 Preparation of Au-NPs
Au-NPs with average diameter 15 nm ± 3.5 nm were prepared according to the reported methods with slight modifications (He et al., 2011). All glassware used in this preparation was thoroughly cleaned in aqua regia (three parts HCl and one part HNO3), rinsed in doubly distilled water, and oven dried prior to use. In a 500-mL, round-bottom flask, 100 mL of 0.01% HAuCl4 in doubly distilled water were brought to a boil with vigorous stirring followed by the addition of 4.5 mL of 1% trisodium citrate. The solution turned deep blue within 20 s, and the final color changed to wine-red 60 s later. Boiling was pursued for an additional 10 min; the heating source was removed; and the colloid solution was stirred for another 15 min. The resulting Au-NP solution was stored in dark bottles at 4°C. The resulting solution of Au-NPs was characterized by an absorption maximum at 520 nm.
2.3 Preparation of Au-NP-HO conjugates
A HO modified with a thiol at its 5′ end was used to prepare Au-NP-HO conjugates. Briefly, a thiolated HO probe (1.5 OD) was added to 1 mL of the tenfold-concentrated Au-NP solution. After shaking 30 min at room temperature (RT), 60 μL of 14.1 μM dATP were added to the solution and shook 15 min at RT. The Au-NP-HO conjugates were incubated for half an hour at RT and then put at 4 °C for 6 hours to continue increasing the stability of the conjugate. The excess reagents were removed by centrifugation for 13 min at 12,000 rpm. After discarding the supernatant, the red pellets were washed twice with 0.01 M PBSB (pH 8.4, 1% BSA); recentrifuged; redispersed in 1 mL of an aqueous solution containing 20 mM Na3PO4 · 12H2O, 5% BSA, 0.25% Tween, and 10% sucrose; and stored at 4 °C before further use.
2.4 Preparation of Lateral Flow Strip (LFS)
LFS consists of four components: sample application pad, conjugate pad, nitrocellulose membrane, and absorbent pad (Figure S1 in support information). All components were mounted on a common backing layer (typically an inert plastic, e.g., polyester) using the Clamshell Laminator (Biodot, CA). The sample application pad (17 mm × 30 cm) was made from glass fiber (CFSP001700, Millipore) and saturated with a buffer (pH 8.0) containing 0.25% Triton X-100, 0.05 M Tris-HCl, and 0.15 M NaCl. Then, the pad was dried at 37°C for 2 h and stored in desiccators at room temperature. The test zone and control zone of the LFS were prepared by dispensing streptavidin-biotinylated DNA probe solutions on the nitrocellulose membrane (25 mm × 30 cm). The streptavidin-biotinylated DNA probes were prepared as described previously (Mao et al., 2009). Briefly, 60 μL of 1 mM biotinylated DNA probes (DNA probe 1, or DNA probe 2 or DNA probe 3, see the sequences in Table 1) and 140 μL of PBS were added to 300 μL of 1.67 mg/mL streptavidin solution, and the mixture was incubated 1 h at RT. The excess DNA probes were removed by centrifugation for 20 min with a centrifugal filter (cutoff 30000, Millipore) at 6000 rpm. The conjugates were washed three times with 1 mL of PBS in the same centrifugal filter. Finally, 500 μL of PBS was added into the remaining solution in the filter. The solutions were then dispensed on the test and control zones of nitrocellulose membrane with the dispenser Biojet BJQ 3000. The distance between the test zone and control zone was 3 mm. The membrane was then dried at 37 °C for 1 h and stored at 4 °C in a dry state. Finally, the sample pad, conjugate pad, nitrocellulose membrane, and absorption pad were assembled on a plastic adhesive backing (60 mm × 30 cm) using the clamshell laminator. Each part overlapped 2 mm to ensure the solution was migrating through the strip during the assay. Strips with a 3 mm width were cut by using the Guillotin cutting module CM 4000. For differentiation of R142C and G529I mutant DNAs, two test zones were prepared by dispensing streptavidin-biotinylated DNA solutions at different locations on the nitrocellulose membrane; the distance between two test zones was 3 mm.
2.5 Analytical Procedure
Sample solutions containing target DNA (SBM, or wild-type DNA or noncomplementary DNA) were prepared in fourfold-diluted SSC buffer containing 4% BSA. In a typical test, 100 μL of sample solution and 4 μL of HO-Au-NP conjugate solution were added to a 1.5 mL microcentrifuge tube; the mixture was incubated 10 min at RT. A LFS was then dipped into the solution. After waiting for 10 min, 40 μL of running buffer (fourfold-diluted SSC buffer containing 4% BSA) were added to the microcentrifuge tube to wash the LFS. The visual detection was completed in 10 min. The total assay time was 25 min. The intensities of the red bands on the test and control zones were determined by scanning the LFS with a portable strip reader.
3. Results and Discussion
3.1 Design of the new HO and Principle of detecting SBM visually
The purposes of this new design are to obtain high signal to noise (S/N) ratio of detecting SBM by increasing the stability of HO with long stem, and increasing the specificity of HO with double-target DNA (SBM) binding sequences in the loop. It has been reported that MB with short stem length have faster hybridization kinetics but suffer from lower S/N ratio (Goel et al., 2005). Most MB studies have indicated that the maximum stability with target is obtained with 15–25 base sequences in the loop together with 5–7 bp in the stem (Scheme 1A) (Tyagi et al., 1996; Kostrikis et al., 1998; Ortiz et al., 1998; Tyagi et al., 1998). The loop of traditional HO or MB has a specific sequence, which is complementary with the target DNA (Scheme 1A) (Goel et al., 2005; Kim et al., 2008). The stability difference of the formed duplexes between HO-complementary DNA and HO-SBM led to the formation of different amount of duplex DNA, thus different fluorescence signals. In this new design, the stem of HO has 11 bp (Scheme 1B), which is 4 bp more than that of traditional HO (Scheme 1A). The long stem is expected to offer the better stability of HO. The beauty of current HO design is to incorporate two SBM binding sequences in the HO loop. The loop sequence of the new HO is complementary with the SBM and one-base mismatched with the wild-type DNA. Based on the new design, two SBMs are required to hybridize with the sequences of HO loop (Scheme 1B), the formed duplexes will open the stems of the HO; in the presence of wild-type DNA (one-base mismatched DNA), the formed duplexes between HO and wild-type DNA will have two mismatched base-pairs (two A-C, Scheme 1C). The two mismatched base-pairs and long stem-loop HO structure, which has slower hybridization kinetics, couldn't cause the conformation change of the HO. Therefore the HO still keep the step-loop structure (Scheme 1C). In addition, the new HO doesn't require a biotin-modification at its 3′ end.
Scheme 1.

(A) The structure of traditional HO with short stem-loop. (B) the structure of new HO with two SBM binding sequences in loop and 11-base in the stem. The bases in black are the sites mismatched with wild-type DNA, and the double bold lines in the loop are used to indicate the beginning and ending binding sites of SBM. (C) the structure of formed HO-SBM complex. (D) Schematic illustration for capturing gold nanoparticles on the test zone of lateral flow strip. (E) Schematic illustration for capturing gold nanoparticles on the control zone of lateral flow strip. (F) Schematic illustration for capturing gold nanoparticles on the test zone of lateral flow strip with traditional HO in the presence of wild-type DNA. SA: streptavidin; Au: gold.
One of the major benefits of this new design is the extremely high specificity of the HO by incorporating an additional sequence (complementary with SBM) in the HO loop to increase the mismatched base-pairs in the presence of wild-type DNA. First we compared the specificities of the traditional HO (Scheme 1A) and the new HO (Scheme 1B) for the visual detection of SBM. Arg142Cys (R142C) of the transglutaminase 1 (TGM1) gene in autosomal recessive congenital ichthyosis (ARCI) was used as target DNA (SBM), which is complementary with the loop sequence of HO. The HO modified with thiol at its 5′ end was immobilized on the Au-NP surface through a self-assembling process according to the reported methods with slight modifications (He et al., 2010). The hybridization reactions between the Au-NP-HO and SBM or wild-type DNA were performed 10 min in 1.5-mL centrifuge tube by mixing the Au-NP-HO conjugates and DNA sample solution. The hybridization reaction product which contains the formed Au-NP-HO-SBM and the excess of the conjugates was applied to the sample pad of LFS, in which two DNA probes were immobilized on the test zone and control zone of LFS, respectively (Figure S1 in supporting information). The DNA probe 1 on the test zone is complementary with the stem sequence of HO, and the DNA probe 2 on the control zone is complementary with the stem sequence and part of the loop sequence. When the solution migrated by capillary action and passed the test zone, the Au-NP-HO-SBM complexes were captured by the DNA probe 1 through the hybridization reactions between DNA probe 1 and the open stem sequence (Scheme 1D). The accumulation of Au-NPs in the test zone was visualized as a characteristic red band. Then, the excess of Au-NP-HO conjugates continued to move and were captured on the control zone by hybridization reactions between the DNA probe 2 and HO on the Au-NP surface, thus forming a second red band (Scheme 1E). In the absence of SBM and in the presence of wild-type DNA and noncomplementary DNA, there was no duplex DNA produced in the sample solution; therefore, no Au-NP conjugate was captured on the test zone of the LFS, and no red band was observed in the test zone. In this case, a red control band on the control zone of the LFS shows that the LFS and Au-NP-HO were working properly. Because of fast hybridization kinetics of traditional HO with short stem-loop, there are Au-NP associated duplex DNA complexes produced in the presence of wild-type DNA, which would be captured on the test zone of LFS (Scheme 1F), and a red band would be observed in the test zone.
Figure 1(A) presents the typical photo images of LFSs with the new HO (left) and traditional HO (right) in the presence of 5- nM SBM (R142C mutant), 5-nM wild-type DNA, 50-nM noncomplementary DNA and 0-nM SBM. As expected, no red band was observed on the test zones of LFSs (both the new HO and traditional HO) in the absence of SBM (0-nM, control) and 50-nM noncomplementary DNA. Red bands with similar intensities on the test zones of LFSs were observed with both the traditional HO and the new HO in the presence of 5-nM SBM. It indicated that the conformation of the new HO was changed due to the hybridization reactions between the SBM and the loop sequences of HO. In the presence of 5-nM wild-type DNA, a distinct red band and a negligible red band was observed on the test zone of LFSs with the traditional HO and new HO, respectively. In order to compare the signals quantitatively, the intensities of the red bands on the LFS were recorded with a portable strip reader. The strip was inserted into the strip reader, and the optical intensities of the test and the control bands were recorded simultaneously by using the “GoldBio strip reader” software. Figure 1(B) presents the histograms of the intensities of the red bands on the test zones. The intensity of the red band with the new HO is 4 times less than that with the traditional HO in the presence of 5-nM wild-type DNA, and the signal ratio between SBM and wild-type DNA with the new HO (18.6) is 4.7 times higher than that with traditional HO (3.98). The results indicated the specificity of the new HO was improved dramatically by incorporating additional binding sequence of target DNA in the loop.
Figure 1.
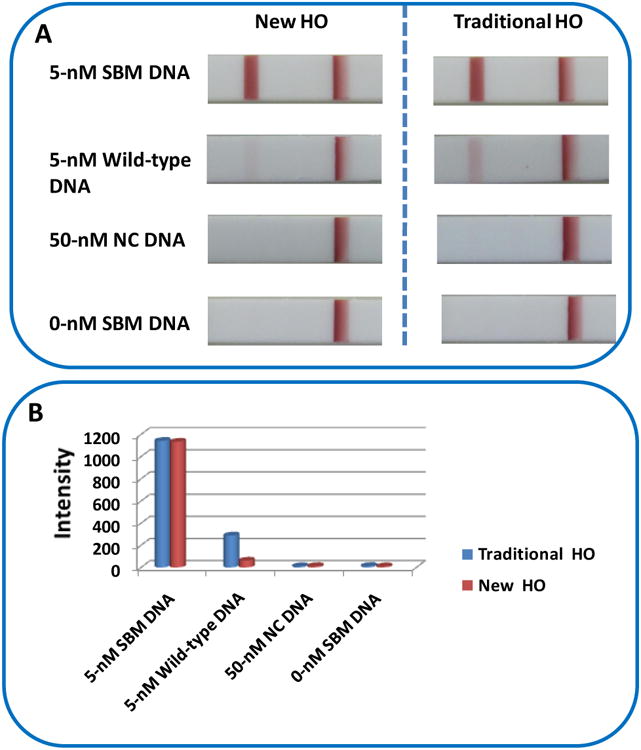
(A) Typical photo images of the LFSs after analysis of 5-nM SBM, 5-nM wild-type DNA, 50-nM noncomplementary DNA and 0-nM DNA with the new HO and traditional HO. Assay time: 25 min; Running buffer: 4×SSC buffer containing 4% BSA. (B) Histogram of the intensities of the red bands on the test zone of LFSs.
The stabilities of the new HO and traditional HO were compared by measuring the signal ratio between 5-nM SBM and 0-nM SBM with different incubation temperatures (25 °C, 37 °C and 45 °C). It was found that the signal ratio of the assay with the new HO varied slightly, however the signal ratio with the traditional HO decreased with the increase of the incubation temperatures (Figure S2). The decreased signal ratio with traditional HO at higher temperature would be attributed to the increased background signal, which was caused by the conformation change of traditional HO. The results indicated that the new HO with the long-stem offered the better stability, which is consistent with Goel's work (Goel et al., 2005).
3.2 Optimization of Experimental conditions
To improve the specificity and sensitivity of the SBM detection, the experimental conditions including the concentration of HO used in the preparation of Au-NP-HO conjugates, the volume of Au-NP-HO used in the hybridization reaction, hybridization reaction time and the components of the running buffer were optimized systematically. The optimizations were performed by varying one experimental condition and keeping constant conditions for other parameters. Control experiments (in the absence of SBM) were conducted at the same conditions. The S/N ratio was used to evaluate the experimental performances. It was found that the highest S/N ratio was obtained with 10 min hybridization reaction in 100 μl of 4×SSC buffer containing 4 μl Au-NP-HO conjugates, which were prepared with 1 OD of HO (Figure S3 in supporting information).
3.3 Specificity, selectivity, sensitivity and reproducibility
Under the optimum conditions, we examined the specificities of both the new HO and traditional HO with different concentrations of SBM and wild-type DNA. The specificities were evaluated by calculating the signal ratios of the red bands on the test zones between SBM and wild-type DNA. Figure 2 shows the histogram of the signal ratio of the assay with the new HO and traditional HO at different SBM concentration levels. It can be seen that the signal ratio between the SBM and wild-type DNA increased with a higher DNA concentration, up to 2.5 nM, and then, it decreased at higher concentrations for both the new HO and traditional HO. The signal ratio loss with a higher concentration of DNA would be attributed to the increased signal of test zone in the presence of higher concentration of wild-type DNA, which may cause the confirmation change of HO, thus leading to the formation of duplex DNA. The highest signal ratio between the SBM and wild-type DNA with the new HO was 27.9 at 2.5-nM DNA concentration level, which is three times higher than that with the traditional HO (9.1) under the same conditions. It should be mentioned that the new HO had better differentiation ability at high DNA concentration range (5.0 to 100 nM) than that of traditional HO. The selectivity of the new HO-based approach was studied by detecting 5-nM SBM in the absence and presence of 50-nM noncomplementary DNA (Figure S4 in support information). Similar responses (intensities of the red bands in the test zone of LFSs) were obtained with both two sample solutions, indicating the excellent selectivity of the new HO-based approach. We examined the responses of the sample solutions with different concnetrations of SBM, and found the detection limit (DL) (5.0 pM) with the new HO-based approach is little higher than that with the traditional HO (1.0 pM). The high DL with the new HO would be caused by the double-target binding sequence in the loop.
Figure 2.
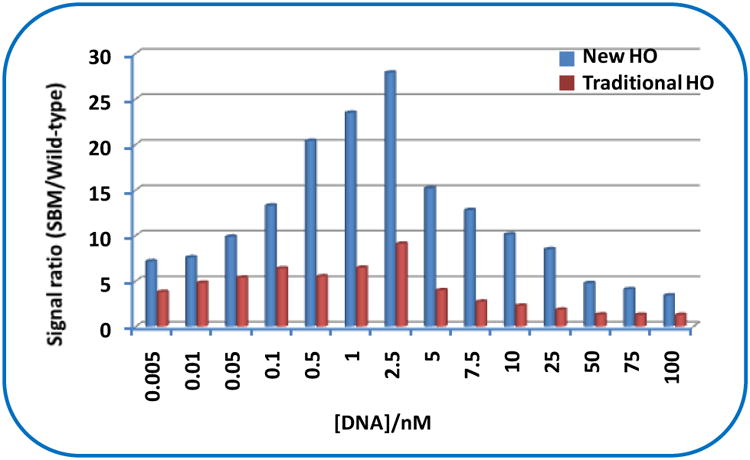
Histogram of the signal ratio between SBM and wild-type DNA with the new HO (blue bar) and traditional HO (red bar) at different DNA concentration levels.
The sensitive and specific response was coupled with high reproducibility. The reproducibility of the assay was assessed by testing 5-nM SBM, 5-nM wild-type DNA, 50-nM noncomplementary DNA and 0-nM SBM. Similar responses were obtained for each sample. The coefficients of variation of the test (peak area) for 5-nM SBM, 5-nM wild-type DNA, 50-nM noncomplementary DNA and 0-nM SBM were 4.7%, 5.8%, 4.2%, and 4.6%, respectively (n=6). The overall relative standard deviation was less than 6.0%, which indicates a good reproducibility.
3.4 Analytical applications
ARCI is a rare, heterogenous keratinization disorder of the skin, classically divided into two clinical subtypes, lamellar ichthyosis (LI) and nonbullous congenital ichthyosiormis erythroderma (CIE) (McKusick et al., 1994). Recently, strong evidence for the involvement of the TGM1 mutations in LI has evolved; R142C and G529I are the hot mutation spots of TMG1 gene (Laiho et al., 1997). In order to realize the differentiation of R142C and G529I with current approach, we designed two HO probes which had complementary sequence to the mutant DNA containing R142C and T529I mutation sites, respectively (see the sequences of HO and mutant DNA in Table 1). Two test zones were prepared by dispensing DNA probe 1 and DNA probe 3 solutions on the nitrocellulose membrane of LFS. The sample solutions, including 5-nM R142C-mutant DNA, 5-nM G529I-mutant DNA, 5-nM R142C-mutant DNA+5-nM G529I-mutant DNA, 0-nM mutant DNA (control), and 50-nM wild-type DNA were tested. The typical photo images of LFSs are shown in Figure 3. Three bright red bands (two test bands and one control band) were observed on the LFS with the sample solution containing both R142C- and G529I-mutant DNA. In the case of testing the sample solution containing either R142C- or G529I-mutant DNA, only two red bands (one test band and one control band) were observed, and the test band appeared on the corresponding test zone of the LFS. The results indicated that no cross-reaction occurred in the hybridization reactions. In the presence of 50-nM wild-type DNA, no bands were observed on the test zones. As expected, there was no test band observed in the test zones of LFS in the absence of DNA. These results have shown that the proposed approach is capable for differentiating mutation spots of R142C and G529I. It is also possible to scale up for detecting multiple mutation sites simultaneously by using LFS array.
Figure 3.

Typical photo images of the LFSs after analysis of 0-nM SBM, 50-nM wild-type DNA, 5-nM R142C DNA, 5-nM G529I DNA, and the mixture of 5-nM R142C DNA+5-nM G529I DNA with the two HO probes.
4. Conclusions
We have designed a new HO with double-target DNA binding sequences in the loop and 11-base in the stem for visual detection of SBMs in DNA with highly specificity. Compared with traditional HO, the ability of the new HO to differentiate SBM from wild-type DNA has been increased three to five times. The signal ratio between SBM and wild-type DNA was up to 28, which is much higher than that of conventional MB or HO. The application of the new HO has been demonstrated by detecting two hot mutation spots (R142C and G529I) of DMG1 gene in ARCI. The results presented here show that the new HO is a potential molecular recognition probe for the future development of nucleic acid-based biosensors and bioassays. The approach can be used for point-of-care diagnosis of genetic diseases as well as for detecting infectious agents or warning against bio-warfare agents.
Supplementary Material
Highlights.
We describe a hairpin oligonucleotide (HO) with double-target DNA binding sequences in the loop and 11-base in the stem for visual detection of single-base mismatches in DNA with highly specificity. The signal ratio between single-base-mismatched DNA and perfect-matched DNA was up to 28.
Acknowledgments
This research was supported by Award Number R21CA137703 from the National Cancer Institute. Y. He acknowledges financial support from the Natural Science Foundation of China (NO. 81071286), Guangdong Provincial Natural Science Foundation of China (NO. 10151009503000002), and the Key Research Plan Foundation of the Guangzhou Health Department (NO. 201102A212016).
Footnotes
Publisher's Disclaimer: This is a PDF file of an unedited manuscript that has been accepted for publication. As a service to our customers we are providing this early version of the manuscript. The manuscript will undergo copyediting, typesetting, and review of the resulting proof before it is published in its final citable form. Please note that during the production process errors may be discovered which could affect the content, and all legal disclaimers that apply to the journal pertain.
References
- Arlett JL, Myers EB, Roukes ML. Nature Nanotechnology. 2011;6:203–215. doi: 10.1038/nnano.2011.44. [DOI] [PMC free article] [PubMed] [Google Scholar]
- Barreiro LB, Henriques R, Mhlanga MM. Methods Mol Biol. 2009;578:255–276. doi: 10.1007/978-1-60327-411-1_17. [DOI] [PMC free article] [PubMed] [Google Scholar]
- Chen LH, McBranch DW, Wang HL, Helgeson R, Wudl F, Whitten DG. Proc Natl Acad Sci USA. 1999;96:12287–12292. doi: 10.1073/pnas.96.22.12287. [DOI] [PMC free article] [PubMed] [Google Scholar]
- Drummond TG, Hill MG, Barton JK. Nat Biotechnol. 2003;21:1192–1199. doi: 10.1038/nbt873. [DOI] [PubMed] [Google Scholar]
- Dubertret B, Calame M, Libchaber AJ. Nat Biotechnol. 2001;19:365–370. doi: 10.1038/86762. [DOI] [PubMed] [Google Scholar]
- Erdogan F, Kirchner R, Mann W, Ropers HH, Nuber UA. Nucleic Acids Res. 2001;29(7):E36. doi: 10.1093/nar/29.7.e36. F. [DOI] [PMC free article] [PubMed] [Google Scholar]
- Fritzsche W, Taton TA. Nanotechnology. 2003;14:R63–R73. doi: 10.1088/0957-4484/14/12/R01. [DOI] [PubMed] [Google Scholar]
- Gaylord BS, Massie MR, Feinstein SC, Bazan GC. Proc Natl Acad Sci USA. 2005;102(1):34–39. doi: 10.1073/pnas.0407578101. [DOI] [PMC free article] [PubMed] [Google Scholar]
- Goel G, Kumar A, Puniya AK, Chen W, Singh K. Journal of Applied Microbiology. 2005;99:435–442. doi: 10.1111/j.1365-2672.2005.02663.x. [DOI] [PubMed] [Google Scholar]
- He Y, Zeng K, Gurung A, Baloda M, Xu H, Zhang X, Liu G. Anal Chem. 2010;82(17):7169–7177. doi: 10.1021/ac101275s. [DOI] [PubMed] [Google Scholar]
- He Y, Zhang X, Zhang X, Baloda M, Gurung A, Xu H, Zhang X, Liu G. Biosensor and Bioelectronics. 2011;26(5):2018–2024. doi: 10.1016/j.bios.2010.08.079. [DOI] [PubMed] [Google Scholar]
- Hoogendoorn B, Owen MJ, Oefner PJ, Williams N, Austin J, O'Donovan MC. Hum Genet. 1999;104:89–93. doi: 10.1007/s004390050915. [DOI] [PubMed] [Google Scholar]
- Johnson MP, Haupt LM, Griffiths LR. Nucleic Acids Res. 2004;32(6):e55. doi: 10.1093/nar/gnh046. [DOI] [PMC free article] [PubMed] [Google Scholar]
- Kaltenboeck B, Wang C. Adv Clin Chem. 2005;40:219–259. doi: 10.1016/S0065-2423(05)40006-2. [DOI] [PMC free article] [PubMed] [Google Scholar]
- Karadeniz H, Kuralay F, Abaci S, Erdem A. Current Analytical Chemistry. 2011;7(1):63–70. [Google Scholar]
- Kim JH, Morikis D, Ozkan M. Sens Actuators B-Chem. 2004;102:315–319. [Google Scholar]
- Kim Y, Sohn D, Tan W. Int J Clin Exp Pathol. 2008;1:105–116. [PMC free article] [PubMed] [Google Scholar]
- Kostrikis LG, Tyagi S, Mhlanga MM, Ho DD, Kramer FR. Science. 1998;279:1228–1229. doi: 10.1126/science.279.5354.1228. [DOI] [PubMed] [Google Scholar]
- Laiho E, Ignatius J, Mikkola H, Yee VC, Teller DC, Niemi K, Saarialho-Kere U, Kere J, Palotie A. Am J Hum Genet. 1997;61:529–538. doi: 10.1086/515498. [DOI] [PMC free article] [PubMed] [Google Scholar]
- Liu L, Li H, Qiu T, Zhou G, Wong KY, He Z, Liu Z. Chem Commun. 2011;47(9):2622–2624. doi: 10.1039/c0cc04712k. [DOI] [PubMed] [Google Scholar]
- Mao X, Ma Y, Zhang A, Zhang L, Zeng L, Liu G. Anal Chem. 2009;81(4):1660–1668. doi: 10.1021/ac8024653. [DOI] [PubMed] [Google Scholar]
- Mckusick, V. A., 1994. New York. Johns Hopkins University Press, Baltimore.
- Merkoci A. Biosensor and Bioelectronics. 2010;26:1164–1177. doi: 10.1016/j.bios.2010.07.028. [DOI] [PubMed] [Google Scholar]
- Ortiz E, Estrada G, Lizardi PM. Mol Cell Probes. 1998;12:219–226. doi: 10.1006/mcpr.1998.0175. [DOI] [PubMed] [Google Scholar]
- Peng H, Miller BL. Analyst. 2011;136(3):436–447. doi: 10.1039/c0an00636j. [DOI] [PubMed] [Google Scholar]
- Rivas GA, Pedano ML. Encyclopedia of Sensors. 2006;3:45–91. [Google Scholar]
- Stojanovic MN, Pradade P, Landry DW. ChemBioChem. 2001;2:411–415. doi: 10.1002/1439-7633(20010601)2:6<411::AID-CBIC411>3.0.CO;2-I. [DOI] [PubMed] [Google Scholar]
- Taton TA, Mucic RC, Mirkin CA, Letsinger RL. J Am Chem Soc. 2000;122:6305–6306. [Google Scholar]
- Toubanaki DK, Christopoulos TK, Ioannou PC, Flordellis CS. Anal Chem. 2009;81:218–224. doi: 10.1021/ac801870x. [DOI] [PubMed] [Google Scholar]
- Tyagi S, Kramer FR. Nat Biotechnol. 1996;14:303–308. doi: 10.1038/nbt0396-303. [DOI] [PubMed] [Google Scholar]
- Tyagi S, Bratu DP, Kramer FR. Nat Biotechnol. 1998;16:49–53. doi: 10.1038/nbt0198-49. [DOI] [PubMed] [Google Scholar]
- Wang K, Tang Z, Yang CJ, Kim Y, Fang X, Li W, Wu Y, Medley CD, Cao Z, Li J, Colon P, Lin H, Tan W. Angew Chem Int Ed. 2008;47:2–17. [Google Scholar]
Associated Data
This section collects any data citations, data availability statements, or supplementary materials included in this article.