Abstract
Purpose
To investigate the short-term reproducibility of black-blood dynamic contrast-enhanced (DCE) magnetic resonance imaging (MRI) in atherosclerotic rabbits to evaluate the potential of this technique to be a reliable readout of plaque progression and/or regression upon therapeutic intervention.
Materials and Methods
Atherosclerotic rabbits were imaged at baseline and 24 hours later with DCE-MRI on a 1.5T MRI system. DCE-MRI images were analyzed by calculating the area under the signal intensity versus time curve (AUC). Intraclass correlation coefficients (ICCs) were used to evaluate interscan, intraobserver, and interobserver reproducibility. In addition, the test–retest coefficient of variation (CoV) was evaluated.
Results
Statistical analyses showed excellent interscan, intraobserver, and interobserver agreement. All ICCs were greater than 0.75, P < 0.01 indicating excellent agreement between measurements.
Conclusion
Experimental results show good interscan and excellent intra- and interobserver reproducibility, suggesting that DCE-MRI could be used in preclinical settings as a read-out for novel therapeutic interventions for atherosclerosis. This preliminary work encourages investigating the reproducibility of DCE-MRI also in clinical settings, where it could be used for monitoring high-risk patients and in longitudinal clinical drug trials.
Keywords: DCE-MRI, atherosclerosis, neovascularization, reproducibility
Cardiovascular disease accounts for ≈30% of deaths worldwide. Among the different cardiovascular disorders, atherosclerosis remains the major cause of death and premature disability in developed societies (1,2). Although conventional risk factors combined with risk scores are helpful in estimating cardiovascular risk in patients groups, they lack predictive power in identifying individual patients at high risk for cardiovascular events and may not provide any indication about the risk associated with a single atherosclerotic lesion (3). Several studies have highlighted the role of inflammation in the pathogenesis of atherosclerotic plaque. These studies indicate that plaque pathological behavior is determined not primarily by size and the level of luminal narrowing, but by plaque composition and inflammation. In particular, pathological studies indicate that plaques with large lipid cores, thin fibrous caps, and inflammatory cell infiltrates accompanied by an abundant plexus of neovessels might be more likely to rupture and precipitate acute clinical events (4,5). The deeper understanding of the role of inflammation in the pathogenesis of atherosclerosis identifies new important markers for the detection and risk stratification of otherwise asymptomatic atherosclerotic lesions. Moreover, by identifying inflammation as a novel target for medical intervention, it opens new possibilities in the therapeutic management of atherosclerosis. While histological markers of plaque inflammation (such as inflammatory cell content and plaque neovascularization) are known and can be evaluated by histology in animal models, it is not feasible to assess them routinely in clinical practice or in either preclinical or clinical drug development studies. Therefore, it would be of clinical relevance to develop noninvasive techniques that could investigate plaque physiology and provide surrogate endpoints for the evaluation of progression/regression of disease and/or treatment efficacy. Among various imaging techniques, magnetic resonance imaging (MRI) and positron emission tomography (PET) have recently been proposed to investigate plaque neovascularization and inflammatory infiltrate, respectively (6–12). The correlation between plaque 18F fluorodeoxyglucose (18F-FDG) uptake measured by PET and plaque macrophage content has been established in animals (13,14), and the reproducibility of this technique together with its potential to monitor the reduction in plaque inflammation after treatment have also been investigated (15). These studies have shown that 18F-FDG PET can reliably measure the degree of plaque inflammation in a noninvasive manner.
Dynamic contrast-enhanced (DCE) MRI is an imaging technique extensively used to study the vascularity of tumors (18). This technique takes advantage of the administration of clinically available contrast agents (ie, gadolinium [Gd] chelates) to quantify the extent of tissue blood supply and its associated physiological characteristics, such as permeability surface area product, extraction fraction, and blood flow. Based on the notion that inflamed, unstable atherosclerotic plaques are highly vascularized, DCE-MRI has also been applied to the study of neovascularization in atherosclerosis. Both “bright-blood” and “black-blood” techniques have been previously used in DCE-MRI of atherosclerosis. In “bright-blood” techniques, the signal from flowing blood in the vessel lumen is preserved and this allows data analysis using model-based approaches. On the contrary, in “black-blood” approaches this same signal is suppressed, thereby restricting the analysis to nonmodel-based approaches. Black-blood approaches, however, allow better delineation of the vessel wall. While bright-blood techniques have been shown successful in quantifying plaque neovascularization in patients with carotid atherosclerosis (6–8), black-blood techniques have been useful in studying animal models of disease (16), where it is imperative to achieve good wall delineation. In more detail, it has been shown that black-blood T1-weighted (T1W) turbo spin echo (TSE) DCE-MRI analyzed by nonmodel-based approaches can quantify neovessels in aortic plaques of atherosclerotic rabbits (correlation coefficient r = 0.89, P = 0.016) (16). These data suggest that DCE-MRI could be useful as a readout for plaque neovascularization and inflammation in preclinical animal studies and also in a clinical environment for monitoring atherosclerotic disease progression or regression in response to antiinflammatory treatment. However, in order for this technique to become a valuable tool in the clinic, more studies are still required. The reliability of this technique has been investigated in tumors, both in animal models and patients as well (17–22), but to our knowledge its short-term reproducibility together with intra- and interobserver variability still needs to be investigated in the context of atherosclerosis.
In the present work we tested the interscan variability together with intra- and interobserver agreement of black-blood DCE-MRI in atherosclerotic rabbits. The experiments performed in this study allowed assessing the reliability of DCE-MRI in a preclinical setting and estimating samples size for the planning of future preclinical studies with adequate power.
MATERIALS AND METHODS
Animal Protocol
Aortic atherosclerotic plaques were induced in 13 New Zealand White (NZW) male rabbits (mean age, 4 months; mean weight = 3.1 ± 0.2 kg; Covance, Princeton, NJ) by a combination of 4 months of high cholesterol diet (4.7% palm oil and 0.3% [weeks 1–8] and 0.15% cholesterol [weeks 9–16]; Research Diet, New Brunswick, NJ) and repeated balloon injury of the aorta (2 weeks and 6 weeks after starting the high-cholesterol diet). Aortic injury was performed from the aortic arch to the iliac bifurcation with a 4F Fogarty embolectomy catheter introduced through the femoral artery. All procedures were performed under general anesthesia by an intramuscular injection of ketamine (20 mg/kg; Fort Dodge Animal Health, Overland Park, KS), xylazine (5 mg/kg; Bayer, Shawnee Mission, KS), and acepromazine (0.5 mg/kg; Boehringer Ingelheim Vetmedica, St. Joseph, MO). The protocol was approved by the Institute Animal Care and Use Committee of Mount Sinai School of Medicine (New York, NY).
MRI Protocol
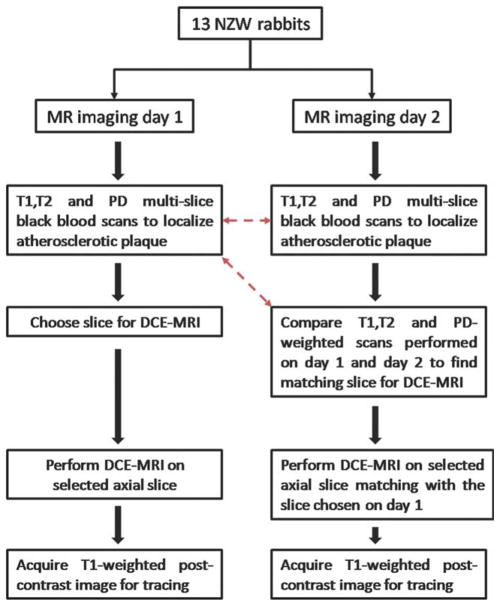
All rabbits were scanned after completion of 4 months of a high-cholesterol diet. During this time all animals also underwent balloon injury of the aorta (2 weeks and 6 weeks after starting the high-cholesterol diet). Under anesthesia, animals were imaged at baseline and 24 hours after baseline with the same MRI protocol. Imaging was performed using a 1.5 T MRI clinical system (Siemens Sonata, Siemens Medical Solutions, Erlangen, Germany) using a knee coil for signal reception. On both occasions, to locate atherosclerotic plaques, 3-mm thick sequential axial images of the aorta were obtained from the celiac trunk to the iliac bifurcation using 2D multislice black blood T1, T2, and proton density (PD)-weighted (T1W, T2W, PDW) fast spin-echo sequences (TE, 5.6/39/5.6 msec; TR, 800/2000/2000 msec; interslice gap, 0.6 mm; field of view [FOV], 12 × 12 cm; matrix size, 256 × 256; echo train length, 7; and signal averages, 16). Spectral fat suppression was applied to null the signal from the periadventitial fat. DCE-MRI was performed on one selected axial slice using a black-blood double inversion recovery (DIR) turbo spin echo (TSE) sequence (slice thickness, 3 mm; TE, 5.6 msec; TR, 250 msec; FOV, 12 × 12 cm; matrix size, 256 × 256; echo train length, 15; signal averages, 1). A total of 100 images per rabbit were acquired, with a time resolution of 4.8 seconds. After a 24-second delay from the beginning of the DCE-MRI acquisition (equivalent to five precontrast images), 0.2 mmol/kg of Gd-DTPA (Magnevist) was injected with a power injector at a rate of 0.5 mL/s followed by a 10-mL saline flush through a marginal ear vein. After the DCE-MRI scan a T1W postcontrast MR image of the same axial slice selected for DCE-MRI was acquired (slice thickness, 3 mm; TE, 5.6 msec; TR, 250 msec; FOV, 12 × 12 cm; matrix size, 256 × 256; echo train length, 15; signal averages, 16). This image was acquired with the exact imaging parameters used for the DCE acquisition, except for the number of averages (16 instead of one), in order to clearly delineate the atherosclerotic vessel wall. After 24 hours all animals were imaged with exactly the same protocol (2D T1W, T2W, and PDW multislice black-blood scans, followed by black-blood T1W DCE-MRI and T1W postcontrast scans on a selected axial slice). On the second day, DCE-MRI was performed on an axial slice matching the one chosen on the first day of imaging. In order to ensure proper matching between slices T1W, T2W, and PDW scans of both sessions were compared at the MRI console on the day of the second scan by simultaneously evaluating all images starting from the iliac bifurcation up to the renal arteries. Slice matching between the two imaging sessions was achieved by using anatomical fiducial markers such as the iliac bifurcation, the vertebral column, and the renal arteries. Figure 1 illustrates the flow chart followed during imaging sessions on days 1 and 2, while Figure 2 shows PDW images of two matching slices chosen for DCE-MRI during day 1 (Fig. 2a) and day 2 (Fig. 2b).
Figure 1.
Flow chart followed during baseline and 24 hours scan. Red dashed arrows indicate the scans compared during the 24 hours scan to find the slice matching with the one used for the DCE-MRI acquisition during the baseline scan.
Figure 2.
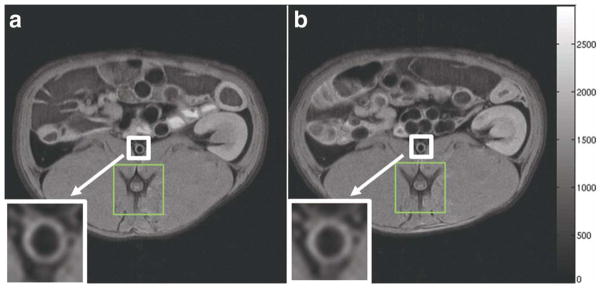
PDW images of the slice chosen for DCE-MRI of a representative rabbit. a: The slice chosen during the baseline scan. b: The corresponding slice chosen during the 24 hours scan. The white box and arrow indicate the abdominal aorta (also magnified at the bottom left of both panels). The green box indicates the vertebral spine, which was used as an anatomical fiducial marker to match the two slices.
DCE Image Analysis
The change of signal intensity in a region-of-interest (ROI) including the atherosclerotic plaque visible in the slice selected for DCE-MRI was evaluated with a custom-made MatLab (MathWorks, Natick, MA) program. The area under the signal intensity versus time curve (AUC) was calculated at different timepoints (1, 2, and 7 minutes after injection of contrast agent) by numerical integration via the trapezoidal rule of the time series using the following equation:
| [1] |
where SI(t) represents the signal intensity in one given pixel at time t, SIprecontrast represents the average precontrast signal intensity value calculated as the pixel-by-pixel average intensity of the first five precontrast images and T = 1, 2, and 7 minutes after injection. AUC is a measure that expresses the uptake and retention of contrast agent in a tissue of interest. AUC calculated at 1 and 2 minutes after injection have been shown to correlate with plaques neovascularization in aortic plaques of NZW rabbits (16). However, since both wash-in and wash-out kinetics contribute to this measure, we evaluated reproducibility of AUC calculated also at a later timepoint after injection (7 minutes) in order to capture both these aspects.
Assessment of DCE-MRI Reproducibility
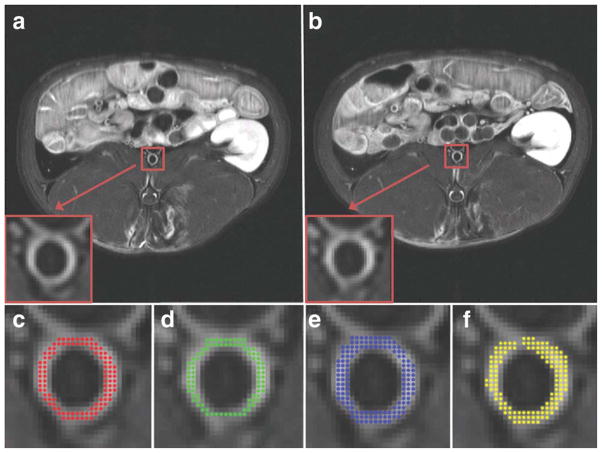
In order to ensure proper calibration between scans performed on different days the precontrast signal intensity in a reference tissue (resting skeletal perivertebral muscle) and in regions of background noise was evaluated for each animal in both scans. Care was taken not to choose ROIs where the effect of the intramuscular injection of anesthesia (defined as bright areas in T2-weighted images of the same slice) was visible. Skeletal muscle undergoes enhancement during contrast agent injection; however, since calibration was performed only on precontrast images and since contrast agent washes out between scans, this does not affect the calibration procedure. ROIs covering the whole atherosclerotic aortic vessel wall visible in the slice of interest were independently traced by two observers (respectively with 3 and 8 years experience in MRI of atherosclerosis) on T1W postcontrast images of the slice selected for DCE acquisition in order to assess interscan and interobserver variability. The size of the ROI varied from animal to animal, depending on the diameter of the aorta and vessel wall thickness. A typical size ROI was on average 100 pixels (Fig. 3). In order to minimize recall bias the tracing dataset was randomized for both observers and for both tracing sessions. Figure 3 shows an example of the images used for tracings of one rabbit (Fig. 3a, first scan; Fig. 3b, second scan) and of the tracings of both observers (Fig. 3c–f).
Figure 3.
T1-weighted postcontrast images used for tracing or the vessel wall for DCE-MRI data analysis of the same atherosclerotic rabbit shown in Fig. 2 (a: day 1; b: day 2). The red box and arrow indicate the abdominal aorta (also magnified at the bottom left of both panels). c: The tracing of observer 1 for day 1 (area covered with red dots). d: The tracing of observer 1 for day 2 (area covered with green dots). The tracings shown in c,d were used to evaluate interscan variability. e: The repeated tracing of observer 1 for day 1 (area covered with blue dots). The tracings shown in c,e were used to evaluate intraobserver variability. f: The tracing of observer 2 for day 1 (area covered with yellow dots). The tracings shown in c,f were used to evaluate interobserver variability.
Statistical Analysis
A paired t-test was used to verify a potential difference in signal intensities between consecutive scans in the tissue of reference and in regions of background noise in order to ensure adequate signal intensity calibration. Intraclass correlation coefficients (ICCs) with 95% confidence intervals were calculated to test the interscan variability and interobserver and intraobserver agreement using SPSS software (Chicago, IL). For interscan variability 13 datapoints were included in the analysis (one data point for each rabbit). For evaluation of intraobserver and interobserver reproducibility 26 data points were included in the analysis (all tracings from both observers or repeated tracings from one observer for both scanning sessions). The average AUCs for scan 1 and scan 2, their average difference (defined as the average of the difference between AUC for scan 1 and scan 2 for each rabbit), as well as the coefficient of variation (CoV) were calculated. The test–retest CoV was calculated as the standard deviation of AUC derived from two consecutive scans on the same subject, divided by their mean, averaged across subjects. A priori power analysis was also performed. The power of a statistical test is defined as the probability that the test will not make type 2 errors. If the rate of type 2 errors, or false-negatives, is defined as β, then the power is defined as 1−β. By assuming a given statistical significance (defined as α) and effect size that needs to be detected, a priori power analysis can be used to determine an appropriate sample size to achieve adequate power. A priori power analysis was performed using GPower software, v. 3.0 (Universitat Kiel, Germany) based on a 2-sample paired t-test (2-sided) with 1−β (power) = 80% power and α = 5%. Bland–Altman plots with their corresponding limits of agreement were drawn to evaluate systematic measurement bias. The limit of agreement lines were calculated as mean ± 1.96 SDs of the difference of AUC values in two consecutive scans.
RESULTS
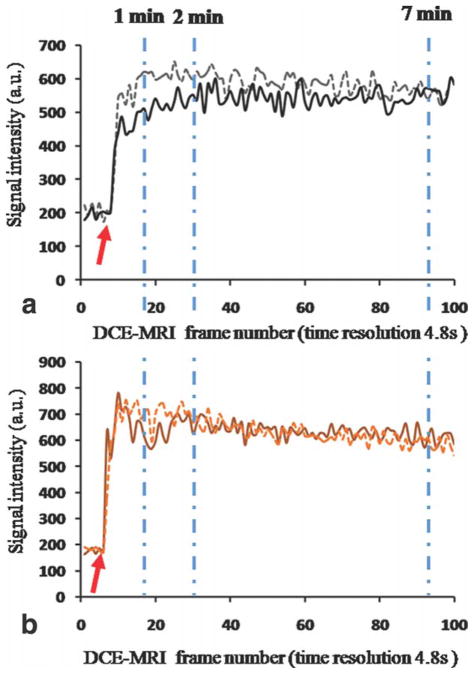
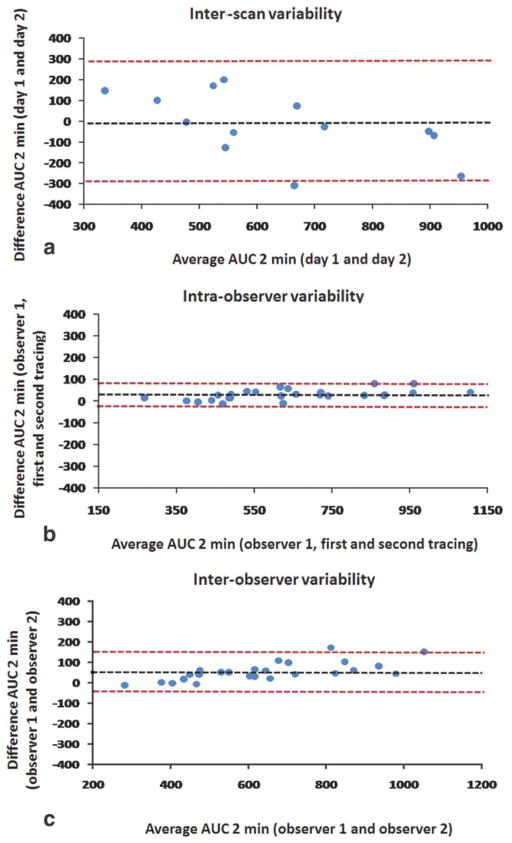
No statistical difference was found between signal intensity values evaluated in the first scan and signal intensity values evaluated in the second scan (P = 0.29) for regions of perivertebral muscle. Similar calibrations performed on regions of background noise led to the same results (P = 0.84). This ensured adequate signal intensity calibrations among scans performed on different days. Statistical analyses showed excellent interscan, intraobserver, and interobserver agreement for all the parameters evaluated in the study. Table 1 shows the ICC for all the AUC measures evaluated (1, 2, and 7 minutes) for interscan, intraobserver, and interobserver variability: all ICC values for all parameters were greater than 0.75 (P < 0.01), indicating excellent agreement (23). Table 2 shows interscan variability data for AUC 1, 2, and 7 minutes: the CoV show a test–retest variability of respectively 17% for AUC 1 minute, 16% for AUC 2 minutes, and 11% for AUC 7 minutes, comparable to other DCE-MRI studies. Figure 4 shows an example of two AUC maps of one representative rabbit (same animal shown in Figs. 2, 3), calculated from respectively the first (Fig. 4a) and the second (Fig. 4b) scan. Both maps are represented with the same color scale and show great similarity, both overall and in the vessel wall (Fig. 4a,b, lower left panel). Figure 5 shows plaque ROI curves from two representative rabbits captured from both imaging sessions and demonstrates a very similar plaque enhancement in both cases. Figure 6 shows: plots of AUC values calculated from the baseline scan, versus AUC values calculated from the second scan (Fig. 6a); plot of AUC values traced by one observer (observer 1) at two different times, 1 month apart (Fig. 6b); plot of AUC values traced by observer 1 versus AUC values traced by observer 2 (Fig. 6c). Both correlation plots and Bland–Altman analysis (Fig. 7) show excellent agreement between the measures.
Table 1.
Interscan, Intraobserver, and Interobserver Agreement
| AUC 1 min | AUC 2 min | AUC 7 min | |
|---|---|---|---|
| Interscan ICC | 0.840 (P = 0.002) | 0.834 (P = 0.002) | 0.768 (P = 0.009) |
| Intraobserver ICC | 0.997 (P < 0.001) | 0.997 (P < 0.001) | 0.996 (P < 0.001) |
| Interobserver ICC | 0.983 (P < 0.001) | 0.988 (P < 0.001) | 0.991 (P < 0.001) |
AUC, area under the curve; ICC, intraclass correlation coefficient.
Table 2.
AUC Variability Between Scans
| AUC 1 min | AUC 2 min | AUC 7 min | |
|---|---|---|---|
| Scan 1 average | 277.1 (79.8) | 624.5(160.0) | 2350.7(506.9) |
| Scan 2 average | 280.4 (131.2) | 640.5 (246.7) | 2383.3 (682.7) |
| Average difference | −3.3 (77.4) | −16.0 (156.9) | −32.5 (521.6) |
| CoV | 17% | 16% | 11% |
AUC, area under the curve; CoV, coefficient of variation. Standard deviation is indicated in parenthesis.
Figure 4.
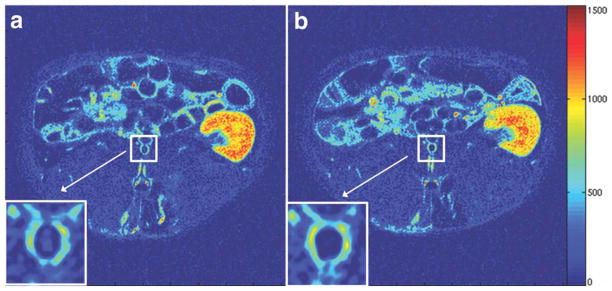
AUC maps (2 minutes) of the same atherosclerotic rabbit shown in Figs. 2 and 3 (a: day 1; b: day 2). The white box and arrow indicate the abdominal aorta (also magnified at the bottom left of both panels). Both maps are presented with the same color scale, windowing, and contrast. Hot colors indicate high AUC values, while cold colors indicate low AUC values.
Figure 5.
Signal intensity of plaque ROI curves. a: Plaque ROI curve for the same representative rabbit shown in previous figures. b: Plaque ROI curves for a second representative rabbit. X axis, frame number of DCE-MRI acquisition. Y axis, signal intensity (absolute units) of plaque ROI curve. Solid lines represent plaque ROI curves from DCE-MRI acquisition of day 1. Dashed lines represent plaque ROI curves for DCE-MRI acquisition of day 2. Dashed dotted light blue lines show the timepoints at which AUC was calculated (1, 2, and 7 minutes after injection). Baseline values were not subtracted in order to show that they are comparable between scans performed during different sessions. Red arrow indicates the time for beginning of calculation of AUC.
Figure 6.
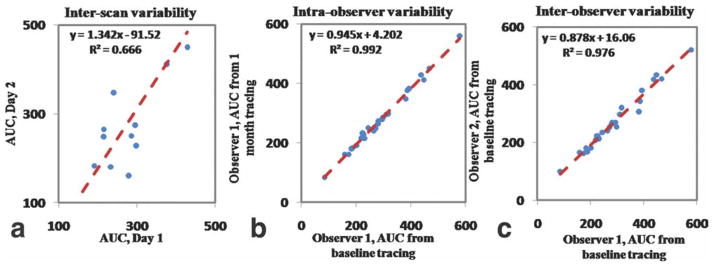
Correlations between: (a) AUC 1 minute evaluated on DCE-MRI scan of day 1 versus AUC 2 minutes evaluated on DCE-MRI scan of day 2 for the evaluation of interscan variability; (b) AUC 1 minute, baseline tracings of observer 1 versus 1 month tracings of the same observer for the evaluation of intraobserver variability; (c) AUC 1 minute, baseline tracings of observer 1 versus baseline tracings of observer for the evaluation of interobserver variability. Red dashed line indicates regression line. Both axes represent AUC values expressed in absolute units.
Figure 7.
Bland–Altman plots for interscan (a), intraobserver (b), and interobserver (c) variability for AUC 2 minutes. The black dashed line represents the average difference between the two measurements, while the limits of agreement are drawn as red dashed lines (average difference ± 1.96 SDs). Both axes represent AUC values expressed in absolute units.
DISCUSSION
In this study we tested the short-term reproducibility of black-blood DCE-MRI for imaging of the abdominal aorta of atherosclerotic rabbits. Overall the study shows that the reliability of this technique compares well with other imaging techniques used to investigate atherosclerosis, such as 18F-FDG PET (15,22) and noncontrast MRI (24,25). 18F-FDG PET is a nuclear medicine technique that has recently been proposed to investigate plaques of inflammatory activity (6–12). The correlation between plaque 18F-FDG uptake measured by PET and plaque macrophage content has been established in several animal studies (13,14). In addition, Rudd et al (15,22) recently investigated the interscan, intraobserver, and interobserver reliability of 18F-FDG PET for the study of the inflammatory activity of atherosclerotic lesions in aortas and in carotid, iliac, and femoral arteries of patients. These studies showed excellent short-term reliability of this technique, thus indicating its possible role as a surrogate marker of plaque inflammation in multicenter longitudinal trials (15,22). Recent studies have shown that both black-blood DCE-MRI nonmodel-based derived parameters and 18F-FDG standard uptake value (SUV) correlate positively with the degree of plaque neovascularization in the aorta of NZW atherosclerotic rabbits (16). These studies suggest that DCE-MRI could also be used as a surrogate marker of plaque inflammation, while complementing or possibly even substituting the role of 18F-FDG PET in the evaluation of plaque metabolic activity, without delivering ionizing radiation to imaging subjects. However, in order for this technique to become a valuable tool in the clinic its interscan, intraobserver, and interobserver variability need to be investigated. In the present study we investigated the short-term reproducibility of DCE-MRI for imaging of the abdominal aorta of atherosclerotic rabbits. We showed excellent interscan reliability of the parameter AUC (Tables 1, 2 and Figure 6) for the investigation of atherosclerosis in the abdominal aorta of NZW atherosclerotic rabbits. In addition, inter- and intraobserver variability was tested and also showed excellent agreement (Table 1; Figure 7). Table 2 provides the average AUCs for scan 1 and scan 2 and their average difference together with their standard deviations (in brackets). From these values it is possible to estimate the test–retest CoV, which shows a variability of respectively 17% for AUC 1 minute, 16% for AUC 2 minutes, and 11% for AUC 7 minutes, comparable to other DCE-MRI studies. By relying on this information, a priori power analysis was also performed in order to estimate the subject numbers that would be needed in drug trials to observe an effect of a desired magnitude. Figure 8 shows an example of sample size calculation required to detect different changes induced by a hypothetical drug, based on the data provided in Table 2 for AUC 7 minutes. While these estimates do not take into account intersubject variability in the response to a given treatment or subjects drop-off from clinical studies, they do provide guidelines for the minimum sample size required while planning drug trials in animals in preclinical settings. One of the limitations of the present study is that DCE-MRI was performed only on one selected axial slice and, therefore, the presented results rely on matching of chosen slices between the two imaging sessions. However, since DCE-MRI of the vessel wall imposes very high constraints in terms of in-plane spatial and time resolution, it usually allows only for limited slice coverage for every frame acquired. Therefore, visual matching between scans performed, for example, in longitudinal studies will most likely be always needed and the accuracy of this process will affect experimental results. In this study we aimed to test the reproducibility of the “worst-case scenario,” in which, in order to maximize spatial and time resolution, slice coverage was sacrificed to only one axial slice. In addition, we aimed to test the reproducibility of a previously used protocol (16) which has been proven effective in correlating AUC from black-blood DCE-MRI with neovessels count by histology. Despite the study limitations, our results show that this experimental setup could potentially be used in preclinical drug trials to evaluate experimental drug efficacy by MRI. These results are encouraging and suggest that, if DCE-MRI is proven to be equally reproducible in clinical settings, there is a potential role for this technique in future clinical practice for the evaluation of high-risk patients and as a surrogate imaging marker in clinical drug trials. This technique could be used to noninvasively investigate metabolic activity of atherosclerotic plaques to assess the risk associated with atherosclerotic lesions, monitor disease progression and metabolic changes after treatment with conventional lipid-lowering or antiinflammatory drugs.
Figure 8.
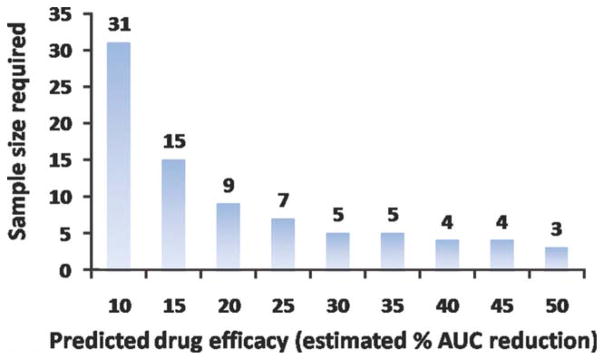
A priori power analysis for sample size calculation. The plot shows the minimum number of required subjects in trials using DCE-MRI to detect changes in atherosclerotic plaques metabolic activity as a function of the estimated level of drug effect.
In conclusion, DCE-MRI has been shown to correlate to plaque inflammation in atherosclerotic rabbits and has the potential to be useful for monitoring the response to drug therapy in preclinical studies. In order for DCE-MRI to be a good therapy read-out, this technique has to be sufficiently reproducible. This study investigated the interscan, intra-, and interobserver reliability of DCE-MRI in the abdominal aorta of atherosclerotic NZW rabbits. Experimental results show excellent interscan, intra-, and interobserver agreement (Tables 1, 2), suggesting that DCE-MRI could be used in preclinical settings as a read-out for novel antiinflammatory therapies. In addition, this preliminary work encourages investigating the reproducibility and the application of this technique also in clinical settings, where it could be used for monitoring high-risk patients and in longitudinal clinical drug trials.
Acknowledgments
We thank the Department of Radiology at Mount Sinai School of Medicine and Dr. Burton P. Drayer, MD for their continuing support. We thank Sarayu Ramachandran, MS (Mount Sinai School of Medicine) for support with data analysis.
Contract grant sponsor: National Institutes of Health; Contract grant numbers: NHLBI HL71021, NHLBI RO1 HL 78667, and NIBIB RO1 EB 009638 (to Z.A.F.); Contract grant sponsor: Founders Affiliate of the American Heart Association (postdoctoral fellowship to V.M.).
References
- 1.Fauci AS, Braunwald E, Kasper DL, et al. Epidemiology of cardiovascular disease. 17. Chapter 218. New York: McGraw-Hill; 2008. Harrison’s principles of internal medicine. [Google Scholar]
- 2.Lopez AD, Mathers CD, Ezzati M, Jamison DT, Murray CJ. Global and regional burden of disease and risk factors, 2001: systematic analysis of population health data. Lancet. 2006;367:1747–1757. doi: 10.1016/S0140-6736(06)68770-9. [DOI] [PubMed] [Google Scholar]
- 3.Hurks R, Peeters W, Derksen WJ, et al. Biobanks and the search for predictive biomarkers of local and systemic outcome in atherosclerotic disease. Thromb Haemost. 2009;101:48–54. [PubMed] [Google Scholar]
- 4.Davies MJ, Richardson PD, Woolf N, Katz DR, Mann J. Risk of thrombosis in human atherosclerotic plaques: role of extracellular lipid, macrophage, and smooth muscle cell content. Br Heart J. 1993;69:377–381. doi: 10.1136/hrt.69.5.377. [DOI] [PMC free article] [PubMed] [Google Scholar]
- 5.Moreno PR, Falk E, Palacios IF, Newell JB, Fuster V, Fallon JT. Macrophage infiltration in acute coronary syndromes. Implications for plaque rupture. Circulation. 1994;90:775–778. doi: 10.1161/01.cir.90.2.775. [DOI] [PubMed] [Google Scholar]
- 6.Kerwin W, Hooker A, Spilker M, et al. Quantitative magnetic resonance imaging analysis of neovasculature volume in carotid atherosclerotic plaque. Circulation. 2003;107:851–856. doi: 10.1161/01.cir.0000048145.52309.31. [DOI] [PubMed] [Google Scholar]
- 7.Kerwin WS, O’Brien KD, Ferguson MS, Polissar N, Hatsukami TS, Yuan C. Inflammation in carotid atherosclerotic plaque: a dynamic contrast-enhanced MR imaging study. Radiology. 2006;241:459–468. doi: 10.1148/radiol.2412051336. [DOI] [PMC free article] [PubMed] [Google Scholar]
- 8.Kerwin WS, Oikawa M, Yuan C, Jarvik GP, Hatsukami TS. MR imaging of adventitial vasa vasorum in carotid atherosclerosis. Magn Reson Med. 2008;59:507–514. doi: 10.1002/mrm.21532. [DOI] [PubMed] [Google Scholar]
- 9.Rudd JH, Davies JR, Weissberg PL. Imaging of atherosclerosis —can we predict plaque rupture? Trends Cardiovasc Med. 2005;15:17–24. doi: 10.1016/j.tcm.2004.12.001. [DOI] [PubMed] [Google Scholar]
- 10.Rudd JH, Warburton EA, Fryer TD, et al. Imaging atherosclerotic plaque inflammation with [18F]-fluorodeoxyglucose positron emission tomography. Circulation. 2002;105:2708–2711. doi: 10.1161/01.cir.0000020548.60110.76. [DOI] [PubMed] [Google Scholar]
- 11.Davies JR, Rudd JH, Weissberg PL. Molecular and metabolic imaging of atherosclerosis. J Nucl Med. 2004;45:1898–1907. [PubMed] [Google Scholar]
- 12.Davies JR, Rudd JH, Weissberg PL, Narula J. Radionuclide imaging for the detection of inflammation in vulnerable plaques. J Am Coll Cardiol. 2006;47(8 Suppl):C57–68. doi: 10.1016/j.jacc.2005.11.049. [DOI] [PubMed] [Google Scholar]
- 13.Zhang Z, Machac J, Helft G, et al. Non-invasive imaging of atherosclerotic plaque macrophage in a rabbit model with F-18 FDG PET: a histopathological correlation. BMC Nucl Med. 2006;6:3. doi: 10.1186/1471-2385-6-3. [DOI] [PMC free article] [PubMed] [Google Scholar]
- 14.Ogawa M, Magata Y, Kato T, et al. Application of 18F-FDG PET for monitoring the therapeutic effect of antiinflammatory drugs on stabilization of vulnerable atherosclerotic plaques. J Nucl Med. 2006;47:1845–1850. [PubMed] [Google Scholar]
- 15.Rudd JH, Myers KS, Bansilal S, et al. Atherosclerosis inflammation imaging with 18F-FDG PET: carotid, iliac, and femoral uptake reproducibility, quantification methods, and recommendations. J Nucl Med. 2008;49:871–878. doi: 10.2967/jnumed.107.050294. [DOI] [PubMed] [Google Scholar]
- 16.Calcagno C, Cornily JC, Hyafil F, et al. Detection of neovessels in atherosclerotic plaques of rabbits using dynamic contrast enhanced MRI and 18F-FDG PET. Arterioscler Thromb Vasc Biol. 2008;28:1311–1317. doi: 10.1161/ATVBAHA.108.166173. [DOI] [PMC free article] [PubMed] [Google Scholar]
- 17.Galbraith SM, Lodge MA, Taylor NJ, et al. Reproducibility of dynamic contrast-enhanced MRI in human muscle and tumours: comparison of quantitative and semi-quantitative analysis. NMR Biomed. 2002;15:132–142. doi: 10.1002/nbm.731. [DOI] [PubMed] [Google Scholar]
- 18.Padhani AR, Hayes C, Landau S, Leach MO. Reproducibility of quantitative dynamic MRI of normal human tissues. NMR Biomed. 2002;15:143–153. doi: 10.1002/nbm.732. [DOI] [PubMed] [Google Scholar]
- 19.Jackson A, Jayson GC, Li KL, et al. Reproducibility of quantitative dynamic contrast-enhanced MRI in newly presenting glioma. Br J Radiol. 2003;76:153–162. doi: 10.1259/bjr/70653746. [DOI] [PubMed] [Google Scholar]
- 20.Roberts C, Issa B, Stone A, Jackson A, Waterton JC, Parker GJ. Comparative study into the robustness of compartmental modeling and model-free analysis in DCE-MRI studies. J Magn Reson Imaging. 2006;23:554–563. doi: 10.1002/jmri.20529. [DOI] [PubMed] [Google Scholar]
- 21.Yankeelov TE, DeBusk LM, Billheimer DD, et al. Repeatability of a reference region model for analysis of murine DCE-MRI data at 7T. J Magn Reson Imaging. 2006;24:1140–1147. doi: 10.1002/jmri.20729. [DOI] [PubMed] [Google Scholar]
- 22.Rudd JH, Myers KS, Bansilal S, et al. (18)Fluorodeoxyglucose positron emission tomography imaging of atherosclerotic plaque inflammation is highly reproducible: implications for atherosclerosis therapy trials. J Am Coll Cardiol. 2007;50:892–896. doi: 10.1016/j.jacc.2007.05.024. [DOI] [PubMed] [Google Scholar]
- 23.Eliasziw M, Young SL, Woodbury MG, Fryday-Field K. Statistical methodology for the concurrent assessment of interrater and intrarater reliability: using goniometric measurements as an example. Phys Ther. 1994;74:777–788. doi: 10.1093/ptj/74.8.777. [DOI] [PubMed] [Google Scholar]
- 24.Saam T, Hatsukami TS, Yarnykh VL, et al. Reader and platform reproducibility for quantitative assessment of carotid atherosclerotic plaque using 1. 5T Siemens, Philips, and General Electric scanners. J Magn Reson Imaging. 2007;26:344–352. doi: 10.1002/jmri.21004. [DOI] [PubMed] [Google Scholar]
- 25.El Aidi H, Mani V, Weinshelbaum KB, et al. Cross-sectional, prospective study of MRI reproducibility in the assessment of plaque burden of the carotid arteries and aorta. Nat Clin Pract Cardiovasc Med. 2009;6:219–228. doi: 10.1038/ncpcardio1444. [DOI] [PMC free article] [PubMed] [Google Scholar]


