

Abstract
Hundreds of transcript isoforms with varying boundaries and alternative regulatory signals are transcribed from the genome, even in a genetically homogeneous population of cells. To study this transcriptional heterogeneity, we developed Transcript Isoform Sequencing (TIF-Seq), a method that allows the genome-wide profiling of full-length transcript isoforms defined by their exact 5′ and 3′ boundaries. TIF-Seq entails generating full-length cDNA libraries, followed by their circularization and the sequencing of the junction fragments spanning the 5′ and 3′ transcript ends. By determining the respective co-occurrence of start and end sites of individual transcript molecules, TIF-Seq can distinguish variations that conventional approaches for mapping single ends cannot, such as short abortive transcripts, bicistronic messages, and overlapping transcripts that differ in lengths. The TIF-Seq protocol we describe here can be applied to any eukaryotic organism (e.g., yeast, human) and requires 6-10 days to generate TIF-Seq libraries, 10 days for sequencing and 2-3 days for analysis.
Keywords: Transcript isoforms, UTR variation, ncRNAs, RNA-Seq, 5′CAP, alternative polyadenylation, next generation sequencing
Introduction
Genome-wide study of transcription has proven invaluable for understanding the mechanisms regulating gene expression and characterizing gene function. However most of our genome-wide knowledge is based on the study of changes in expression level (i.e., variations in mRNA abundance). Inferring function from expression abundance is based on the simplified assumption that each gene transcribes identical RNA molecules. In reality, one gene may express diverse transcript isoforms using alternative promoters, exons and terminators1. Transcription thus often generates alternative RNA molecules (i.e. isoforms) that differ in length and sequence from each gene. These transcripts can differ dramatically in their function, localization, and life cycle2-4. Genome-wide methods like DNA microarrays5 and RNA-Seq6 have been instrumental in characterizing eukaryotic RNA populations and novel transcript classes7,8. However, these methods only detect the cumulative signal of transcripts overlapping a given genomic region (because they either fragment the RNA, cDNA or probe for cumulative signal in specific regions); they cannot resolve the boundaries of individual RNA molecules. Methods analysing variation of either transcription start sites9,10 or polyadenylation sites11-14 have indicated considerable variability in transcript boundaries and suggested effects on RNA stability, translation or localization. These methods, however, cannot detect which start sites co-occur with which end sites, a property that determines the functional potential of each RNA molecule2.
This led us to develop the approach presented here, transcript isoform sequencing (TIF-Seq), which allows us to concurrently determine the start and end sites of individual RNA molecules within a sample and discriminate between overlapping molecules15. We have investigated transcript isoform variation in Saccharomyces cerevisiae using TIF-Seq, showing extensive transcript isoform diversity that affect messenger RNA stability, localization and translation, or generating truncated versions of proteins that differ in localization or function15. Similar approaches based on paired-end sequencing have been previously developed for the study of the transcriptome using Sanger sequencing16,17 and more recently have been also applied to next generation sequencing18,19. TIF-Seq, also based in next generation sequencing, avoids initial sample size selection and introduces intermediate amplification steps and molecular barcodes to limit molecular bottlenecks and thus increase sample complexity. This technology has enabled an unprecedented glimpse into the vast transcriptional diversity generated by a genome, with several functional implications, such as variability in mRNA stability, localization, or generation of truncated proteins15.
Overview of TIF-Seq
The TIF-Seq procedure can be conceptually divided into four main stages, each of which is described below.
RNA oligo-capping. The first step of the protocol consists of obtaining an RNA sample suitable for the generation of full-length cDNA (Procedure steps 1 to 26, and Fig. 1). There are multiple approaches that can be used to select for full-length RNA molecules. Common approaches include cap-trapping20, template switching (e.g., SMART)21 or oligo-capping methods22,23 (reviewed in 24). We selected the oligo-capping method23 because it does not entail removing the ribosomal RNA (rRNA) in a preceding step, and thus allows the use of rRNA integrity as a general indicator of RNA quality throughout the process (Fig. 2a). The oligo-capping method consists of the selective ligation of an oligo of known sequence to the previously capped RNA molecules. As a first step, total RNA is dephosphorylated to remove any existing 5′ phosphates (e.g., RNA degradation intermediates). After this step, a treatment with Tobacco Acid Pyrophosphatase (TAP) removes the 5′ cap structure and exposes the 5′ phosphate group necessary for subsequent single-stranded RNA ligation. These two steps are applied to ensure that any non-capped molecules are dephosphorylated prior to oligo ligation, and thus guarantee that only previously capped molecules are processed further. Although it is almost impossible to determine the exact number of non-capped RNA molecules present in our final dataset, if TIF-Seq analysis is focused on the 5′non-cap molecules (i.e., substituting the TAP treatment with a T4 PNK treatment15) the obtained profile with respect to the transcription start site is totally different. Additionally background rRNA contamination should be low (i.e., around 20% depending on the sequence mapping approach) and correspond mainly to polyadenylated rRNA degradation intermediates25. After TAP treatment, an oligo with known sequence is ligated to the 5′ end of the formerly capped RNA molecules. Previous studies have observed that the use of different oligos for single-stranded ligation can lead to significant differences between samples26. Thus, to be able to effectively compare different samples, we chose to avoid any early sample barcoding and use the same oligo for all samples. Additionally, to estimate the accuracy of our 5′ and 3′ end identification, we recommend that capped and polyadenylated in vitro synthesized transcripts be used as a ‘spike-in’ (Box 1).
Production of full-length cDNA. Once total RNA has been subjected to the oligo-capping protocol, barcoded full-length cDNA is generated by selectively amplifying RNA molecules with both a 5′ cap structure and a poly(A) tail (Procedure steps 28 to 41, and Fig. 1). For this procedure, each sample is subjected to reverse transcription and full-length cDNA generation. Notably, in order to control for subsequent intermolecular ligation, these reactions are carried out in duplicate (i.e., in two separate tubes) using different sets of oligos, producing equivalent full-length cDNA libraries that should differ only in their terminal barcodes (referred to here as chimera control barcodes A and B). This information will be used after the circularization step to estimate the percentage of intermolecular and intramolecular full-length cDNA ligations (similar to Fullwood et al. 18). RNA is subjected to retrotranscription (optimized to produce long cDNA molecules by increasing reaction time, temperature and using trehalose combined with an efficient enzyme) followed by a brief PCR amplification using the common sequences added during single stranded RNA ligation and reverse transcription. This initial amplification step is essential to maintain sample complexity (i.e., diversity of isoforms). In preliminary experiments, where the PCR amplification was omitted and the double-stranded cDNA was directly used in subsequent steps, the complexity of the sample was dramatically reduced: the same molecules were sequenced multiple times, producing artifactual homogeneity. This loss in complexity is likely due to a bottleneck in the number of RNA molecules that reach the final library stage, and can be addressed by performing intermediate sample amplification as described here. While excessive PCR amplification can also reduce molecular complexity27, a few PCR cycles has in our experience minimized sample loss and thus effectively enhanced molecular complexity, having enabled us to detect hundreds of thousands of isoforms per sample15. Another important consideration for TIF-Seq and similar methods (e.g., RNA-PET19) is the removal of PCR duplicates, as we expect multiple identical isoforms to be transcribed. We have found that the introduction of random barcodes as molecular identifiers (Fig. 1) during reverse transcription allows straightforward identification of PCR duplicates and estimation of library complexity. Specifically, the oligos used for reverse transcription (PET-3RT-A and PET-3RT-B, in table 1) contain 8 random nucleotides (i.e., 7 N (A, T, C, or G) and 1 V (A, C, or G)). Thus, during the data analysis each transcript will be identified by a specific 5′ and 3′ end and also by a particular random sequence (in green in Fig. 1). As this random sequence is introduced before any amplification step, those identified molecules with the same 5′ and 3′ ends, that contain also the same random barcode, can be discarded as PCR duplicates.
Intramolecular circularization. For circularizing full-length cDNA molecules, the independently barcoded samples are pooled, digested, and subjected to intramolecular ligation (Procedure steps 43 to 60 and Fig. 1). To increase ligation efficiency, we generate sticky ends by digesting the full-length cDNA sample with the NotI enzyme. To maximize the number of intramolecular ligations and minimize intermolecular ligations, we perform the ligation reaction at a low DNA concentration (1 ng μL-1 or less). The earlier introduction of chimera control barcodes during the full-length cDNA generation step will now allow the estimation of the percentage of circular molecules originating from intermolecular ligation. As true intramolecular ligations would result in either A-A or B-B barcode combinations, the combinations A-B or B-A in the final products can only arise due to intermolecular ligations. The expected occurrence of intermolecular events is therefore calculated as double the abundance of A-B and B-A reads present in the final library (since A-A and B-B combinations could also originate from intermolecular ligations at the same frequency as A-B and B-A). After cDNA circularization, any remaining linear DNA molecules are exonucleolytically degraded.
Sequencing library construction. To construct the final sequencing library (Procedure steps 61 to 109, and Fig. 1), the circularized full-length cDNA is sonicated and the junction fragments (which are biotinylated) are purified using magnetic beads. Once the biotinylated sample is bound to the beads, a standard Illumina library is constructed (or according to the sequencing platform used), including DNA blunt ending, dA addition and ligation of forked adaptors. In this case the library remains bound to the streptavidin beads during all steps. If multiple samples are to be run in the same sequencing lane (as we recommend), barcoded forked adaptors should be used during the library preparation (Table 1). After the enrichment PCR (step 99), it is very important to perform an accurate size selection step (Fig. 2B). This step is especially important because only a fraction of the sonicated molecules will contain fragments spanning the 5′ and 3′ ends, long enough to uniquely map to the genome and short enough for the sequencing read to identify the exact 5′ and 3′ transcript ends.
Figure 1. Detailed experimental workflow of TIF-Seq.

The protocol is composed of: (a) 5′RNA oligo-capping using a DNA/RNA oligo of known sequence (5RNAGsuI), (b) generation and PCR amplification of full-length cDNA, (c) intramolecular circularization after NotI digestion, and (d) purification of paired-end cDNA tags followed by generation of Illumina-compatible sequencing libraries. Individual steps are labeled in black and the structure of the final sequenced library is depicted in the bottom right side of panel d. CIP stands for Calf Intestinal Alkaline Phosphatase, TAP for Tobacco Acid Pyrophosphatase, and ssRNA for single-stranded RNA. Refer to the main text for specific details.
Figure 2. TIF-Seq quality controls and anticipated results.

(a) Example of good quality HS RNA Bioanalyzer of S. cerevisiae RNA after single stranded RNA ligation (step 27). rRNA peaks (e.g., 18S and 26S for S. cerevisiae) should be clearly visible, and the sample should not be enriched in short RNA molecules that could arise from RNA degradation. FU, stands for Fluorescence Units. (b) Example of eGel size selected TIF-Seq library analyzed using a High sensitivity DNA Bioanalyzer ready for sequencing (step107). A clear peak should be observed between 270 and 280 nt. Optimal TIF-Seq samples should not contain Illumina primer-dimmer band (usually located around 130 nt). (c) Example of aligned TIF-Seq reads visualized in IGV33 for S. cerevisiae (data from15). Each identified transcript is depicted by a line that connects the 5′ and 3′ end of each transcript isoforms, without any information regarding the internal splicing events. Transcripts are depicted in red (+ strand) and blue (- strand). The overall coverage of each strand is depicted by a grey box. Optimal sample should have high complexity (without a significant number of PCR duplicates).
BOX 1. Preparation of capped and polyadenylated in vitro transcript. TIMING 6 h.
The following protocol describes how to prepare a mix of in vitro transcripts (IVTs) that should be added to each sample to control for the quality of 5′ and 3′ exact nucleotide identification. In this case we use IVTs derived from B. subtilis (ATCC 87482 (pGIBS-LYS), ATCC 87483 (pGIBS-PHE) and ATCC 87484 (pGIBS-THR)) that contain a poly(A) encoded tail in their DNA template. But in general any polyadenylated IVT of known sequence that is subsequently capped can be used.
Generation of in vitro transcripts
-
Increase the volume of 200 ng of linearized DNA template to 22.5 μL with RNAse-free water, and set up the following 50 μL reaction:
Component Amount (μL) Final
Linearized DNA template (200ng) 22.5 Transcription Optimized 5x buffer 10 1x DTT (0.1M) 5 10 mM NTP mix (2.5 mM each) 10 0.5 mM T3 RNA polymerase (10 U μL-1) 2 0.4 U μL-1 RNasin Plus 0.5 -
Total 50
Incubate the in vitro transcription at 37°C for 2 hours.
Degrade the DNA template by adding 5.8 μL10x TURBO DNA-free buffer, 2 μL TURBO DNase (TURBO DNA free kit, Ambion) and incubating the sample at 37°C for 30 min.
Increase the volume of the sample to 200 μL with RNase-free water and transfer it to Phase Lock Gel Heavy tubes containing 200 μL Phenol:Chloroform:Isoamyl alcohol (25:24:1).
Shake the tubes vigorously and centrifuge at 10000 g in a standard benchtop microcentrifuge for 10 min at 4°C.
Transfer the upper aqueous layer to fresh, precooled 1.5 mL microtubes.
Precipitate the samples by adding 1/10 volume of 3 M NaOAc (pH 4,2) and 2.5 volumes of 96% ethanol. Mix and incubate for a minimum of 30 min at -20°C.
Centrifuge the tubes at 10000g in a standard benchtop microcentrifuge for 15 min at 4°C and remove the supernatant.
Wash the pellet with 200 μL of 80% (vol/vol) ethanol and spin 2 min at full speed.
Air-dry the pellet.
Resuspend in 50 μL RNase-free water and store the RNA at -80°C.
Determine the concentration of the IVTs using Qubit using the RNA HS Assay Kit (Invitrogen, Life technologies) and check their size by RNA Bioanalyzer (Agilent Technologies).
Pool IVTs at a molecular ratio 25 Lys:5 Phe:1Thr
Add 5′Cap to the IVTs
-
14
Denature 1 μg of pooled IVTs at 65°C for 5 min, and transfer the tube to ice.
-
15
Set up the following 20 μL reaction:
Component Amount (μL) Final
pooled IVTs (1μg) 14.5 capping buffer (10x) 2 1x GTP (10 mM) 1 0.5 mM SAM (2 mM freshly diluted from the 32mM stock) 1 0.1 mM Vaccinia Capping Enzyme (10 U μL-1) 1 0.5 U μL-1 RNasin Plus 0.5 -
Total 20
-
16
Incubate for 30 min at 37°C.
-
17
Phenol purify the sample and resuspend the sample at 50 ng μL-1. The resulting solution will be the 100x stock.
-
18
Aliquot the 100x stock (50 ng μL-1) and store indefinitely at -80°C . Prepare also smaller aliquots of the 1x stock (500 pg μL-1) that will be added to the total RNA samples.
END OF BOX 1
Table 1.
Used oligonucleotides.
| 5RNAGsuI | CACTCTrGrArGrCrArArUrArCrC |
| PET-3RT-A | ACATGTATAGCGGCCGCTAGANNNNNNNVTTTTTTTTTTTTTTTTVN |
| PET-3RT-B | ACATGTATAGCGGCCGCATCTNNNNNNNVTTTTTTTTTTTTTTTTVN |
| PET-5ABio | TATAGCGGCCGCAC[BtndT]GCACTCTGAGCAATACC |
| PET-5BBio | TATAGCGGCCGCTGA[BtndT]CACTCTGAGCAATACC |
| PET-5A | TATAGCGGCCGCACTGCACTCTGAGCAATACC |
| PET-5B | TATAGCGGCCGCTGATCACTCTGAGCAATACC |
| PET-3-A | ACATGTATAGCGGCCGCTAGA |
| PET-3-B | ACATGTATAGCGGCCGCATCT |
| Barcoded forked adaptors# | |
| mp1PE1 | [Phos]AGCGCTAGATCGGAAGAGCGGTTCAGCAGGAATGCCGAG |
| mp1PE2 | ACACTCTTTCCCTACACGACGCTCTTCCGATCTAGCGCT* T |
| mp5PE1 | [Phos]ACAGTGAGATCGGAAGAGCGGTTCAGCAGGAATGCCGAG |
| mp5PE2 | ACACTCTTTCCCTACACGACGCTCTTCCGATCTCACTGT* T |
| mp19PE1 | [Phos]CGGAATAGATCGGAAGAGCGGTTCAGCAGGAATGCCGAG |
| mp19PE2 | ACACTCTTTCCCTACACGACGCTCTTCCGATCTATTCCG* T |
| mp22PE1 | [Phos]CTATACAGATCGGAAGAGCGGTTCAGCAGGAATGCCGAG |
| mp22PE2 | ACACTCTTTCCCTACACGACGCTCTTCCGATCTGTATAG* T |
| mp34PE1 | [Phos]GGTAGCAGATCGGAAGAGCGGTTCAGCAGGAATGCCGAG |
| mp34PE2 | ACACTCTTTCCCTACACGACGCTCTTCCGATCTGCTACC* T |
| mp37PE1 | [Phos]GTTTCGAGATCGGAAGAGCGGTTCAGCAGGAATGCCGAG |
| mp37PE2 | ACACTCTTTCCCTACACGACGCTCTTCCGATCTCGAAAC* T |
All oligos are HPLC purified. [BtndT] refers to Biotin dT; [Phos] refers to 5′ Phosphorylation; bases precede by “r” refer to ribonucleotides;
refers to S-linkage between the two bases. Random barcodes are identified in bold, 3′ and 5′ chimera barcodes are underlined and NotI recognition sequence in italics. Sequences are represented in 5′ to 3′orientation.
Oligonucleotide sequences © 2006-2014 Illumina, Inc. All rights reserved.
Applications of TIF-Seq
The TIF-Seq method allows the unambiguous identification of transcript isoforms genome-wide by the concurrent sequencing of both 5′ and 3′ ends of individual mRNA molecules. It is designed for the identification of eukaryotic capped and polyadenylated RNA molecules. TIF-Seq does not yield information about internal splicing events that do not affect transcription start or termination sites. We have successfully applied it to RNA derived from budding yeast15, mouse and human (manuscripts in preparation), and it is likely to work in any other eukaryotic organisms. With modifications of the reactions involving the capture of 5′ and 3′ ends, TIF-Seq could be tailored to identify alternate populations of transcripts other than polyadenylated and capped RNA (e.g., bacterial mRNAs could be targeted by introducing an artificial poly(A) tail using E. coli Poly(A) Polymerase).
Limitations of TIF-Seq
RNA length bias
One of the main limitations of TIF-Seq, or any other paired-end or full-length cDNA sequencing approach15,17,19,28, is their bias towards the identification of short RNA molecules. This bias is also shared by newer sequencing technologies such as PacBio29. This has two main consequences: the lack of detection of very long transcripts and the fact that the abundance of short molecules would be overestimated in general. Thus, although the TIF-Seq method is well suited for comparing the relative abundance of a given isoform in different conditions, the relative abundance among different isoforms for each gene can be more easily estimated using size-independent methods such as 3′end mapping3,13,14. This is especially important for short cryptic RNAs, originating from internal transcription start sites, whose abundance is usually much lower when measured with size-independent 5′ end mapping (Pelechano et al. in preparation) than with the TIF-Seq approach. In other approaches that use full-length cDNA construction17,19, and aim to maximize the coverage for long RNAs, short molecules are often eliminated. We intentionally avoided initial size selection of full-length cDNA to allow for the detection of small overlapping RNAs (e.g., short coding RNAs, scRNAs15). If desired, however, the differential chimera barcoding during the full-length cDNA generation step can be exploited to simultaneously perform non-size-selected, and long-molecule-enriched protocols in parallel (as described at Procedure step 42). Thus TIF-Seq is a quantitative method when comparing the same isoform in two different conditions, but should not be used to compare expression levels among different transcripts.
Reverse transcriptase template switching
Although previous studies have used similar techniques to identify interchromosomal transcripts17,19, we found that most instances of interchromosomal transcripts arose from the apparent fusion of highly expressed families of transcripts with high sequence homology15. The presence of sequence homology between transcripts, along with the propensity of reverse transcriptase to perform template switching between homologous templates30, suggests that the most common origin of these apparently fused transcripts is artifactual. Thus TIF-Seq, and all methods involving reverse transcription (e.g., RNA-Seq), are technically limited in their ability to detect fused transcripts.
Number of usable reads
It is important to note that only a relatively small fraction of the reads produced by TIF-Seq will contain fragments at the 5′ and 3′ end long enough to map to the genome and short enough for the sequencing read to contain both the 5′ and 3′ transcript ends (e.g., from 5-10%). Thus the coverage level that can be obtained by TIF-Seq is significantly lower than the coverage typically obtained by other single-end-specific methods. In general we multiplex 2 to 3 S. cerevisiae samples per HiSeq 2000 lane (i.e., ∼50 Million raw reads per sample), although depending of the study purpose deeper sequencing could be advisable. In general sequencing depth should be between 5 to 10 times higher than for a standard RNA-Seq experiment. The use of longer sequencing reads (i.e., increasing from 100 to 150 bp) and/or libraries with larger fragments would likely increase the percentage of usable reads (i.e. up to two times more uniquely mapped reads in our preliminary experiments). It is therefore important to sequence sufficiently deeply, since the quantification of subtle differences in medium or low expression levels remains challenging when one has low counts31, especially if boundary clustering is not or only moderately used. When absolute quantification is the goal instead of charting transcriptomic architecture, TIF-Seq could be complemented with independent methods for 5′ or 3′ end mapping to increase the read coverage and thus improve its quantitative power17.
Frequency of NotI recognition site
A final possible limitation of this protocol is its use of the NotI enzyme during the generation of circularized cDNA molecules. NotI recognizes the sequence GCCGGCCGC, which is extremely rare in the AT-rich (61.7%) yeast genome, but its increased frequency in other organisms could decrease the number of TIFs detected for genes neighbouring or containing it. In theory, this problem could be addressed by selectively adding 5-methyl-dCTP during reverse transcription; however, alternative protocol variants including DNA hemi-methylation were not effective in our experience. Another solution would therefore be to select a different enzyme for genomes with a higher frequency of the NotI recognition sequence.
Analysis of cellular population
It is also important to note that TIF-Seq it is not a single-cell transcriptomics approach. Thus it cannot distinguish whether the detected transcript isoforms co-occur within the same cell or whether they are present in different subcellular populations.
Materials
Reagents
-
Total RNA as starting material (recommended concentration should be 2 μg μL-1 or higher).
CRITICAL: We routinely use of either phenol purified RNA from mid-log (OD600 0.5∼1) grown yeast cells15 or TRI Reagent extracted RNA from mammalian cells (Sigma-Aldrich, cat. no. T9424). However, in general any total RNA with good ribosomal RNA integrity (as checked by RNA Bioanalyzer, see Fig 2a) should be suitable for TIF-Seq.
RNase-free water (Ambion, cat. no. AM9937)
Turbo DNA-free kit (Invitrogen, cat. no. AM1907) including TURBO DNase enzyme, 10x TURBO DNase Buffer and DNase Inactivation Reagent
RNasin Plus RNase Inhibitor (40 U μL-1, Promega, cat. no. N2611)
Calf Intestinal Alkaline Phosphatase (10 U μL-1, NEB, cat. no. M0290S) supplied with 10x NEBuffer 3 (10x, NEB, cat. no. B7003S)
Light phase lock tubes 1.5 mL (5 Prime, cat. no. 2302800)
Heavy phase lock tubes 2 mL (5 Prime, cat. no. 2302830)
-
Water saturated phenol (not buffered) (AppliChem, cat. no. A0447)
! CAUTION Phenol is highly corrosive and can cause severe burns. Wear gloves, protective clothing, and safety glasses when handling phenol. All manipulations should be carried out in a chemical hood and dispose of waste in accordance with institutional regulations.
-
Phenol/chloroform/Isoamyl alcohol (25:24:1) (AppliChem, cat. no. A0889)
! CAUTION Phenol is highly corrosive and can cause severe burns. Wear gloves, protective clothing, and safety glasses when handling phenol. All manipulations should be carried out in a chemical hood and dispose of waste in accordance with institutional regulations.
-
Ethanol for analysis (96%), molecular biology grade (Merck, cat. no. 159010)
! CAUTION Ethanol is highly flammable and volatile.
-
Isopropanol, molecular biology grade (Merck, cat. no. 109634)
! CAUTION Isopropanol is highly flammable and volatile and is an irritant.
Sodium acetate buffer solution (3 M, pH 5.2, Sigma, cat. no. S7899)
Linear Acrylamide (5 mg ml-1, Invitrogen, cat. no. AM9520)
Tobacco Acid Pyrophosphatase (TAP) (10 U μL-1, Epicentre, cat. no. T19250) supplied with 10x TAP reaction buffer
-
T4 RNA Ligase 1 (ssRNA Ligase) (10 U μL-1, NEB, cat. no. M0204S) supplied with 10x T4 RNA ligase reaction buffer and Adenosine-5′-Triphosphate (ATP, 10 mM)
CRITICAL: Depending on the specific enzyme batch the ATP will be included or not in the reaction buffer. For a successful ligation is essential that an adequate amount of ATP is present in the final reaction.
Dimethyl sulfoxide (DMSO) (BioLabs, cat. no. B0515A)
Agencourt AMPure XP - PCR Purification (Beckman Coulter, cat. no. A63880)
SuperScript III Reverse Transcriptase (200 U μL-1, Invitrogen, cat. no. 18080-044) supplied with 0.1 M DTT and 5x first-strand buffer
Trehalose 1.57 M dissolved in water from solid (Sigma, cat. no. T3663)
RNase H (10 U μL-1, Epicenter, cat. no. R0601K)
RNase Cocktail (0.5U μL-1 RNase A and 20 U μL-1 RNase T1, Invitrogen, cat. no. AM2286)
Phusion High-Fidelity PCR Master Mix with HF Buffer (NEB, cat. no. M0531S)
Agarose (Sigma, cat. no. A9539)
TBE (for 1 L 10x solution mix 108 g Tris base (Trizma, Sigma, cat. no. T1503), 55 g boric acid (Merck, cat. no.100162), 960 ml water and 40 ml 0.5 M EDTA, pH 8.0. Autoclave and store at room temperature.
Non-migrating DNA gel loading buffer dye (15% (wt/vol) Ficoll 400, blue dextran, 5 mM EDTA)
QIAquick Gel Extraction Kit (Qiagen, cat. no. 28704) supplied with Elution Buffer (EB) (10 mM Tris-Cl, pH 8.5, Qiagen, cat. no. 19086)
NotI restriction enzyme (10 U μL-1, NEB, cat. no. R0189S) supplied with 10x NEBuffer 3(10x, NEB, cat. no. B7003S). Note that the new NotI-HF (20 U μL-1, NEB, cat. no. R3189S) can also be used.
T4 DNA ligase (NEB, 2000 U μL-1, cat. no. M0202T) supplied with 10x T4 DNA Ligase Reaction Buffer
BSA, Molecular Biology Grade (20 mg mL-1, NEB, cat. no. B9000S)
Plasmid-Safe ATP-Dependent DNase (10 U μL-1, Epicentre, cat. no. E3101K)
microTUBE AFA Fiber Pre-Slit Snap-Cap 6×16mm (Covaris, cat. no. 520045)
Dynabeads M-280 streptavidin (Invitrogen, cat. no. 11205D)
Bind and Wash buffer (B&W) (for a 2x concentration: 10 mM Tris-Cl pH 7.5, 1 mM EDTA pH 8.0 and 2 M NaCl in water)
NEBNext End Repair Module (NEB, cat. no. E6050S) including NEBNext End Repair Enzyme Mix and 10x NEBNext End Repair Reaction Buffer
Klenow Fragment (3′→5′ exo-) (NEB, 5 U μL-1, cat. no. M0212S) supplied with 10x NEBuffer 2 (10x, NEB, cat. no. B7002S)
dA tailing buffer (NEBuffer 2 (NEB, cat. no. B7002S) supplemented with 2 mM dATP)
dATP 100 mM (BioLabs, cat. no. N0440S)
dNTP mix 10 mM (BioLabs, cat no. N0447L)
Quick Ligation Kit (NEB, cat. no. M2200S) including 2x Quick Ligation Buffer and Quick T4 DNA Ligase
IVT spike-ins derived from B. subtilis (ATCC cat. no. 87482, 87483 and 87484). See Box 1 for detailed description of their preparation.
T3 RNA polymerase (Promega, 10 U μL-1, cat. no. P2083) including DTT (100 mM, cat. no. P117B) and Transcription Optimized 5x buffer (cat. no. P118B)
Vaccinia Capping System (NEB, 10 U μL-1, cat. no. M2080S) supplied with 10x Capping Buffer, S-adenosylmethionine (SAM, 32 mM) and GTP (10 mM)
-
Agilent High Sensitivity DNA Kit (Agilent, cat. no. 5067-4626)
CRITICAL: It should be taken out of the fridge in advance to reach room temperature (20-25°C) before its use.
-
Agilent RNA 6000 Nano Kit (Agilent, cat. no. 5067-1511)
CRITICAL: It should be taken out of the fridge in advance to reach room temperature (20-25°C) before its use.
dsDNA HS Assay kit for Qubit 2.0 (Life technologies, cat. no. Q32854)
RNA HS Assay kit for Qubit 2.0 (Life technologies, cat. no. Q32852)
Equipment
-
Refrigerated benchtop centrifuge (Eppendorf, cat. no. 5417R)
CRITICAL: It should be switched on in advance to ensure it has reached 4°C before its use.
Themocycler DNA engine tetrad 2 (Bio-Rad)
Thermomixer Confort (Eppendorf)
2100 Bioanalyzer (Agilent, cat. no. G2939AA)
Qubit 2.0 fluorometer (Life technologies)
-
S220 Focused-ultrasonicator (Covaris)
CRITICAL: It should be switched on in advance to ensure it has reached 4°C before its use.
DynaMag-2 Magnet (Life Sciences, cat. no. 12321D) or homemade stand for neodymium magnets32.
Test tube rotator (Snijders, cat. no. 34528)
Procedure
CRITICAL Keep samples on ice and handle samples with gloves. In steps where the handled volume is below 200 μL we recommend to use 0.2 mL PCR 8-strips. The incubations can be performed in a thermomix or thermocycler machine depending on the tube size. For incubations above room temperature (i.e., 20-25°C) a heated lid should always be used. Between 6 to 12 TIF-Seq library preparations can be handled in parallel by one person.
Preparation of DNA-free RNA. TIMING 45 min
-
Starting with 60 μg total RNA prepare the following mix and incubate samples for 20 min at 37°C.
Component Amount (μL) Final
60 μg total RNA 35 1.2 μg μL-1 Capped IVT controls (1x, 500 pg μL-1, see Box 1) 6 10 pg μL-1 Turbo DNase buffer 10x 5 1x Turbo DNase enzyme (2 U μL-1) 3 6 U RNasin plus 1
Total 50
CRITICAL STEP: The addition of capped and polyadenylated IVTs (Box1) is critical for quality control of the whole process, allowing experimental artifacts to be eliminated. The information obtained from the IVTs will be used to assess the technical precision of the 5′ and 3′ end mapping, rather than their respective amount (as IVT read counts will be also influenced by their different length, please see “Limitations” section).
CRITICAL STEP: In all steps involving RNA manipulation is critical to work in a RNase-free environment, use gloves and maintain the samples on ice when possible.
CRITICAL STEP: We have successfully produced TIF-Seq libraries starting from as little as 10 μg of total RNA. Potentially this amount could be further decreased as long as a complex full-length cDNA library is obtained. In a similar protocol based also on RNA ligation where only the 5′ end is captured we have successfully decreased the required starting amount to 500 ng total RNA (Pelechano et al. in preparation). However to successfully decrease the starting RNA amount it would be required to further improve the efficiency of RNA ligation and full length cDNA reverse transcription.
Add 6 μl DNase inactivation reagent (Invitrogen) and flick the tubes. Incubate 2-3 min at room temperature.
-
Centrifuge the tubes at 16,000 g at room temperature for 2 min and recover the supernatant. CRITICAL STEP: It is important to keep a small aliquot (e.g., 0.5 μL) of every step involving RNA manipulation to check the RNA integrity in an agarose or Bioanalyzer RNA gel after the specific manipulation. Once the protocol has been performed successfully several times controls could be restricted to the quality control of initial RNA and after single stranded RNA ligation (step 26).
? TROUBLESHOOTING
Phosphatase treatment. TIMING 4 h
-
4
Remove the 5′P of fragmented and non-capped (5′PPP) molecules by setting up the following 100 μl reaction in a 1.5 mL tube:
Component Amount (μL) Final
DNase treated RNA sample 50 - RNase-free water 36 - NEBuffer 3 (10x) 10 1x CIP (Calf Intestinal Alkaline Phosphatase, 10 U μL-1) 3 30 U RNasin plus 1 -
Total 100
-
5
Incubate the sample for 30 min at 37°C.
-
6
To remove the phosphatase, increase the sample volume with RNase-free water to 150 μL and transfer to a light phase lock tube (1.5 mL) containing 150 μL of water-saturated phenol. Mix the phases by flicking the tube and separate them by 3 min centrifugation at 10,000 g at room temperature.
-
7
Transfer the aqueous phase to a new light phase lock tube (1.5 mL) containing 150 μL of water-saturated phenol to perform a second extraction. Mix the phases by flicking the tube and separate them by 3 min centrifugation at 10,000 g at room temperature.
CRITICAL STEP: We perform a double phenol extraction to make sure no phosphatase activity remains in the sample, as it could interfere with downstream steps.
-
8
Using light phase lock tubes (1.5 mL) perform one extraction using an equal volume of Phenol:Chloroform:Isoamyl alcohol 24:25:1 (150 μL). Mix the phases by flicking the tube and separate them by 3 min centrifugation at 10,000 g at room temperature.
-
9
Ethanol precipitate the aqueous phase by adding 2.5 volumes (with respect to the sample volume) of 100% ethanol, 1/10 volume of 3 M NaOAc and 1 μL linear Acrylamide (5 mg mL-1). Mix and incubate at -20°C for a minimum of 20 min.
PAUSE POINT: The RNA precipitation maybe left overnight at -20°C
-
10
Precipitate the sample by 30 min centrifugation at 14,000 g and 4°C.
-
11
Wash the pellet with 300 μL ice-cold ethanol 70% (vol/vol).
-
12
Centrifuge the sample for 10 min at 14,000 g and 4°C.
-
13
Remove the remaining ethanol and resuspend the pellet in 16.3 μl RNase-free water.
CRITICAL STEP: In this and all subsequent nucleic acid precipitation steps any excess of ethanol should be removed before resuspending the sample in water. However excessive drying of the pellet should also be avoided as it will make the pellet difficult to resuspend.
5′ Cap removal. TIMING 4h
-
14
Remove the 5′CAP of phosphatase-treated RNA molecules by setting up the following 20 μl reaction in a 1.5 mL tube:
Component Amount (μL) Final
Phosphatase treated sample 16.3 - TAP reaction buffer (10x) 2 1x DTT (0.1 M) 0.2 1 mM Tobacco Acid Pyrophosphatase (TAP, 10 U μl-1) 0.5 5 U RNasin plus 1 -
Total 20
-
15
Incubate the sample for 1 h at 37°C.
-
16
To remove the TAP enzyme increase the sample volume with RNase-free water to 150 μL and transfer to a light phase lock tubes (1.5 mL) containing 150 μL of Phenol:Chloroform:Isoamyl alcohol 24:25:1. Mix the phases by flicking the tube and separate them by 3 min centrifugation at 10,000 g at room temperature.
-
17
Ethanol precipitate the aqueous phase by adding 2.5 volumes (with respect to the sample volume) of 100% ethanol, 1/10 volume of 3 M NaOAc and 1 μL linear Acrylamide (5 mg mL-1). Mix and incubate on ice for a minimum 20 min.
PAUSE POINT: The precipitation maybe left overnight at -20°C.
-
18
Precipitate the sample by 30 min centrifugation at 14,000 g and 4°C.
-
19
Wash the pellet with 300 μL ice-cold ethanol 70% (vol/vol).
-
20
Centrifuge the sample for 10 min at 14,000 g and 4°C.
-
21
Remove the remaining ethanol and resuspend the pellet in 4.5 μl H2O.
Single stranded RNA ligation. TIMING 18 h
-
22
Set up the following 10 μL ligation reaction and incubate overnight (16 h) at 16 °C:
Component Amount (μL) Final
TAP treated sample 4.5 100 mM DNA/RNA oligo 5RNAGsuI 1 10 mM buffer T4 RNA Ligase 1 (10x, containing 10 mM ATP) 1 1x T4 RNA Ligase 1 (10 U μl-1) 2 20 U DMSO 1 10% (vol/vol) RNasin plus 0.5 -
Total 10
CRITICAL STEP: The addition of PEG supplied with the T4 RNA Ligase 1 will produce RNA precipitation during the ligation at 16°C. If PEG is used the ligation might be performed at higher temperature for shorter time (e.g., 2 h at 25°C). However we routinely prefer the use of longer incubations at 16°C and therefore omit PEG from the reaction.
CRITICAL STEP: The single stranded RNA ligation is a relatively inefficient step. Use always DNA/RNA oligos where at least the last 8 bases are rNTPs. We prefer the use of a single oligo for all the samples rather than the use of barcoded oligos (e.g., for early multiplexing) as the latter may introduce biases between libraries during the ligation step26.
-
23
Purify the sample using 1.8x volumes of Ampure XP beads according to manufacturer's instructions and as outlined here in steps 23-24. Add 18 μL Ampure XP beads and mix the sample by pipetting up and down. Let the sample bind the beads by incubating at room temperature (i.e., 20-25°C) for 5 min.
CRITICAL STEP: All volumes of Ampure XP beads refer to bead slurry as described by the manufacturer.
-
24
Place the 0.2 mL tubes in the magnet and let the beads settle (∼2 min). Remove supernatant and perform 2 consecutive washes with 200 μL of ethanol 70% (vol/vol).
CRITICAL STEP: Please note that as described by the manufacturer ethanol washes of Ampure XP beads should be always performed on the magnet without re-suspending the beads.
-
25
Remove ethanol and allow the beads to slightly dry for 1 minute. Elute in 25 μL RNase-free water. Retain a 1 μL aliquot for quality control.
PAUSE POINT: The eluted sample may be stored for weeks at -80°C.
-
26
It is extremely important to confirm that the integrity of the RNA sample was maintained during the enzymatic treatment of the RNA. Run an Agilent RNA Bioanalyzer comparing the input (aliquot from total RNA steps 1) and ligated RNA sample (from step 25). If significant degradation is observed (e.g., more intense 18S than 26S or an excess of short length RNAs), discard the sample. See Fig. 2A for an example.
? TROUBLESHOOTING
Reverse transcription. TIMING 2.5 h
-
27
Split each ligated RNA sample into 2 independent 0.2 mL tubes (tube 1 and 2) with 10 μL sample in each and proceed in parallel; these tubes will be processed in parallel until the circularization of the full-length cDNA (step 43), when the contents will be combined.
CRITICAL STEP: Splitting the samples in two is necessary to control for intramolecular versus intermolecular ligations. Detailed explanation of the motivation can be found in the Experimental design section.
-
28
Set up the following 12 μL reaction:
Component Amount (μL) Final
Total ligated RNA 10 - PET-3RT oligo (1 μM) (Tube A only) or PET-3RT-B (1 μM) (Tube B only) 1 83 nM dNTPs (10 mM) 1 0.83 mM
Total 12
CRITICAL STEP: Use oligo PET-3RT-A for tube 1 and PET-3RT-B for tube 2. Those oligos contain specific barcode sequences that will be used to control for intermolecular ligations events.
-
29
Denature the samples at 65°C for 5 min. Afterwards place the samples on ice.
-
30
To each tube add 11 μl of mixture containing:
Component Amount (μL) Final
First Strand Buffer (5x) 5 1.08x DTT (100 mM) 2 8.7 mM Trehalose (1.57 M) 3 205 mM RNasin plus 1 -
Total 11
CRITICAL STEP: Do not add Actinomycin D as it will prevent the reverse transcription of the DNA part of the 5RNAGsuI oligo. In this protocol, strand specificity is maintained by the relative orientation of oligos that are specifically added to the 5′ and 3′ mRNA side.
-
31
Mix sample and incubate 2 min at 42°C.
While in the PCR machine add 2 μl SuperScript III reverse transcriptase (Invitrogen) to each sample. Incubate the sample at: 42°C for 50 min; at 50°C for 30 min; 55°C for 30 min; and inactivate at 70°C for 15 min. Hold samples at 4°C.
CRITICAL STEP: One of the limiting steps of TIF-seq and any other protocol requiring the generation of full-length cDNA molecules15,17,19,28,29 is the efficient production of long cDNAs. Any modification improving this step will further contribute to the overall method efficiency.
-
32
Remove the template RNA and excess of rRNA by adding 1 μL of the following mix and incubation at 37 °C for 30 minutes.
Component Amount (μL) Final
RNase H (5 U μL-1) 0.5 2.5 U RNase cocktail 0.5 -
Total 1
-
33
Purify the sample using 2x volumes of Ampure XP beads according to manufacturer's instructions. Add 2x volumes Ampure XP beads and mix the sample by pipetting up and down. Let the sample bind the beads by incubating at room temperature for 5 min.
-
34
Place the 0.2 mL tubes in the magnet and let the beads settle (∼2 min). Remove supernatant and perform 2 consecutive washes with 200 μL of ethanol 70% (vol/vol).
-
35
Remove ethanol and allow to slightly dry for 1 minute. Elute in 20 μL water or EB buffer (10 mM Tris-HCl pH 8.0).
Generate second strand by PCR. TIMING 2.5 h
-
36
Perform 2 independent 25 μL PCR reactions (tube 1 and tube 2) using as template 5 μL of each reverse transcription sample and keep the remaining full-length cDNA sample as back-up stored at -20°C. Set up the following 25 μL reaction.
Component Amount (μL) Final
cDNA template 5 Water 18 - Phusion High-Fidelity PCR Master-Mix (2x) 25 1x forward oligo (5 μM) ( PET-5ABio for tube 1 or PET-5BBio for tube 2) 1 0.1 μM reverse oligo (5 μM) ( PET-3A for tube 1 and PET-3B for tube 2) 1 0.1 μM
Total 25
CRITICAL STEP: Tube 1 should contain primer pair PET-5ABio/PET-3A and Tube 2 should contain primer pair PET-5BBio/PET-3B . The different primer pairs contain specific barcode sequences that will be used to control for intermolecular ligations events. By performing the reactions in two different tubes we make sure that only two specific combinations of barcoded full-length cDNA molecules are being produced (i.e., PET-5ABio/PET-3A and PET-5BBio/PET-3B).
-
37
Run a PCR with the following cycling conditions and then hold the samples at 4°C.
Cycle number Denature Anneal Extend
1 98°C, 30 s 2-11 98°C, 20 s 50°C, 30 s (adding 1°C/cycle) 72°C, 5 min (adding 10 sec / cycle) 12 72°C, 5 min -
38
Pool the samples from tubes 1 and 2 and purify them using 1.8x volumes of Ampure XP beads according to manufacturer's instructions. Add 180 μL Ampure XP beads and mix the sample by pipetting up and down. Let the sample bind the beads by incubating at room temperature for 5 min.
-
39
Place the 0.2 mL tubes in the magnet and let the beads settle (∼2 min). Remove supernatant and perform 2 consecutive washes with 200 μL of ethanol 70% (vol/vol).
-
40
Remove ethanol and let slightly dry for 1 minute. Elute in 13 μL EB buffer (10 mM Tris-HCl pH 8.0).
-
41
Quantify produced full-length cDNA by QuBit using the dsDNA HS Assay Kit. Usually around 300 ng of full-length cDNA is obtained.
CRITICAL STEP: Although TIF-Seq can be performed without any PCR amplification of the full-length DNA, the skipping of the PCR amplification will lead to a molecular bottleneck that will decrease sample complexity and thus artifactually produce an apparently homogeneous population. Only a small amount of the mRNAs will produce full-length cDNA (1st molecular bottleneck), and subsequently only a small amount of it will be circularized and produce a final library (2nd molecular bottleneck). By introducing an amplification step (PCR) between those two bottlenecks we avoid the number of molecules becoming too low, which would consequently lead to a big loss of library complexity. Additionally as we are including a random barcode during the RT step it will be possible to correct for any PCR duplicates produced during this step.
PAUSE POINT: The sample may be stored for months at -20°C.
(Optional) Size selection. TIMING 4 h
-
42
If required, enrich the TIF-Seq libraries for longer mRNA molecules (e.g., >2Kb) by performing gel-based size selection as described in Box 2.and Fig. 3.
BOX 2. Optional size selection to enrich for longer mRNAs. TIMING 4h.
To enrich the TIF-Seq libraries for longer mRNA molecules (e.g., >2Kb), it is possible to perform gel-based size selection followed by a second PCR amplification. This can be done for both tube 1 and 2 or only for one of the barcoded fractions of full-length cDNA (e.g., tube2). In general, to avoid losing the population of short RNAs (e.g., scRNAs15) we recommend performing the size selection for only one of the fractions (i.e., tube2). In this case, the initial PCR amplification of the full-length cDNA molecules at step 36 of the main Procedure can be performed with the non-biotinylated version of the oligos (e.g., PET-5A or PET-5B); the biotin can be introduced in the second PCR (step 5 of this Box).
Run the full-length cDNA sample on a 1.5% (wt/vol) agarose 1xTBE gel.
-
Using a clean scalpel, excise a gel fragment corresponding to high molecular weight cDNAs (longer than 1.5-2 Kb); it is useful to use the xylene cyanol band of the loading buffer dye as a reference. (see Fig. 3).
CRITICAL STEP: To minimize full-length cDNA fragmentation, do not irradiate the gel with UV until the DNA sample is removed.
Extract DNA using Qiagen MinElute gel extraction kit according to the manufacturer's instructions.
Elute sample from the column in 15 μL EB. Keep 10 μL as a backup at -20°C and use the remaining 5 μL for the second PCR amplification.
-
Set up the following 25 μL reaction:
Component Amount (μL) Final
Template 5 Water 18 Phusion High-Fidelity PCR Master-Mix (2x) 25 1x forward oligo (5 μM; PET-5ABio for tube 1 or PET-5BBio for tube 2) 1 0.1 μM reverse oligo (5 μM; PET-3A for tube 1 or PET-3B for tube 2) 1 0.1 μM
Total 25
-
Run a PCR with the following cycling conditions and then hold the samples at 4°C.
Cycle number Denature Anneal Extend
1 98°C, 30 s 2-11 98°C, 20 s 60°C, 30 s 72°C, 5 min (adding 10 sec / cycle) 12 72°C, 5 min
Purify the sample using 1.8x volumes of Ampure XP beads according to manufacturer's instructions. Add 90 μL Ampure XP beads and mix the sample by pipetting up and down. Let the sample bind the beads by incubating at room temperature for 5 min.
Place the 0.2 mL tubes in the magnet and let the beads settle (∼2 min). Remove supernatant and perform 2 consecutive washes with 200 μL of ethanol 70% (vol/vol).
Remove ethanol and let slightly dry for 1 minute. Elute in 13 μL EB buffer (10 mM Tris-HCl pH 8.0).
-
Quantify produced size-selected full-length cDNA by QuBit using the dsDNA HS Assay Kit. Usually around 300 ng of full-length cDNA is obtained.
CRITICAL STEP: It is advisable to check the sizes of the produced full-length cDNA molecules (both initial and gel-size selected) by High sensitivity DNA Bioanalyzer (Agilent).
END OF BOX 2
Figure 3. Gel size-selection of long Full-length cDNA.
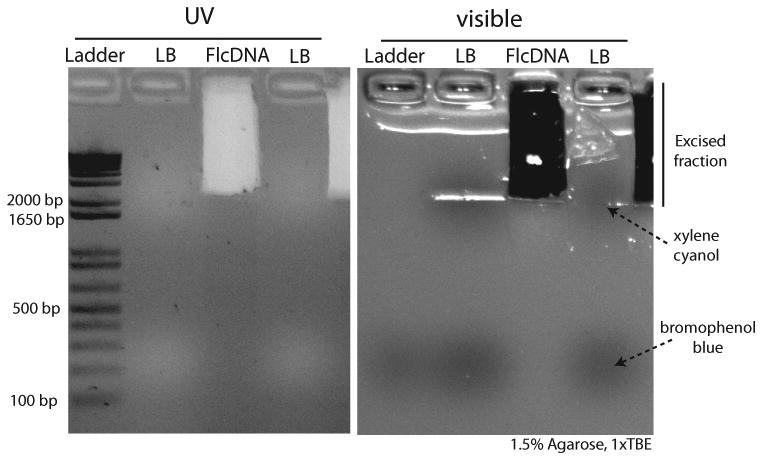
The same agarose gel is shown under UV stained with SYBR Safe and visible light (left and right respectively). Ladder stands for the 1kb plus DNA ladder (Life Technologies; cat. no. 10787-018), LB, for gel loading buffer (containing xylene cyanol and bromophenol blue), and FlcDNA for the purified Full-length cDNA. At least one empty well is left between samples. The recommended fraction to be excised is indicated.
Produce sticky ends. TIMING 1.5 h
-
43
Combine approximately 300ng of full-length cDNA from tube 1 and tube 2 containing different chimera barcodes in a volume lower than 16 μL
CRITICAL STEP: If size selection has been performed (Box 2) for any of the full-length samples it is possible to mix them in a ratio different that 1:1. For example combining 200 ng of non size-selected full-length cDNA (putatively shorter) with 300 ng size-selected (long) full-length cDNA.
-
44
Increase full-length cDNA sample volume to 15.8 μL with water and set up the following 20 μL reaction.
Component Amount (μL) Final
Full-length cDNA sample 15.8 NEBuffer 3 (10x) 2 1x 0.2 μL BSA (20 mg mL-1) 0.2 200 μg mL-1 NotI enzyme (10 U μL-1) 2 0.1 μM
Total 20
CRITICAL STEP: NotI enzyme will also cut any molecules where its recognition sequence (“GCCGGCCGC”) is present. Bioinformatic analysis of the genome of interest should be performed to ensure that the digestion would not deplete a specific gene of interest.
-
45
Incubate sample 1 h at 37°C in a thermocycler block with heated lid.
-
46
Inactivate the sample by incubating it at 65°C during 20 min, and add 30 μL water.
-
47
Purify the sample using 1.8x volumes of Ampure XP beads according to manufacturer's instructions. Add 90 μL Ampure XP beads and mix the sample by pipetting up and down. Let the sample bind the beads by incubating at room temperature for 5 min.
-
48
Place the 0.2 mL tubes in the magnet and let the beads settle (∼2 min). Remove supernatant and perform 2 consecutive washes with 200 μL of ethanol 70% (vol/vol).
-
49
Remove ethanol and let slightly dry for 1 minute. Elute in 50 μL EB buffer (10 mM Tris-HCl pH 8.0).
Circularize full-length cDNA. TIMING 19h
-
50
Set up the following 600 μL reaction.
Component Amount (μL) Final
sticky-ends full-length cDNA 50 1 ng μL -1 or less water 470 T4 DNA ligase buffer (10x) 60 1x T4 DNA ligase (2000 U μL-1) 20 66.6 U μL -1
Total 600
-
51
Incubate sample over night at 16°C (minimum of 16 hours).
CRITICAL STEP: To minimize the appearance of chimeric molecules the final concentration of full-length cDNA in the sample should be equal to or less than 1 ng μL-1. As the circularization process is not very efficient, as much full-length cDNA as possible should be used - preferentially 600 ng or more, but not less than 300 ng. Lowering the concentration of T4 DNA ligase used can decrease the efficiency of the process. In our previous experiments15, once corrected by maximum insert size to 5 kb and mapping of both ends to the same chromosome, we obtained around 0.19% intermolecular ligation events (or around 4% before any bioinformatic filtering, Fig S4 in15).
-
52
Incubate the samples 5 min at room temperature to close any remaining DNA nicks in the circularized full-length cDNA.
-
53
Treat samples with Plasmid safe to remove any remaining non circularized full-length cDNA. Add 0.2 μL Plasmid safe for each 100 μL of the ligation reaction (e.g., 1.2 μL for the 600 μL ligation reaction tube).
-
54
Incubate sample 30 min at 37°C and then inactivate by incubating 30 min at 70°C.
-
55
Remove the enzyme by phenol chloroform extraction. To 2 mL heavy phase lock tubes, add equal volumes of sample and Phenol:Chloroform:Isoamyl alcohol 25:24:1 (600 μL each). Mix the phases by flicking the tube and separate them by 5 min centrifugation at 10,000 g.
-
56
Isopropanol precipitate the sample adding 0.7 volumes (with respect to the sample volume) of 100% Isopropanol, 1/10 volume of 3 M NaOAc and 1 μL linear Acrylamide. Mix and incubate at 4°C a minimum of 20 min.
PAUSE POINT: The precipitation maybe left overnight at -20°C.
-
57
Precipitate the sample by 30 min centrifugation at 14,000 g and 4°C.
-
58
Wash the pellet with 300 μL ice-cold ethanol 70% (vol/vol).
-
59
Centrifuge the sample for 10 min at 14,000 g and 4°C.
-
60
Remove the remaining ethanol and resuspend the pellet in 130 μl water (or 10 mM TrisHCl, pH 8 as recommend by Covaris)
Sonicate circularized DNA. TIMING 1.5 h
-
61
Transfer the sample to Covaris microTUBE 6×16mm.
-
62
Sonicate the circularized DNA using Covaris with the following conditions: 4°C, Duty Factor 10%, Intensity 5, 200 cycles/burst and 180 seconds.
-
63
Purify the sample using 1.8x volumes of Ampure XP beads according to manufacturer's instructions. Add 18 μL Ampure XP beads and mix the sample by pipetting up and down. Let the sample bind the beads by incubating at room temperature for 5 min.
CRITICAL STEP: Ampure purification is essential to remove from the sample biotinylated fragments that are too short to be informative (i.e., shorter than 100 bp).
-
64
Place the 1.5 mL tubes in the magnet and let the beads settle (∼2 min). Remove supernatant and perform 2 consecutive washes with 200 μL of ethanol 70% (vol/vol).
-
65
Remove ethanol and let slightly dry for 1 minute. Elute in 20 μL EB and transfer to a 0.2 mL tube.
-
66
Check concentration by Qubit fluorometer using the dsDNA HS Assay Kit (optimally should be ∼10 ng per sample).
CRITICAL STEP: Do not stop the sample preparation after sonication, but proceed immediately to the next step.
CRITICAL STEP: Sonication seems to fragment more frequently in the polyA tail region, thus the relative AT content of the genome could affect the specific fragmentation.
Bind samples to streptavidin beads. TIMING 1 h
-
67
Prepare M-280 streptavidin beads (Invitrogen) according to manufacturer instructions and as described in steps 67-69. First, transfer 20 μL beads into a 0.2 mL tube.
-
68
Place the 0.2 mL tubes in the magnet and let the beads settle (∼2 min). Remove supernatant and perform 2 consecutive washes with 200 μL of Bind and Wash buffer 1x.
-
69
Resuspend the beads in 20 μL Bind and Wash buffer 2x (10 mM Tris-Cl pH 7.5, 1 mM EDTA pH 8.0 and 2 M NaCl)
-
70
Add to the beads 20 μL of sonicated circularized full-length cDNA (from step 65) and let the samples bind by incubating the beads in a rotator wheel for 30 min at room temperature. Please note that the wheel rotation will not mix the 40 μL bead solution, but rather prevent the beads from settling down.
-
71
Place the 0.2 mL tubes in the magnet and let the beads settle (∼2 min). Remove supernatant.
-
72
Perform 4 consecutive washes with 200 μL of Bind and Wash buffer 1x
-
73
Perform 1 wash with 200 μL of EB.
-
74
Resuspend the beads in 20.75 μL water.
CRITICAL STEP: At this point the samples of interest remain bound to the beads due to the streptavidin-biotin interaction.
End repair DNA fragments. TIMING 45 min
-
75
Set up the following 25 μL reaction:
Component Amount (μL) Final
Sample beads 20.75 NEBNext End repair buffer (10x) 2.5 1x End repair enzyme mix 1.25 1x
Total Approx. 25
-
76
Incubate sample for 30 min at 20°C in a PCR block.
-
77
Place the 0.2 mL tubes in the magnet and let the beads settle (∼2 min). Remove supernatant.
-
78
Perform washes with 200 μL of Bind and Wash buffer 1x.
-
79
Perform 1 wash with 200 μL of EB.
-
80
Resuspend the beads in 20.5 μL water.
Add a protruding Adenine to the DNA fragments. TIMING 45 min
-
81
Set up the following 25 μL reaction:
Component Amount (μL) Final
Sample beads 20.5 dA tailing buffer (10x) 2.5 1x Klenow fragment exo- (5 U μL-1) 1. 5
Total Aprox. 25
-
82
Incubate sample for 30 min at 37°C in a PCR block.
-
83
Place the 0.2 mL tubes in the magnet and let the beads settle (∼2 min). Remove supernatant.
-
84
Perform 1 wash with 200 μL of Bind and Wash buffer 1x.
-
85
Perform 1 wash with 200 μL of EB.
-
86
Resuspend the beads in 20 μL water.
Ligation of barcoded Illumina adaptors. TIMING 1.5 h
-
87
Set up the following 25 μL reaction:
Component Amount (μL) Final
Sample beads 20.5 Quick ligation Buffer (2x) 25 1x Barcoded linkers (1 μM) 0.5 10 pM T4 DNA ligase (2000 U μL-1) 3 120 U μL-1
Total Approx. 50
CRITICAL STEP: To minimize the production of primer dimers in subsequent steps it is critical to keep the concentration of linkers as low as possible. If low amount of sample is expected the concentration of linker should be decreased to minimize primer dimer generation.
CRITICAL STEP: If no multiplexing is to be performed and only one sample is going to be sequenced per lane, standard non-barcoded oligos should be used. Otherwise the lack of sequence complexity during the first sequencing cycles will lead to decreased cluster identification and potentially a failed sequencing run.
-
88
Incubate 60 min at room temperature.
-
89
Place the 0.2 mL tubes in the magnet and let the beads settle (∼2 min). Remove supernatant.
-
90
Perform 3 consecutive washes with 200 μL of Bind and Wash buffer 1x letting the beads to settle each time.
-
91
With the last wash change the beads containing the sample to a new 0.2 mL tube and let the beads settle (∼2 min). Remove supernatant.
-
92
Perform 1 wash with 200 μL of Bind and Wash buffer 1x.
-
93
Perform 1 wash with 200 μL of EB.
-
94
Resuspend the beads in 20 μL EB.
PAUSE POINT: Samples should be immediately processed in the next step. Unused samples (back-up), however, can be stored at 4°C for days or at -20°C for months. Note that storing at -20°C may damage the integrity of the bead matrix.
Library PCR amplification. TIMING 1.5 h
-
95
PCR amplify the libraries. Prepare the following mix:
Component Amount (μL) Final
Sample beads 20 Water 4 Phusion High-Fidelity PCR Master-Mix (2x) 25 1x Illumina oligo PE1.0 (5 μM) 0.5 0.1 μM Illumina oligo PE2.0 (5 μM) 0.5 0.1 μM
Total 50
-
96
Run a PCR using the following program hold at 4°C. Optionally, if the produced amount of library is too low for Illumina sequencing, increase the number of elongation cycles from 18 to up to 23.
Cycle number Denature Anneal Extend
1 98°C, 30 s 2-19 98°C, 20 s 65°C, 30 s 72°C, 30 s 20 72°C, 5 min
-
97
Place the 0.2 mL tubes in the magnet and let the beads settle (∼2 min). Take the supernatant (amplified sample) to a new 0.2 mL tube. Keep the used streptavidin beads at 4°C as a back-up in case it is necessary to repeat the PCR.
-
98
Purify the sample using 1.8x volumes of Ampure XP beads according to manufacturer's instructions. Add 90 μL Ampure XP beads and mix the sample by pipetting up and down. Let the sample bind the beads by incubating at room temperature for 5 min.
-
99
Place the 0.2 mL tubes in the magnet and let the beads settle (∼2 min). Remove supernatant and perform 2 consecutive washes with 200 μL of ethanol 70% (vol/vol).
-
100
Remove ethanol and let slightly dry for 1 minute. Elute in 20 μL EB buffer (10 mM Tris-HCl pH 8.0).
-
101
Quantify produced library by QuBit using the dsDNA HS Assay Kit and check size using High sensitivity DNA bioanalyzer.
PAUSE POINT: The sample may be stored for months at -20°C.
? TROUBLESHOOTING
Library size selection. TIMING 1.5 h
-
102
Size select 280-290 bp fragments using 2% eGel (Invitrogen) according to manufacturer protocol.
-
103
Load 20 μL sample per well and take several size fractions (e.g., 280, 300 and 350 nt).
CRITICAL STEP: Stringent size selection is critical to maximize the number of reads harbouring both 5′ and 3′ end sites. The addition of extra DNA ladders in the first and last well of the eGel system might help to account for possible gel “smiling”. The required size selection would depend on the used sequencing length as well as the complexity of the genome.
CRITICAL STEP: If multiple samples with the same barcode are run in the same eGel, leave at least 1 empty well between them to avoid cross contamination.
-
104
Purify the size-selected sample using 1.8x volumes of Ampure XP beads according to manufacturer's instructions. For 20 μL size selected libraries add 36 μL Ampure XP beads and mix the sample by pipetting up and down. Let the sample bind the beads by incubating at room temperature for 5 min.
-
105
Place the 0.2 mL tubes in the magnet and let the beads settle (∼2 min). Remove supernatant and perform 2 consecutive washes with 200 μL of ethanol 70% (vol/vol).
-
106
Remove ethanol and let slightly dry for 1 minute. Elute in 12 μL EB and transfer to a 0.2 mL tube.
-
107
Check concentration by Qubit using the dsDNA HS Assay Kit (optimally should be ∼0.5 ng μL-1 per sample) and size by bioanalyzer (Fig. 2b).
-
108
Pool samples with different barcodes.
CRITICAL STEP: If using barcoded adaptors, it is critical to select 4 or more different barcodes with balanced base composition to prevent Illumina cluster identification failure.
-
109
Sequence libraries using at least a 100 nt paired end sequencing
CRITICAL STEP: Using longer sequencing reads improves the percentage of mappable reads containing both 5′ and 3′ ends. However it should be accompanied by the purification of slightly longer fragments as described in step 105 (e.g., 320 bp for 150 paired end sequencing)
CRITICAL STEP: Before submitting the samples for Illumina sequencing is highly advisable to clone and Sanger sequence some of the produced TIF-Seq libraries. This is critical to check that usable results will be obtained, especially if it is the first time performing the TIF-Seq protocol. Specifically, at least half of the Sanger sequenced clones should present a structure compatible with the library construction process as shown in Table 2 (i.e., mapping to the 3′ of known genes, poly(A) tail, chimera controls and 5′ end of the same gene).
Table 2.
Chimera control configurations.
| Configuration A-A | 3′end-AAAAAAAAAAAAAAAABNNNNNNNTCTAGCGGCCGCACTGCACTCTGAGCAATACC-5′end |
| Configuration B-B | 3′end-AAAAAAAAAAAAAAAABNNNNNNNAGATGCGGCCGCTGATCACTCTGAGCAATACC-5′end |
| Configuration A-B (chimera) | 3′end-AAAAAAAAAAAAAAAABNNNNNNNTCTAGCGGCCGCTGATCACTCTGAGCAATACC-5′end |
| Configuration B-A(chimera) | 3′end-AAAAAAAAAAAAAAAABNNNNNNNAGATGCGGCCGCACTGCACTCTGAGCAATACC-5′end |
3′end and 5′end correspond to the regions where the cDNA sequence will be present. Random barcodes are identified in bold, 3′ and 5′ chimera barcode underlined (left and right respectively), NotI recognition sequence in italics, and the poly(A) tail and common sequence ligated to the 5′ RNA end in regular font (left and right respectivelly). Sequences are represented in 5′ to 3′orientation.
Bioinformatic analysis. TIMING 20 h
-
110
The described protocol will produce pairs of sequencing reads containing the information necessary to identify both 5′ and 3′ ends. De-multiplex read files using the sample barcodes and remove the barcode sequences. The obtained sequences will be further analysed to identify the exact 5′ and 3′ ends (steps 111 to 116).
CRITICAL STEP: The downstream data analysis can be variable depending on the specific bionformatic pipeline used. Here we provide general recommendations on how the analysis should be performed.
-
111
Align the read pairs to 4 configuration sequences (chimera control configurations, Table 2) by the Needleman–Wunsch global alignment method provided by the R Biostrings package from Bioconductor (www.bioconductor.org/).
-
112
Assign each pair to a configuration based on the best unique alignment to the 4 sequences in Table 2. Keep only those where the orientation between the two reads agree in a way that one maps to forward sequences and the other to reverse sequences of one configuration. In addition, at least one read in a pair should have an alignment score >25 and at least 6 As in the poly(A) sequences should be present in the alignment.
CRITICAL STEP: Note that the number of As present in the poly(A) sequences in the library can vary during the multiple PCR amplifications due to polymerase slippage.
-
113
Trim the 8 nucleotides located downstream of the poly(A) sequences, which correspond to the random molecular barcodes. Use them to identify unique transcriptional events and eliminate amplification bias.
-
114
Trim the pairs of 5′ and 3′ sequences independently according to their alignments to configuration sequences. Only the sequences containing at least 20bp at both the 5′ and 3′ ends should be kept for further alignment.
-
115
Align pairs of 5′ sequences and 3′ sequences separately to the reference genome using Novoalign V2.07.10 (http://www.novo- craft.com) using default parameters. A reference genome containing both the genome sequence along with the sequences of the in vitro transcripts included as spike-in controls should be used.
-
116
Keep for subsequent analyses only pairs where both ends uniquely map to the reference.
? TROUBLESHOOTING
TIMING
The time is estimated for the parallel preparation of six TIF-Seq libraries.
| Day 1 (steps 1-13) |
| Preparation of DNA-free RNA. TIMING 45 min |
| Phosphatase treatment. TIMING 4 h |
| Day2 (steps 14-41) |
| 5′ Cap removal. TIMING 4h |
| Reverse transcription. TIMING 2.5 h |
| Generate second strand by PCR. TIMING 2.5 h |
| Day 3-4 (steps 42-52) |
| Optional size selection. TIMING 4 h |
| Produce sticky ends. TIMING 1.5 h |
| Circularize full-length cDNA. TIMING 19h |
| Day 4-5 (steps 53-94) |
| Sonicate circularized DNA. TIMING 1.5 h |
| Bind samples to streptavidin beads. TIMING 1 h |
| End repair DNA fragments. TIMING 45 min |
| Add a protruding A to the DNA fragments. TIMING 45 min |
| Ligation of barcoded Illumina adaptors. TIMING 1.5 h |
| Day 5-6 (steps 95-109) |
| Library PCR amplification. TIMING 1.5 h |
| Library size selection. TIMING 1.5 h |
? TROUBLESHOOTING
Troubleshooting advice can be found in Table 3
Table 3. Troubleshooting advice.
| Step | Problem | Possible reason | Possible solution |
|---|---|---|---|
| 3, 26 | RNA degradation | Contamination with RNase | Include an RNase inhibitor during the protocol (as already recommended). Use always small aliquots of RNase-free reagents and make sure of the integrity and quality of the starting RNA. |
| 107 | Insufficient amount of final library produced | Low efficiency in RNA ligation, reverse transcription or production of full –length cDNA molecules. | Perform parallel reactions in different tubes and pool the obtained samples. As molecular barcodes can be used to overcome amplification bias, the number of PCR cycles could also be increased. |
| 116 | High number of reads containing Illumina primer dimer sequences or decreased library complexity | Due to the low amount of produced library or due to an excess of Illumina linkers used for the ligation step | Increase the amount input material. Optimize the number of PCR cycles to minimize the number of PCR duplicates while preventing the formation of a molecular bottleneck. Run a pilot sequencing lane (all libraries multiplexed with other samples or in a lower throughput machine, e.g., MiSeq) to assess the quality of the libraries before sequencing at high coverage with multiple HiSeq lanes. |
Anticipated Results
The described protocol will produce sequencing reads containing the information necessary to identify both 5′ and 3 ends. Both ends can be connected by and visualized in programs such as IGV33 (Fig 2C). In Fig. 2 each identified transcript isoform corresponds to a line that connects the 5′ and 3′ end of each molecule, without any information regarding the internal splicing events. The analysis of the TIF-Seq reads mapping to the IVT spike-ins (Box 1) is a useful tool to check for the technical success of the protocol. In general, more than 90% of the reads assigned to the IVTs should map in close proximity (less than 5 nt window) of their known 5′ and 3′ ends. Please note that, as explained previously in the limitation sections, the identification of shorter transcripts is favored. Thus it is common to detect short transcripts initiating in the body of the gene and ending in the expected polyadenylation site (e.g., as is the case for MRPL24 in Fig. 2c). Those transcripts, although overrepresented by TIF-Seq, do exist in the sample and can also be observed when a size-independent mapping of the 5′CAP is performed. If in a particular TIF-Seq study the objective is to focus in the longer RNA molecules, an optional size-selection of the full-length cDNA is recommended (Box2). It is also expected to detect significant heterogeneity for the presence of alternative 5′ and 3′ ends (when compared to the technical detection heterogeneity associated to the IVTs). A decreased heterogeneity is usually due to a lack of library complexity.
BOX 3. Preparation of annealed linkers. TIMING 2 h.
To produce double-stranded DNA linkers, it is necessary to mix the forward and reverse oligos (see table I) and subject them to heat denaturation followed by slow cooling to facilitate annealing between the single-stranded molecules.
Mix the oligos at 2.5 μM in the presence of 40 mM Tris-HCl pH 8.0 and 50 mM NaCl in 0.2 mL PCR tubes.
Incubate the sample for 5 min at 95°C and let it cool slowly (-0.1°C/s) to 65°C.
Incubate the sample for 5 min at 65°C and let it cool slowly (-0.1°C/s) to 4°C.
Store the aliquots indefinitely at -20°C. Always thaw the linkers on ice to prevent denaturation.
Annealing efficiency can be checked using a 2% (wt/vol) agarose gel comparing the migration of the annealed linkers to the individual oligos.
Acknowledgments
We thank R. Aiyar for help in editing and refining the manuscript. We thank A. I. Järvelin, J. Zaugg and S. Clauder-Münster for help in optimizing the TIF-Seq protocol, and the members of the Steinmetz laboratory for helpful discussions and critical comments. This study was technically supported by the EMBL Genomics Core Facility. This study was financially supported by the National Institutes of Health (to L.M.S.).
Footnotes
Author contributions: W.W., V.P. and L.M.S. conceived the project. V.P. developed the TIF-Seq method and P.J. contributed to further method optimization. W.W. and V.P. performed data analysis. L.M.S. supervised the study. All authors wrote the manuscript.
Competing financial interests: The authors declare that they have no competing financial interests.
Contributor Information
Vicent Pelechano, Email: pelechan@embl.de.
Wu Wei, Email: wuwei@embl.de.
Petra Jakob, Email: jakob@embl.de.
Lars M. Steinmetz, Email: larsms@embl.de.
References
- 1.Djebali S, et al. Landscape of transcription in human cells. Nature. 2012;489:101–108. doi: 10.1038/nature11233. [DOI] [PMC free article] [PubMed] [Google Scholar]
- 2.Di Giammartino DC, Nishida K, Manley JL. Mechanisms and consequences of alternative polyadenylation. Mol Cell. 2011;43:853–866. doi: 10.1016/j.molcel.2011.08.017. [DOI] [PMC free article] [PubMed] [Google Scholar]
- 3.Gupta I, et al. Alternative polyadenylation diversifies post-transcriptional regulation by selective RNA-protein interactions. Mol Syst Biol. 2014;10:719. doi: 10.1002/msb.135068. [DOI] [PMC free article] [PubMed] [Google Scholar]
- 4.Kelemen O, et al. Function of alternative splicing. Gene. 2013;514:1–30. doi: 10.1016/j.gene.2012.07.083. [DOI] [PMC free article] [PubMed] [Google Scholar]
- 5.Xu Z, et al. Bidirectional promoters generate pervasive transcription in yeast. Nature. 2009;457:1033–1037. doi: 10.1038/nature07728. [DOI] [PMC free article] [PubMed] [Google Scholar]
- 6.Nagalakshmi U, et al. The transcriptional landscape of the yeast genome defined by RNA sequencing. Science. 2008;320:1344–1349. doi: 10.1126/science.1158441. [DOI] [PMC free article] [PubMed] [Google Scholar]
- 7.Wei W, Pelechano V, Jarvelin AI, Steinmetz LM. Functional consequences of bidirectional promoters. Trends Genet. 2011;27:267–276. doi: 10.1016/j.tig.2011.04.002. [DOI] [PMC free article] [PubMed] [Google Scholar]
- 8.Jacquier A. The complex eukaryotic transcriptome: unexpected pervasive transcription and novel small RNAs. Nat Rev Genet. 2009;10:833–844. doi: 10.1038/nrg2683. [DOI] [PubMed] [Google Scholar]
- 9.Carninci P, et al. Genome-wide analysis of mammalian promoter architecture and evolution. Nat Genet. 2006;38:626–635. doi: 10.1038/ng1789. [DOI] [PubMed] [Google Scholar]
- 10.Zhang Z, Dietrich FS. Mapping of transcription start sites in Saccharomyces cerevisiae using 5′ SAGE. Nucleic Acids Res. 2005;33:2838–2851. doi: 10.1093/nar/gki583. [DOI] [PMC free article] [PubMed] [Google Scholar]
- 11.Ozsolak F, et al. Comprehensive polyadenylation site maps in yeast and human reveal pervasive alternative polyadenylation. Cell. 2010;143:1018–1029. doi: 10.1016/j.cell.2010.11.020. [DOI] [PMC free article] [PubMed] [Google Scholar]
- 12.Moqtaderi Z, Geisberg JV, Jin Y, Fan X, Struhl K. Species-specific factors mediate extensive heterogeneity of mRNA 3′ ends in yeasts. Proc Natl Acad Sci U S A. 2013;110:11073–11078. doi: 10.1073/pnas.1309384110. [DOI] [PMC free article] [PubMed] [Google Scholar]
- 13.Wilkening S, et al. An efficient method for genome-wide polyadenylation site mapping and RNA quantification. Nucleic Acids Res. 2012 doi: 10.1093/nar/gks1249. [DOI] [PMC free article] [PubMed] [Google Scholar]
- 14.Pelechano V, Wilkening S, Jarvelin AI, Tekkedil MM, Steinmetz LM. Genome-wide polyadenylation site mapping. Methods in enzymology. 2012;513:271–296. doi: 10.1016/B978-0-12-391938-0.00012-4. [DOI] [PubMed] [Google Scholar]
- 15.Pelechano V, Wei W, Steinmetz LM. Extensive transcriptional heterogeneity revealed by isoform profiling. Nature. 2013;497:127–131. doi: 10.1038/nature12121. [DOI] [PMC free article] [PubMed] [Google Scholar]
- 16.Ng P, et al. Multiplex sequencing of paired-end ditags (MS-PET): a strategy for the ultra-high-throughput analysis of transcriptomes and genomes. Nucleic Acids Res. 2006;34:e84. doi: 10.1093/nar/gkl444. [DOI] [PMC free article] [PubMed] [Google Scholar]
- 17.Ng P, et al. Gene identification signature (GIS) analysis for transcriptome characterization and genome annotation. Nat Methods. 2005;2:105–111. doi: 10.1038/nmeth733. [DOI] [PubMed] [Google Scholar]
- 18.Fullwood MJ, et al. An oestrogen-receptor-alpha-bound human chromatin interactome. Nature. 2009;462:58–64. doi: 10.1038/nature08497. [DOI] [PMC free article] [PubMed] [Google Scholar]
- 19.Ruan X, Ruan Y. Genome wide full-length transcript analysis using 5′ and 3′ paired-end-tag next generation sequencing (RNA-PET) Methods Mol Biol. 2012;809:535–562. doi: 10.1007/978-1-61779-376-9_35. [DOI] [PubMed] [Google Scholar]
- 20.Carninci P, et al. High-efficiency full-length cDNA cloning by biotinylated CAP trapper. Genomics. 1996;37:327–336. doi: 10.1006/geno.1996.0567. [DOI] [PubMed] [Google Scholar]
- 21.Zhu YY, Machleder EM, Chenchik A, Li R, Siebert PD. Reverse transcriptase template switching: a SMART approach for full-length cDNA library construction. BioTechniques. 2001;30:892–897. doi: 10.2144/01304pf02. [DOI] [PubMed] [Google Scholar]
- 22.Maruyama K, Sugano S. Oligo-capping: a simple method to replace the cap structure of eukaryotic mRNAs with oligoribonucleotides. Gene. 1994;138:171–174. doi: 10.1016/0378-1119(94)90802-8. [DOI] [PubMed] [Google Scholar]
- 23.Scotto-Lavino E, Du G, Frohman MA. Amplification of 5′ end cDNA with ‘new RACE’. Nat Protoc. 2006;1:3056–3061. doi: 10.1038/nprot.2006.479. [DOI] [PubMed] [Google Scholar]
- 24.Carninci P. Constructing the landscape of the mammalian transcriptome. J Exp Biol. 2007;210:1497–1506. doi: 10.1242/jeb.000406. [DOI] [PubMed] [Google Scholar]
- 25.Kuai L, Fang F, Butler JS, Sherman F. Polyadenylation of rRNA in Saccharomyces cerevisiae. Proc Natl Acad Sci U S A. 2004;101:8581–8586. doi: 10.1073/pnas.0402888101. [DOI] [PMC free article] [PubMed] [Google Scholar]
- 26.Van Nieuwerburgh F, et al. Quantitative bias in Illumina TruSeq and a novel post amplification barcoding strategy for multiplexed DNA and small RNA deep sequencing. PLoS One. 2011;6:e26969. doi: 10.1371/journal.pone.0026969. [DOI] [PMC free article] [PubMed] [Google Scholar]
- 27.Chen Y, et al. Systematic evaluation of factors influencing ChIP-seq fidelity. Nat Methods. 2012;9:609–614. doi: 10.1038/nmeth.1985. [DOI] [PMC free article] [PubMed] [Google Scholar]
- 28.Miura F, et al. A large-scale full-length cDNA analysis to explore the budding yeast transcriptome. Proc Natl Acad Sci U S A. 2006;103:17846–17851. doi: 10.1073/pnas.0605645103. [DOI] [PMC free article] [PubMed] [Google Scholar]
- 29.Sharon D, Tilgner H, Grubert F, Snyder M. A single-molecule long-read survey of the human transcriptome. Nature biotechnology. 2013;31:1009–1014. doi: 10.1038/nbt.2705. [DOI] [PMC free article] [PubMed] [Google Scholar]
- 30.McManus CJ, Duff MO, Eipper-Mains J, Graveley BR. Global analysis of trans-splicing in Drosophila. Proc Natl Acad Sci U S A. 2010;107:12975–12979. doi: 10.1073/pnas.1007586107. [DOI] [PMC free article] [PubMed] [Google Scholar]
- 31.Anders S, Huber W. Differential expression analysis for sequence count data. Genome biology. 2010;11:R106. doi: 10.1186/gb-2010-11-10-r106. [DOI] [PMC free article] [PubMed] [Google Scholar]
- 32.Wilkening S, et al. Genotyping 1000 yeast strains by next-generation sequencing. BMC Genomics. 2013;14:90. doi: 10.1186/1471-2164-14-90. [DOI] [PMC free article] [PubMed] [Google Scholar]
- 33.Thorvaldsdottir H, Robinson JT, Mesirov JP. Integrative Genomics Viewer (IGV): high-performance genomics data visualization and exploration. Briefings in bioinformatics. 2013;14:178–192. doi: 10.1093/bib/bbs017. [DOI] [PMC free article] [PubMed] [Google Scholar]