

Abstract
Anorexia nervosa (AN) is an eating disorder characterized by self-imposed severe starvation, excessive exercise, and anxiety. The onset of AN is most often at puberty, suggesting that gonadal hormonal fluctuations may contribute to AN vulnerability. Activity-based anorexia (ABA) is an animal model that reproduces some of the behavioral phenotypes of AN, including the paradoxical increase in voluntary exercise following food restriction. The basal amygdala as well as the GABAergic system regulate trait anxiety. We therefore examined the subcellular distribution of GABA receptors (GABARs) in the basal amygdala of female pubertal rats and specifically of their α4 subunits, because expression of α4-containing GABARs is regulated by gonadal hormone fluctuations. Moreover, because these GABARs reduce neuronal excitability through shunting of EPSPs, we quantified the frequency of occurrence of these GABARs adjacent to excitatory synapses. Electron microscopic immunoctychemistry revealed no change in the frequency of association of α4 subunits with excitatory synapses on dendritic spines, whether in the anterior (Bregma −2.8 mm) or caudal (Bregma −3.8 mm) portion of the basal amygdala. Sholl analysis of golgi-stained neurons also revealed no change in the extent of dendritic branching by these densely spiny, pyramidal-like neurons. However, there was an increase of membranous α4 subunits near excitatory synapses on dendritic shafts, specifically in the amygdala, and this was accompanied by a rise of α4 subunits intracellularly. Because most dendritic shafts exhibiting excitatory synapses are GABAergic interneurons, the results predict disinhibition, which would increase excitability of the amygdaloid network, in turn augmenting ABA animals’ anxiety.
Keywords: exercise, food restriction, anorexia nervosa, anxiety, hyperactivity, disinhibition
INTRODUCTION
Anorexia nervosa (AN) has the highest mortality rate among psychiatric disorders (Birmingham et al., 2005; Bulik et al., 2007; Sullivan, 1995) and is characterized by severe self-starvation and weight loss, psychological disturbances related to body image, fear of gaining weight or becoming fat, and often hyperactivity. It most commonly occurs in females, with a characteristic onset in adolescence (APA, 2000). AN is commonly comorbid with anxiety disorders, with most individuals reporting the onset of a childhood anxiety disorder prior to the onset of the eating disorder (Kaye et al., 2004). This high comorbidity between AN and anxiety suggests that a shared etiology and/or similar disturbances in brain circuitry and signaling may exist. In fact, it has been suggested that calorie restriction may be an attempt by individuals with AN or predisposed to AN to regulate anxiety (Kaye, 2008; Kaye et al., 2003; Riddle et al., 2013). The underlying pathology and neurochemical basis of AN are not understood and pharmacological treatments have had limited efficacy (Aigner et al., 2011; Barbarich-Marsteller et al., 2012; Powers and Bruty, 2009). Therefore, analysis of neurotransmitter receptors targeted by pharmacological treatments is particularly relevant for enhancing our understanding of the cellular and neuronal network substrates of self-starvation, hyperactivity, and anxiety associated with AN.
Given the high rate of mortality and lack of effective pharmacological treatments, animal models have been used to study the neural mechanisms and circuitry underlying AN. Activity-based anorexia (ABA) is the most widely utilized animal model of AN that demonstrates several core phenotypic features similar to the clinical disorder, including severe dietary restriction, rapid weight loss, voluntary hyperactivity, and loss of estrous cycle function (Aoki et al., 2012; Barbarich-Marsteller, 2012; Epling and Pierce, 1996; Epling et al., 1983; Golden and Shenker, 1992; Hall and Hanford, 1954; Routtenberg and Kuznesof, 1967). In this rodent model, the combination of restricted access to food (typically 1–2 hours per day) and ad libitum access to a running wheel produces a maladaptive cycle of increasingly greater levels of hyperactivity and weight loss. Remarkably, ABA animals engage in voluntary starvation after the first few days of induced starvation (Epling and Pierce, 1996; Epling et al., 1983; Routtenberg and Kuznesof, 1967). The continued hyperactivity leads to extreme weight loss and possible mortality, unless the animal is removed from experimental conditions. ABA animals also exhibit neurobiological alterations similar to clinical AN, for example, hypothermia and hypoleptimenia (Bannai et al., 1988; Brandys et al., 2011; Gelegen et al., 2008; Golden and Shenker, 1994; Hakansson et al., 1998; Mantzoros et al., 1997; Nakazato et al., 2012). Individuals suffering from AN have reduced serum levels of BDNF and in parallel, a strain of mice unable to increase BDNF expression in the hippocampus are vulnerable to ABA, whereas adult mice of a different strain that are able to do so display resistance to ABA (Brandys et al., 2011; Gelegen et al., 2008; Nakazato et al., 2012).
The amygdala is an important brain structure that ascribes emotion to environmental cues and could underlie both anxiety disorders and AN. Several lines of evidence identify the basal amygdala as a potential target for therapy in AN. First and most relevant to this study is the report that the amygdala in individuals with AN are overactive (Joos et al., 2011). Second, infusion of muscimol, a GABAR agonist into the basolateral amygdala (BLA) reduces fear expression (Quirk and Mueller, 2008). Third, the acquisition, consolidation, and expression of fear extinction require an intact connection between the BLA and other key structures, such as the hippocampus and prefrontal cortex (Quirk and Mueller, 2008). Fourth, the amygdala has been shown to be hypertrophied in animals with anxiety-like behavior, and this feature could reflect the cellular basis for trait anxiety (Vyas et al., 2004). Finally, the caudal region of the basal amygdala projects to the stratum radiatum and oriens in the CA1 of the hippocampus (Kishi et al., 2006), another brain region that regulates anxiety states (Bannerman et al., 2004, McHugh et al., 2011), especially during puberty onset (Shen et al., 2007). The amygdala also projects to the medial shell of the nucleus accumbens, a region important in regulation of food intake (Groenewegen et al., 1999; Kelley and Swanson, 1997).
Of the neurotransmitter systems involved in the regulation of anxiety, the GABAergic system is most clearly linked. Diazepam, marked as Valium, is a positive allosteric modulator of GABA receptors (GABAR) and is effective in treating anxiety disorders. However, literature on the efficacy of benzodiazepines in treatment of AN is scarce and this may be because of its inefficacy. GABARs are heterogeneous due, in part, to the differential assembly of GABAR subunits and of them, the α4-containing GABARs are not responsive to benzodiazepines. Hormonal states, stress, and adolescence are all factors that uniquely regulate α4βδ-GABAR sensitivity and expression in the hippocampus (Smith et al., 2007) and may contribute to AN vulnerability because adolescent female rats that have undergone ABA induction for 4 days show increased α4 and δ subunit expression in hippocampal CA1 spines (Aoki et al., 2012). In the hippocampal CA1, the α4-containing GABARs (α4βδ-GABARs) occur adjacent to excitatory synapses, mediating tonic inhibition and shunting of excitatory postsynaptic potentials (Shen et al., 2007, 2010). Such an increased expression on spines could result in increased inhibition of the pyramidal or spiny neurons. The link of ABA vulnerability to reduced levels of BDNF in mice (described above) supports the idea that the GABAergic system may be evoked to become altered by ABA induction because BDNF enhances GABAergic innervation of excitatory neurons and also enhances the expression of GABAergic receptors containing α4 and δ subunits.
Considering the amygdala’s connectivity to the ventral hippocampus and its role in anxiety and overactivity observed in the functional imaging of AN patients, we surmised that changes in the hippocampus might be accompanied by amygdalar changes in the expression of α4βδ-GABARs. Previous work has used progesterone withdrawal upon female rats as an animal model for premenstrual anxiety. This treatment elicits higher levels of anxiety and with it, an increase in the α4 subunits in the amygdala, as is shown by the Western blot approach (Gulinello et al., 2003). This illustrates the hormone modulation of the α4-containing GABAR in the amygdala and a positive link between α4-containing GABARs in the amygdala and anxiety. Indeed, overactivity of the amygdala in individuals with AN may be mediated by changes in the expression of α4βδ-GABARs in the basal amygdala, resulting in increased inhibition of inhibitory neurons and/or reduced inhibition of excitatory neurons. To determine whether α4βδ-GABAR localization in the basal amygdala changes following ABA induction in a cell-and synapse-specific manner, we used electron microscopic immunocytochemistry to quantify the α4 subunit-containing GABARs in the vicinity of excitatory synapses on spines and on dendritic shafts. Because the rostral and caudal basal amygdala have different connections to other brain regions (Ono et al., 1985; Wright et al., 1996), we separately analyzed the caudal and amygdala, and compared across ABA and control animals.
Among individuals that have recovered from AN, the incidence of relapse is as high as 30–50% within a year (Birmingham et al., 2005), indicating that the first onset may cause changes in brain connections that persist beyond weight restoration. Considering the high comorbidity between anxiety and AN, the relapse is perhaps because of persistence of anxiety. One region in which neuronal circuitry can undergo structural changes in association with anxiety is the amygdala (Adamec et al., 2012; Mitra and Sapolsky, 2008). We addressed the possibility by examining the morphology of golgi-stained densely spiny, pyramidal-like neurons in the basal nucleus of the amygdala. These neurons are excitatory and projecting and will henceforth be referred to as pyramidal neurons (Fuller et al., 1987; McDonald, 1996; Millhouse and DeOlmos, 1983).
MATERIALS AND METHODS
Animals
Sprague–Dawley female rats were purchased from Taconic Farms and delivered to the New York State Psychiatric Institute’s animal facility on postnatal day 21 (P21). Upon arrival, the animals were individually housed on a reverse 12 h dark/12 h light cycle in the absence of males. All procedures relating to the use of animals were in accordance with the Institutional Animal Care and Use Committees of the New York State Psychiatric Institute, Columbia University (Animal Welfare Assurance No. A3007-01) and New York University (Animal Welfare Assurance number A3317-01).
ABA induction and behavioral controls
Control animals were housed in standard home cages with ad libitum access to food (and no running wheel access) for the duration of the study. On P37, animals in the ABA group were placed in standard home cages with running wheels attached (Med Associates, Inc., St. Albans, VT) and ad libitum access to food in order to record baseline running activity. Starting on P40 until P44, the animals in the ABA group were given unlimited access to food for the first hour of the dark cycle; food was not available for the remaining 23 h per day. Body weight, food intake, and wheel-running activity (where applicable) were measured daily within 20 min prior to the start of the dark cycle. One group of animals, including ABA and CON, was allotted to the EM study and a separate group was allotted for the golgi study.
Antibody characterization
The goat antibody used to detect the α4 subunit of GABARs was produced by using an immunogen corresponding to amino acids 32 through 50 from the N-terminus of human α4 subunit of GABARs (ESPGQNSKD EKLCPENFTR). This antibody was purchased from Santa Cruz (catalog # SC-7355). The anti-α4 subunit antibody has been characterized extensively for its specificity (Aoki et al., 2012; Sabaliauskas et al., 2012) Those studies showed that application of this antibody to brain tissue fixed identically but with genetic deletion of the α4 subunit yields reduction of immunolabeling by 88% on the plasma membrane or intracellularly. Preadsorption of the antibody with a peptide corresponding to the antigen used to immunize the host animal yielded no immunolabeling. Finally, omission of the primary antibody in the first incubation step also yielded no immunolabeling. The secondary antibody was a rabbit anti-goat IgG, conjugated to 0.8 nm colloidal gold particles (catalog #25220, Electron Microscopic Sciences, Hatfield, PA).
Electron microscopic quantification
Experimental protocols for the preparation of brain tissue and immunocytochemistry for α4 subunit of GABARs and the general protocol for electron microscopic quantification have previously been described in Aoki et al 2012: any differences from the procedure are outlined below. Four ABA and four CON animals were included in the analysis in the rostral and caudal BA. Immunocytochemistry was performed on coronal sections of the brain at Bregma levels −2.8 mm and −3.8 mm, containing the rostral and caudal portions, respectively, of the basal amygdala to detect α4 subunit of GABARs. These Bregma levels were determined by matching the shape of the hippocampus, the lateral ventricle, basal ganglia, and myelinated fiber bundles immediately surrounding the amygdala to those structures shown in the atlas by Paxinos and Watson (2006) (Fig. 1). Within the amygdala, the division of the lateral from the basal nuclei were judged using the concavity of the external capsule along the lateral border. The most medial point of the concavity marked the separation of the lateral from the basal nucleus. The caudal amygdala was marked by the characteristic shape of the basal nucleus with a concavity facing ventrally, together with the absence of the central nucleus.
Fig. 1.
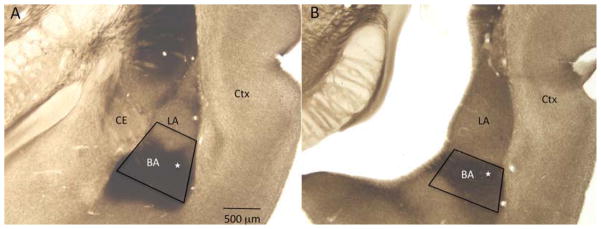
Light micrographs depicting the rostral (panel A) and caudal (panel B) basal amygdala (BA) in coronal reference sections, prepared from a nonexperimental adult rat brain. The anatomical features match Bregma levels −2.8 and −3.8 mm, respectively, of the rat stereotaxic atlas by Paxinos and Watson (2006). These reference sections were stained for acetyl cholinesterase to delineate the chemoarchitectonic boundaries between the lateral (LA) and the basal nuclei of the amygdala, then linked to the surrounding anatomical features consisting of the white matter, gray matter and the lateral ventricle. These surrounding landmarks were then used to identify the basal amygdala in vibratome sections used for electron microscopy, which lacked acetyl cholinesterase staining. Trapezoids are drawn to show the areas chosen for ultrathin sectioning. White stars inside the trapezoids indicate the regions imaged by electron microscopy. CE, central nucleus; Ctx, cortex. Calibration bar = 500 μm.
Digital images of the caudal and rostral basal amygdalar tissue were taken from the basal amygdala at the position indicated in Figure 1, at a magnification of 40,000× by a researcher blind to the treatment group. Within the ultrathin section, electron microscopic imaging was confined to the area just medial to the external capsule and ventral to the boundary between lateral and basal nuclei in order to maintain consistency in the areas examined. In the classification by Jolkkonen and Kemppainen (2000), the sampling corresponds to the basal parvicellular nucleus. In both the ABA and CON animals, we sampled approximately 2500 μ2 for the spine analysis and 1500 μ2 for the dendritic shaft analysis.
Within the images, synapses were identified as asymmetric on the basis of a thick postsynaptic density adjacent to axon terminals filled with vesicles. Asymmetric synapses were then classified as axo-spinous or axo-dendritic. Dendritic spines were identified as oval profiles, ≈0.2–0.5 μm in diameter, free of microtubules, vesicles or mitochondria, with a thick postsynaptic density (PSD) along the portion of the plasma membrane that is in apposition to an axon terminal containing numerous vesicles (Nedelescu et al., 2010) and occasionally with a characteristic narrowing of the profile (the spine neck). Dendritic shaft profiles were identified by the presence of microtubules and/or mitochondria, multivesicular bodies, endoplasmic reticulum, or by their larger size (diameter larger than 0.7 μm) if these organelles were not present.
Care was taken to sample portions of the vibratome section that were within 1 μm of the vibratome section surface, where exposure to the immunoreagents would be maximal. Vibratome section surface, as opposed to cracks in tissue created during the steps subsequent to incubation with antibodies, was identified by the characteristic serrated edges formed by the vibratome blade during brain tissue sectioning. We systematized the random sampling strategy by analyzing all spines and shafts with excitatory synapses, strictly in the order that they were encountered, along the serrated. In this way, the serrated like the grids that are randomly laid over the sample to assign points for sampling. Usually, only one ultrathin section was analyzed from a single vibratome section, to ensure that any one spine or shaft synapse did not get sampled more than once. For those occasions where more than one ultrathin section needed to be sampled from a single vibratome section, care was made to sample ultrathin sections that, to avoid sampling any spine or any immunoreactive portion of the dendritic shaft more than once. Analysis of axo-spinous synapses was terminated at the point of encountering the 160th spine profile within the basal amygdala at the rostral and caudal level, to equalize the sampling across the animals. Asymmetric synapses on dendritic shafts were, in general, less numerous. Sampling of these shaft synapses was terminated at 61st and 70th dendritic shaft synapse, respectively, again equalizing the sample size per animal.
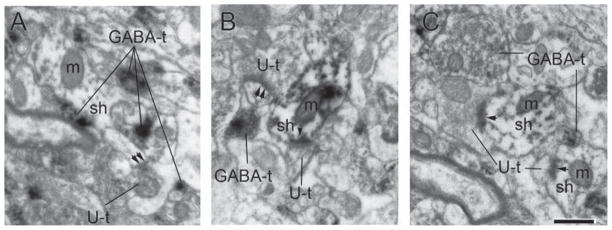
Receptor subunits occurring at the plasma membrane may or may not reflect the presence of functional GABARs because receptor function is dictated by both, the location of its subunits and the formation of subunit complexes into functional pentamers (two α subunits, two β subunits, and either a δ or γ subunit) (Barnard et al., 1998; Farrant and Nusser, 2005). Conversely, receptor subunits occurring at sites removed from the plasma membrane are clearly not functional. Therefore, immunolabeled spine profiles were subdivided into those with or without plasma-lemmal expression of α4 subunits. Because the α4 subunit antibody was generated by using peptide antigens corresponding to the extracellular, N-terminus of the subunit, SIG particles reflecting antibodies bound to receptor subunits with functional membrane topography would be expected to localize along the extracellular surface of the plasma membrane. Therefore, those SIG particles associated with the extracellular surface of the plasma membrane were classified as plasmalemmal (Fig. 2). SIG particles were categorized to be nonmembranous and intracellular, when they were displaced from the plasma membrane by greater than 10 nm (equal to the thickness of a unit membrane) at a direct magnification of 40,000×.
Fig. 2.

Electron micrographs show the ultrastructural location of α4 immunoreactivity in a variety of subcellular locations. Using silver-intensified gold (SIG) as the immunolabel, the subcellular location of SIG was categorized as plasmalemmal vs. intracellular, and as occurring within spine vs. shaft domains of dendrites. Panel A shows a single SIG particle (white arrow) spanning the plasma membrane of the dendritic shaft (D) with an excitatory synapse (E) and a cluster of two SIG particles on the plasma membrane of the shaft (white arrow). These three SIG particles would be included in the plasmalemmal labeling counts. The number of membranous SIGs was divided by the shaft membrane length to yield the membrane density. One example of an intracellular particle is indicated with a black arrow. The number of intracellular SIGs was divided by the intracellular area to obtain the intracellular density. Both panels were taken from an ABA animal. Panel B is an example of a spine profile (S) with a group of three SIG particles (white arrow). Calibration bar =500 nm.
The proportion of dendritic spine profiles immunolabeled at the plasma membrane for the α4 subunit was measured. To this end, for every group of 10 spines that was randomly encountered, the number of spine profiles immunolabeled at the plasma membrane was assessed. This assessment of the proportion of spine profiles labeled was repeated 16 times for a single source of tissue, to obtain a mean value of 16 assessments, representing the analysis of 160 spine profiles per animal. Any single spine profile was categorized as labeled at the membrane, so long as it contained one or more SIG particles at the plasma membrane. N-values used in statistical analysis must be independent events. There is substantial evidence indicating that dendritic spines are biological entities that can respond independently, such as to its own presynaptic axon terminal partner or to the application of agonists (Carter et al., 2007; Matsuzaki et al., 2004; Yuste and Denk, 1995). We aimed to reveal changes evoked by the environmental condition upon individual synapses. Hence, the 16 assessments from each animal were pooled groupwise, resulting in 64 values in each group for the rostral and caudal amygdala (four animals per group). In a parallel manner, we also measured the proportion of spine profiles immunolabeled intracellularly for the α4 subunit. As described for the membranous label analysis, an assessment of 160 spines per animal yielded 64 values in each group for the rostral and caudal amygdala (four animals per group).
The postsynaptic dendritic shafts, on the other hand, varied widely in their plasmalemmal length and cross-sectional area and hence, the number of plasmalemmal SIG particles per unit membrane length and the number of intracellular SIG particles per unit cross-sectional area was computed for every postsynaptic shaft to normalize for membrane length and area. The polygon and segmented line tools of software Image J (NIH version 1.45s) were used for measuring the area and perimeter of dendritic profiles. The number of membranous SIGs was divided by the shaft membrane length to yield the membrane density. The number of intracellular SIGs was divided by the intracellular area to obtain the intra-cellular density. The distributions of these measurements were compiled for each group, ABA and CON. There is evidence to support that dendritic properties can be modified locally and independently (Frick et al., 2004; Losonczy et al., 2008). Furthermore, the input at axo-dendritic synapses can be regulated more strongly by modulators acting near them rather than at a distance. Such modulators include tonic inhibition from α4-containing GABAR near the axo-dendritic synapses. Hence, we treat each axo-dendritic synapse as a separate entity and pool together synapses from animals within an experimental group.
Preparation of tissue immunolabeled for GABA
Dendritic shafts postsynaptic to excitatory synapses sampled in the aforementioned way could belong to either pyramidal or inhibitory neurons. Pyramidal neurons in the amygdala are excitatory, densely spiny, and receive 96% of their total excitatory input on spines and virtually none along the smooth portions of dendritic shafts (Muller et al., 2006). In contrast, inhibitory neurons are sparsely spiny and receive excitatory inputs directly along smooth portions of dendritic shafts. To quantify the proportion of the axo-shaft asymmetric synapses onto pyramidal neurons or inhibitory neurons, we examined the caudal basal amygdala from brain tissue from a 10-week old male rat immunolabeled for GABA using 3,3′-diaminobenzidine (DAB) as the electron-dense immunolabel. The rat was transcardially perfused under anesthesia using 1% glutaraldehyde/4% PFA as fixative. The brain was then cut in the coronal plane at a thickness of 40 μm on a vibratome. Sections were treated with sodium borohydride, rinsed in PBS, blocked in 1% bovine serum albumin (BSA), incubated in antibody (MMC GABA, 1:2000, catalog # 69328, ICN, Costa Mesa, CA) overnight at room temperature, then placed in biotinylated secondary, then in the avidin-biotinylated HRP complex solution for 30 min, and reacted with H2O2 and DAB. Further methodological details are as described in Woodson et al. (2000) under “Immunocytochemical labeling.” We sampled 127 spines and 25 dendritic shafts postsynaptic to excitatory synapses and quantified the proportion of that were labeled immunopositively, and thus for GABA. Care was taken to sample shafts at the surface of the vibratome sections to ensure they would be labeled positive if they belonged to inhibitory neurons. The results from analysis of male rat tissue will be applicable to female rats because we expect no sexual dimorphism in the basic circuitry of excitatory input on dendritic shafts.
Golgi staining and Sholl analysis
A separate cohort of three female rats underwent ABA induction. These animals and three CON animals were euthanized on P44 between the hours of 7–9 AM, before the beginning of the dark cycle. The animals were deeply anesthetized using urethane (34%; 0.65–0.85 mL/185 g body weight, intraperitoneal injection). The animals were decapitated and the brains were quickly removed from the skull and one hemisphere was divided along the coronal plane into two blocks of 3–4 mm thickness and processed for golgi–Cox impregnation using FD Rapid GolgiStain kit according to the instructions of the manufacturer (FD NeuroTechnologies, Ellicot City, MD). Sections of 250 μm thick were made using a Leica VT1000M vibratome (Leica Microsystems GmbH, Wetzlar, Germany). Slides were coded before tracing, and the code was broken only after the final analysis was completed. In the amygdala (Bregma level −3.8 mm), we selected the golgi-impregnated neurons that showed the presence of apical dendrites that were not abruptly cut off, consistent impregnation along the full extent of the apical dendrites, and relative isolation from neighboring impregnated neurons to avoid interference with tracing. These criteria are described by Vyas et al. (2002). Neurons identified for tracing had a pyramiform or pyriform soma and high density of spines on dendrites (McDonald et al., 2005). We traced the cell body and apical dendritic arbor of four pyramidal neurons per animal under the light microscope, using the Neurolucida program (MicroBrightField Inc., Williston, VT). A tertiary branch of the apical dendrite was identified and at 100× magnification, the spines on the branch were then traced. If there were more than one tertiary branch, the thinner one was chosen for better visualization of spines. As the dendritic trunk diminishes in width, the chance of the trunk obscuring the spines becomes minimal. For all of three branches traced per animal, we ensured that the branch and spines could be properly resolved. Neurolucida Explorer software package was used to analyze the reconstruction of the neuron using the built-in Sholl analysis option to quantify the number of dendritic crossings made with concentric spheres around the soma center with radii increasing in increments of 20 μm. Spine density on the tertiary branch was calculated using the built-in Branched analysis option in Neurolucida Explorer.
Statistical analyses
Statistical analyses were performed using the software Statistica (version 10), IBM SPSS Statistics (version 21), and Matlab (version 2010b). Kolmogorov–Smirnov, Lilliefors, and Shapiro–Wilk’s W tests were used to test whether data were of normal distribution. For normal data, unpaired t-test was used to determine significance of difference in the means of groups. For non-normal data, the Mann–Whitney U (MWU) test was used to test the difference between the distributions.
Photomicrograph production procedures
The digital EM images were captured using a Hamamatsu CCD camera and software produced by AMT, were then adjusted with Adobe Photoshop (CS6; Adobe Systems, San Jose, CA). Adjustments were made for matching the contrast and brightness of one digital image to another within a single figure. Adobe Photoshop was used for cropping the image and for adding text and arrows. For producing the photomontage in Figure 6 panel A, Neurolucida software was used to capture a stack of 13 images of a golgi-stained pyramidal neuron at different depths. The stack was then opened in Image J software (NIH version 1.45s) for conversion to 13 separate images. Adobe Photoshop was used to piece together different sections of the neuron as seen clearly in the separate images.
Fig. 6.
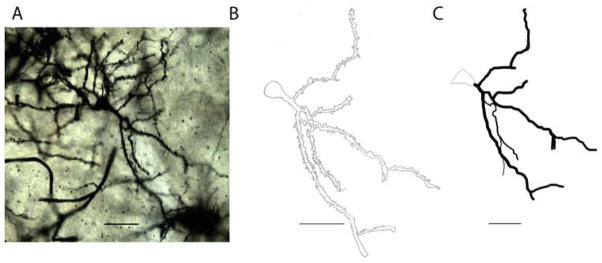
Depictions of a typical densely spiny, pyramidal-like neuron from the amygdala of a CON animal. Panel A is a photomontage of the neuron created by piecing together its different sections as seen clearly in 13 separate images captured at different depths. Panel B is a camera lucida drawing of the neuron. Panel C is a reconstruction of the neuron traced under the light microscope using the Neurolucida software. Scale bars =50 μm.
RESULTS
Behavioral data
The behavioral data for these animals were previously published in a study examining GABARs in hippocampal CA1 (Aoki et al., 2012). In brief, ABA animals showed a fivefold increase in running wheel activity by the second day of restricted food access (P42), and a 17.9 % weight loss by the fourth day in the ABA-inducing environment (P44).
α4-immunoreactivity at axo-spinous synapses in the basal amygdala of ABA animals
Quantitative electron microscopic immunocytochemistry showed no change evoked by ABA in the expression of α4 subunits inside dendritic spines or at the plasma membrane adjacent to asymmetric synapses on dendritic spines (Fig. 3). This pattern was observed for the rostral amygdala of all three animals (P-values of 0.46 intracellularly and 0.6 at the membrane) as well as the amygdala (P-values of 0.39 intracellularly and 0.26 at the membrane). Because there was individual variation in the wheel running activity among the ABA animals, we also examined whether this behavior showed any relationship with the extent of plasmalemmal expression of α4 subunit at spines. Food restriction-induced hyperactivity of the animals was quantified as the increase in wheel activity on the third day after food restriction compared to one day before food restriction. α4 subunit expression for a single animal was computed as a proportion of spines immunolabeled at the membrane, out of the 160 spines sampled from the tissue of each animal. Mean value per animal with the SEM value enclosed in brackets were as follows: ABA group 0.312 (0.15), 0.25 (0.11), 0.062 (0.062), 0.25 (0.11); CON group 0 (0), 0.5 (0.15), 0.125 (0.125), 0 (0). However, no relationship was apparent between the severity of the hyperactivity and the level of α4 subunit expression at spines. The presence of spines is a strong indication that the postsynaptic neuron is an excitatory pyramidal neuron (McDonald, 1982; McDonald et al., 2002; Millhouse and DeOlmos, 1983). We confirmed this for the amygdala by examining 127 spines and quantifying the proportion that were immunopositive for GABA. We found nine spines to be labeled positive for DAB and hence for GABA, indicating that the great majority of spines belonged to excitatory neurons.
Fig. 3.

Comparisons of immunoreactivity for the α4 subunit within dendritic spines of the rostral and amygdala of females following 4 days of treatment. We compared the levels of α4 immunoreactivity (-ir) in the rostral and amygdala from brains of control animals (CON; n = 4), and activity-based anorexia animals (ABA; n =4). The proportion of α4-ir spine profiles encountered was measured. To this end, for every group of 10 spines that was randomly encountered, the number of spine profiles immunolabeled at the plasma membrane was assessed. This assessment of the proportion of spine profiles labeled was repeated 16 times for a single source of tissue, to obtain a mean value of 16 assessments, representing the analysis of 160 spine profiles. Any single spine profile was categorized as labeled at the membrane, so long as it contained one or more SIG particles at the plasma membrane. The 16 assessments from each animal were pooled group-wise, resulting in 64 values in each group for the rostral and caudal amygdala (four animals per group). In a parallel manner, we also measured the proportion of spine profiles immunolabeled intracellularly for the α4 subunit. As described for the membranous label analysis, an assessment of 160 spines per animal yielded 64 values in each group for the rostral and caudal amygdala (four animals per group). There was no difference between the groups by Mann–Whitney U test, either in the membrane counts (Panel A) or intra-cellular counts (Panel B). Error bars denote standard errors of the mean.
α4-immunoreactivity at asymmetric dendritic shaft synapses in the basal amygdala of ABA animals
Dendritic shafts of the amygdala of ABA tissue that were postsynaptic to excitatory synapses exhibited enhanced α4 immunoreactivity at the plasma membrane as well as intracellularly (Fig. 4) (P <0.0002 for the plasmalemmal and intracellular immunoreactivity by Mann–Whitney U test). The increased membranous expression was seen on three out of the four ABA animals. The decrease in the α4 expression in the one animal that did not increase α4 labeling could have been because of the state of severe undernutrition, as it lost 31.9% of body weight, in contrast to the other three that lost 12.6%, 13.0%, and 14.2%.
Fig. 4.

Comparisons of levels of α4-immunoreactivity of the rostral and amygdala of females following 4 days of ABA versus CON on and within postsynaptic dendritic shafts. Dendritic shafts postsynaptic to excitatory synapses were identified and their perimeter and area were measured. Panels A and B show membranous labeling from the amygdala (Panel A) and from the amygdala (Panel B). The number of SIG particles per unit membrane was quantified and plotted as a histogram of the number of dendritic profiles with different densities of SIG particles on the membrane. The ABA and CON distributions are significantly different by the Mann–Whitney U test in the amygdala (P =0.002) but not so in the rostral BA. Panels C and D show data from the cytoplasm of rostral and caudal BA, respectively. The number of SIG particles per unit area of dendritic shaft cytoplasm was quantified and plotted as a histogram. The ABA and CON distributions are significantly different by the Mann–Whitney U test in the amygdala (P <10−6) but not so in the amygdala (P =0.27). The dendrite shown in figure B is in the column labeled 0.2 SIG per nm × 10−3 in the top right panel and in the column labeled 10 SIG per nm2 × 10−6 in the bottom right panel.
The enhanced immunoreactivity within the synaptic neuropil of ABA tissue was detectable using two measures: increased proportion of dendrites labeled and increased density of α4 expression. These increases were evident for the intracellular compartments of dendritic profiles as well as the plasma membrane. This pattern can be seen by comparing the number of nonlabeled dendrites in Figure 4, Panels B and D, showing the distribution of immunolabeled profiles in the membranous and intracellular domains of the basal amygdala at the caudal level. Few of the dendrites within the ABA tissue were devoid of SIG particles along the plasma membrane, indicating an increase in the proportion of labeled dendrites. The increased density of α4 expression is shown in the same graph, indicating proportionally more of ABA dendrites containing 0.1, 0.2, or 1 SIG particle per nm × 10−3. Similarly, for the intracellular compartment of dendritic profiles, fewer of the ABA dendrites are devoid of SIG particles and more of them contain 1, 5, or 10 SIG per nm2 × 10−6.
This enhancement was not seen in the basal amygdala at the rostral level, either on the plasma membrane (Fig. 4 Panel A; P =0.2) or intracellularly (Panel C; P =0.27)
Earlier studies have shown that almost all inhibitory interneurons of the basal amygdala lack dendritic spines (McDonald, 1982; Millhouse and DeOlmos, 1983) and that pyramidal neurons receive excitatory inputs almost exclusively at dendritic spine heads (Muller et al., 2006). These two anatomical findings would lead to the supposition that dendritic shafts receiving asymmetric inputs belong to inhibitory interneurons. To verify that dendritic profiles with asymmetric synapses on dendritic shafts belong to inhibitory neurons, we examined the amygdala from brain tissue immunolabeled for GABA. Out of the 25 dendritic shafts postsynaptic to excitatory synapses sampled (Fig. 5), 22 were labeled positively for DAB and hence for GABA, indicating that they belonged to inhibitory interneurons. Because the great majority of dendritic shafts postsynaptic to excitatory synapses belonged to inhibitory neurons, we conclude that the enhanced α4 immunoreactivity at the plasma membrane of dendritic shafts in amygdala is observed mostly in inhibitory neurons.
Fig. 5.
Dendritic structure of pyramidal neurons of amygdala
Morphometric analysis of tissue stained by the golgi method was used to assess dendritic lengths of pyramidal neurons. Four neurons from each animal and three animals from each group were included in the analysis. An example of a photomontage, camera lucida drawing, and neurolucida tracing of a typical pyramidal neuron in the basal amygdale, shown in Figure 6, while Figure 7 contains the reconstructed tracings of all neurons used in the Sholl analysis. The number of dendritic branches at increasing distances from the soma was compared between the ABA and CON animals. Unpaired t-test revealed the following P-values at increasing distances from the soma: P =0.18 at 20 μm from the soma, 0.22 at 40 μm, 0.42 at 60 μm, 0.31 at 80 μm, 0.93 at 100 μm, 0.38 at 120 μm, 1.0 at 140 μm, and 0.22 at 160 μm. In short, ABA and CON animals did not differ in the number of branches at any of the analyzed distances from the soma (Fig. 8 panel A). The total dendritic length was also not different between the two groups (P =0.42 by t-test). Furthermore, spine density on three tertiary branches per animal in each of three animals per group was not different between the groups (Fig. 8 panel B; P =0.5 by t-test).
Fig. 7.

Reconstructed tracings of all neurons included in the Sholl analysis. Panel A which includes the top two rows depicts tracings of neurons from CON animals. Panel B which includes the bottom two rows includes the tracings of neurons from ABA animals. Scale bar =50 μm.
Fig. 8.

Effects of four days of ABA treatment on densely spiny, pyramidal-like neurons in the amygdala. Four neurons from each of the three animals per group were analyzed. Panel A shows the number of branches of the apical dendrite along its length. There was no statistically significant difference between the branching of the ABA and CON neurons by t-test. Panel B shows the spine density of a tertiary branch of the apical dendrite of three neurons from each of three animals per group. ABA and CON showed no difference in the spine density by t-test. Error bars denote standard error of the mean. Panel C shows a neuron traced under the light microscope with concentric spheres centered on the soma as a 3D reconstruction using Neurolucida software. The dendritic arbor was characterized by the intersections it makes with each concentric sphere. The primary dendrite is colored red, the secondary dendrites purple, and tertiary dendrites green. The tertiary dendrite was also used for tracing spines to measure spine density. Scale bar = 50 μm.
DISCUSSION
The GABAergic system is a target for anxiolytics such as benzodiazepines and neurosteroids (O’Donnell and Shelton, 2010; Shen et al., 2007) and is of potential interest, given the comorbidity of AN and anxiety disorders. Our previous work demonstrated increased expression of α4 and δ subunits of GABAR in hippocampal CA1 spines of ABA rats, thus reflecting increased inhibition of the pyramidal neurons (Aoki et al., 2012; Benke et al., 1997). Here, we examined the expression of α4 subunit of GABAR in the amygdala, given its role in anxiety.
GABA immunocytochemistry revealed that, in most cases, the postsynaptic neurons receiving asymmetric synapses on its dendritic shafts are inhibitory. The increased expression of α4-containing GABAR subunits selectively near axo-dendritic excitatory synaptic inputs could result in shunting inhibition of the post-synaptic sites, most of which are likely to be GABAergic neurons. Assuming no other changes, this will reduce inhibition of the pyramidal neurons (Fig. 9). Additionally, there is an increase in the intracellular density of the α4-containing GABAR subunits, reflecting a greater pool available for membrane insertion. Combined with the unchanged level of α4-containing GABAR subunits near excitatory axo-spinous synapses which belong to pyramidal neurons, this could render the basal amygdalar pyramidal neurons more excitable. This change is opposite in sign to the increase in α4 and δ subunits expression we observed in hippocampal CA1 of ABA rats (Aoki et al., 2012). These opposing changes are possibly related to the opposite ways in which the amygdala and hippocampus regulate the hypothalamus–pituitary–adrenal gland (HPA) axis activation in stress. The basal amygdala activates the HPA, whereas the hippocampus gives negative feedback to the HPA axis (Franklin et al., 2012). If the hippocampus were less excitable and the basal amygdala more excitable, the two structures would work in concert to elevate activation of the HPA axis in a stressful situation, leading to a heightened response to stress. Future studies will examine whether there are compensatory reductions in inhibitory inputs to the interneurons.
Fig. 9.

Schematic showing the circuitry of the amygdala (BA). The BA receives direct and indirect sensory input and plays a role in the response to stress via direct or indirect projections to the hypothalamus and hippocampus and in feeding behavior via its projection to the medial shell of the nucleus accumbens (AcbS). The interneuron, denoted as I, provides inhibition to the pyramidal neuron, P, in the BA. Our findings suggest that α4βδ-GABAA receptor expression near axo-dendritic synapses is increased by activity-based anorexia (ABA) (shown as small blue dots). Asymmetric synapses onto dendritic shafts are mostly on interneurons. The α4 expression near axo-spinous synapses on pyramidal neurons did not change. Our model on the right panel proposes that the combination of these two effects produces less inhibition in the pyramidal neurons, leading to an increased anxiety state and decreased feeding. Previously, we have shown that α4 expression near axo-spinous synapses in the hippocampus increases in ABA animals. This is also shown in the figure, as a possible decrease in negative regulation of the hypothalamus.
Morphologically, we do not see a difference in the branching pattern of the apical dendrites of densely spiny, pyramidal-like neurons in the amygdala between the ABA and control animals. It is possible that alteration in dendritic structure in the amygdala is evident only after a delay following the stress or biological simulation of stress (Mitra and Sapolsky, 2008; Vyas et al., 2004). Future studies will examine amygdalar structure following a recovery period after ABA.
We studied the rostral and caudal basal amygdala separately because of their different connections to other brain regions. One important distinction between them is their differential projection to the nucleus accumbens shell (AcbS): the amygdala projects to the dorsal part of the medial AcbS, while the amygdala projects to the ventral part of the caudal AcbS and less to the dorsomedial AcbS (Wright et al., 1996). The medial AcbS is an important region for increasing the amount of food intake and contains the region that amplifies the liking sensation for food reward (Kelley and Swanson, 1997; van der Plasse et al., 2012). We propose that the induced starvation of ABA that results in hyperactivity causes the amygdalar changes described here. Furthermore, the increase in the α4 subunits of the GABAA receptors in the inter-neurons of the amygdala could contribute towards increased excitability of the pyramidal neurons of the amygdala, which in turn, might increase excitation of the medial AcbS. This increase in activity of the medial shell could lead to reduction of food intake (Maldonado-Irizarry et al., 1995; Kelley and Swanson, 1997). The self-starvation that follows the hyperactivity and induced starvation in ABA could be prevented by reducing the increased outflow from the amygdala to the medial AcbS. This highlights the importance of future studies that examine the role of the Acb, given its role in reward signaling and that some individuals with AN find food stimuli aversive and self-starvation and excessive exercise rewarding (Keating et al., 2012).
Considering the comorbidity between AN and anxiety and the role of the amygdala in mediating anxiety, we hypothesized that the basal amygdala might be a critical brain region altered by starvation and hyperactivity in the ABA model. Our findings support this hypothesis and delineate the α4-containing GABAR as the species of ligand-gated GABARs that may be useful to target for the treatment of self-starvation that follows the induced starvation in ABA. These species are insensitive to benzodiazepines (Benke et al., 1996), making it important to investigate nonbenzodiazepine anxiolytics, such as neurosteroids, as potential pharmacotherapeutic agents in self-starvation and likely, in AN.
Acknowledgments
Contract grant sponsor: ; Contract grant number: R21MH091445-01; Contract grant sponsor: Klarman Family Foundation Grant Program in Eating Disorders Research; Contract grant numbers: 1R01NS066019-01A1, 2R01NS047557-07A1 and P30 EY13079, 1R25GM097634-01 (BP-ENDURE).
The authors thank Jung-Yun Min for her help with electron microscopic image acquisition. They thank Thomas Chan for his help with morphological neuronal tracing. They thank Kevin Laurino and Anna Rita Colacino for their help with animal handling.
References
- Adamec R, Hebert M, Blundell J, Mervis RF. Dendritic morphology of amygdala and hippocampal neurons in more and less predator stress responsive rats and more and less spontaneously anxious handled controls. Behav Brain Res. 2012;226:133–146. doi: 10.1016/j.bbr.2011.09.009. [DOI] [PMC free article] [PubMed] [Google Scholar]
- Aigner M, Treasure J, Kaye W, Kasper S Disorders WTFOE. World Federation of Societies of Biological Psychiatry (WFSBP) guidelines for the pharmacological treatment of eating disorders. World J Biol Psychiatry. 2011;12:400–443. doi: 10.3109/15622975.2011.602720. [DOI] [PubMed] [Google Scholar]
- Aoki C, Sabaliauskas N, Chowdhury T, Min JY, Colacino AR, Laurino K, Barbarich-Marsteller NC. Adolescent female rats exhibiting activity-based anorexia express elevated levels of GABA(A) receptor alpha4 and delta subunits at the plasma membrane of hippocampal CA1 spines. Synapse. 2012;66:391–407. doi: 10.1002/syn.21528. [DOI] [PMC free article] [PubMed] [Google Scholar]
- Bannai C, Kuzuya N, Koide Y, Fujita T, Itakura M, Kawai K, Yamashita K. Assessment of the relationship between serum thyroid hormone levels and peripheral metabolism in patients with anorexia nervosa. Endocrinol Jpn. 1988;35:455–462. doi: 10.1507/endocrj1954.35.455. [DOI] [PubMed] [Google Scholar]
- Bannerman D, Rawlins J, McHugh S, Deacon R, Yee B, Bast T, Zhang W-N, Pothuizen H, Feldon J. Regional dissociations within the hippocampus—Memory and anxiety. Neurosc Biobehav Rev. 2004;28:273–283. doi: 10.1016/j.neubiorev.2004.03.004. [DOI] [PubMed] [Google Scholar]
- Barbarich-Marsteller NC. Activity-based anorexia in the rat. In: Avena NM, editor. Animal models of eating disorders. New York: Humana Press; 2012. pp. 281–290. [Google Scholar]
- Barbarich-Marsteller NC, Laurino K, Colacino AR. Pharmacological treatments for anorexia nervosa. In: Barbarich-Marsteller N, editor. Anorexia nervosa: Symptoms, treatment, and neurobiology. New York: Nova Science Publishers; 2012. pp. 97–117. [Google Scholar]
- Barnard EA, Skolnick P, Olsen RW, Mohler H, Sieghart W, Biggio G, Braestrup C, Bateson AN, Langer SZ. International Union of Pharmacology. XV. Subtypes of gamma-aminobutyric acidA receptors: Classification on the basis of subunit structure and receptor function. Pharmacol Rev. 1998;50:291–313. [PubMed] [Google Scholar]
- Benke D, Honer M, Michel C, Mohler H. GABAA receptor subtypes differentiated by their gamma-subunit variants: Prevalence, pharmacology and subunit architecture. Neuropharmacology. 1996;35:1413–1423. doi: 10.1016/s0028-3908(96)00068-8. [DOI] [PubMed] [Google Scholar]
- Benke D, Michel C, Mohler H. GABA(A) receptors containing the alpha4-subunit: Prevalence, distribution, pharmacology, and subunit architecture in situ. J Neurochem. 1997;69:806–814. doi: 10.1046/j.1471-4159.1997.69020806.x. [DOI] [PubMed] [Google Scholar]
- Birmingham CL, Su J, Hlynsky JA, Goldner EM, Gao M. The mortality rate from anorexia nervosa. Int J Eating Disord. 2005;38:143–146. doi: 10.1002/eat.20164. [DOI] [PubMed] [Google Scholar]
- Brandys MK, Kas MJ, van Elburg AA, Campbell IC, Adan RA. A meta-analysis of circulating BDNF concentrations in anorexia nervosa. World J Biol Psychiatry. 2011;12:444–454. doi: 10.3109/15622975.2011.562244. [DOI] [PubMed] [Google Scholar]
- Bulik CM, Slof-Op’t Landt MC, van Furth EF, Sullivan PF. The genetics of anorexia nervosa. Annu Rev Nutr. 2007;27:263–275. doi: 10.1146/annurev.nutr.27.061406.093713. [DOI] [PubMed] [Google Scholar]
- Carter AG, Soler-Llavina GJ, Sabatini BL. Timing and location of synaptic inputs determine modes of subthreshold integration in striatal medium spiny neurons. J Neurosci. 2007;27:8967–8977. doi: 10.1523/JNEUROSCI.2798-07.2007. [DOI] [PMC free article] [PubMed] [Google Scholar]
- Epling WF, Pierce WD. Theory, research, and treatment. Mahwah: Lawrence Erlbaum Associates; 1996. Activity anorexia. [Google Scholar]
- Epling WF, Pierce WD, Stefan L. A theory of activity—Based anorexia. Int J Eating Disord. 1983;3:27–46. [Google Scholar]
- Farrant M, Nusser Z. Variations on an inhibitory theme: Phasic and tonic activation of GABA(A) receptors. Nat Rev Neurosci. 2005;6:215–229. doi: 10.1038/nrn1625. [DOI] [PubMed] [Google Scholar]
- Franklin TB, Saab BJ, Mansuy IM. Neural mechanisms of stress resilience and vulnerability. Neuron. 2012;75:747–761. doi: 10.1016/j.neuron.2012.08.016. [DOI] [PubMed] [Google Scholar]
- Frick A, Magee JD. LTP is accompanied by an enhanced local excitability of pyramidal neuron dendrites. Nat Neurosci. 2004;7:126–135. doi: 10.1038/nn1178. [DOI] [PubMed] [Google Scholar]
- Fuller T, Russchen F, Price J. Sources of presumptive glutamergic/aspartergic afferents to the rat ventral striatopallidal region. J Comparative Neurol. 1987;258:317–338. doi: 10.1002/cne.902580302. [DOI] [PubMed] [Google Scholar]
- Gelegen C, van den Heuvel J, Collier DA, Campbell IC, Oppelaar H, Hessel E, Kas MJ. Dopaminergic and brain-derived neurotrophic factor signalling in inbred mice exposed to a restricted feeding schedule. Genes Brain Behav. 2008;7:552–559. doi: 10.1111/j.1601-183X.2008.00394.x. [DOI] [PubMed] [Google Scholar]
- Golden NH, Shenker IR. Amenorrhrea in anorexia nervosa: Etiology and implications. Adolesc Med. 1992;3:503–518. [PubMed] [Google Scholar]
- Golden NH, Shenker IR. Amenorrhea in anorexia nervosa. Neuroendocrine control of hypothalamic dysfunction. Int J Eating Disord. 1994;16:53–60. doi: 10.1002/1098-108x(199407)16:1<53::aid-eat2260160105>3.0.co;2-v. [DOI] [PubMed] [Google Scholar]
- Groenewegen HJ, Wright CI, Beijer AV, Voorn P. Convergence and segregation of ventral striatal inputs and outputs. Ann N Y Acad Sci. 1999;877:49–63. doi: 10.1111/j.1749-6632.1999.tb09260.x. [DOI] [PubMed] [Google Scholar]
- Gulinello M, Orman R, Smith SS. Sex differences in anxiety, sensorimotor gating and expression of the alpha4 subunit of the GABAA receptor in the amygdala after progesterone withdrawal. Eur J Neurosci. 2003;17:641–648. doi: 10.1046/j.1460-9568.2003.02479.x. [DOI] [PMC free article] [PubMed] [Google Scholar]
- Hakansson ML, Brown H, Ghilardi N, Skoda RC, Meister B. Leptin receptor immunoreactivity in chemically defined target neurons of the hypothalamus. J Neurosci. 1998;18:559–572. doi: 10.1523/JNEUROSCI.18-01-00559.1998. [DOI] [PMC free article] [PubMed] [Google Scholar]
- Hall JF, Hanford PV. Activity as a function of a restricted feeding schedule. J Comp Physiol Psychol. 1954;47:362–363. doi: 10.1037/h0060276. [DOI] [PubMed] [Google Scholar]
- Jolkkonen E, Kemppainen S. Anatomic heterogeneity of the rat amygdaloid complex. Folia Morphol. 2000;59:1–0. [PubMed] [Google Scholar]
- Joos AA, Saum B, van Elst LT, Perlov E, Glauche V, Hartmann A, Freyer T, Tuscher O, Zeeck A. Amygdala hyperreactivity in restrictive anorexia nervosa. Psychiatry Res. 2011;191:189–195. doi: 10.1016/j.pscychresns.2010.11.008. [DOI] [PubMed] [Google Scholar]
- Kaye W. Neurobiology of anorexia and bulimia nervosa. Physiol Behav. 2008;94:121–135. doi: 10.1016/j.physbeh.2007.11.037. [DOI] [PMC free article] [PubMed] [Google Scholar]
- Kaye WH, Barbarich NC, Putnam K, Gendall KA, Fernstrom J, Fernstrom M, McConaha CW, Kishore A. Anxiolytic effects of acute tryptophan depletion in anorexia nervosa. Int J Eating Disord. 2003;33:257–267. doi: 10.1002/eat.10135. discussion 268–270. [DOI] [PubMed] [Google Scholar]
- Kaye WH, Bulik CM, Thornton L, Barbarich N, Masters K. Comorbidity of anxiety disorders with anorexia and bulimia nervosa. Am J Psychiatry. 2004;161:2215–2221. doi: 10.1176/appi.ajp.161.12.2215. [DOI] [PubMed] [Google Scholar]
- Keating C, Tilbrook AJ, Rossell SL, Enticott PG, Fitzgerald PB. Reward processing in anorexia nervosa. Neuropsychologia. 2012;50:567–575. doi: 10.1016/j.neuropsychologia.2012.01.036. [DOI] [PubMed] [Google Scholar]
- Kelley AE, Swanson CJ. Feeding induced by blockade of AMPA and kainate receptors within the ventral striatum: A microinfusion mapping study. Behav Brain Res. 1997;89:107–113. doi: 10.1016/s0166-4328(97)00054-5. [DOI] [PubMed] [Google Scholar]
- Kishi T, Tsumori T, Yokota S, Yasui Y. Topographical projection from the hippocampal formation to the amygdala: A combined anterograde and retrograde tracing study in the rat. J Comp Neurol. 2006;496:349–368. doi: 10.1002/cne.20919. [DOI] [PubMed] [Google Scholar]
- Losonczy A, Makara JK, Magee JC. Compartmentalized dendritic plasticity and input feature storage in neurons. Nature. 2008;452:436–441. doi: 10.1038/nature06725. [DOI] [PubMed] [Google Scholar]
- Maldonado-Irizarry CS, Swanson CJ, Kelley AE. Glutamate receptors in the nucleus accumbens shell control feeding behavior via the lateral hypothalamus. J Neurosci. 1995;15:6779–6788. doi: 10.1523/JNEUROSCI.15-10-06779.1995. [DOI] [PMC free article] [PubMed] [Google Scholar]
- Mantzoros C, Flier JS, Lesem MD, Brewerton TD, Jimerson DC. Cerebrospinal fluid leptin in anorexia nervosa: Correlation with nutritional status and potential role in resistance to weight gain. J Clin Endocrinol Metab. 1997;82:1845–1851. doi: 10.1210/jcem.82.6.4006. [DOI] [PubMed] [Google Scholar]
- Matsuzaki M, Honkura N, Ellis-Davies GC, Kasai H. Structural basis of long-term potentiation in single dendritic spines. Nature. 2004;429:761–766. doi: 10.1038/nature02617. [DOI] [PMC free article] [PubMed] [Google Scholar]
- McDonald AJ. Neurons of the lateral and basolateral amygdaloid nuclei: A golgi study in the rat. J Comp Neurol. 1982;212:20. doi: 10.1002/cne.902120307. [DOI] [PubMed] [Google Scholar]
- McDonald AJ. Glutamate and aspartate immunoreactive neurons of the rat basolateral amygdala: Colocalization of excitatory amino acids and projections to the limbic circuit. J Comp Neurol. 1996;365:367–379. doi: 10.1002/(SICI)1096-9861(19960212)365:3<367::AID-CNE3>3.0.CO;2-2. [DOI] [PubMed] [Google Scholar]
- McDonald AJ, Mascagni F, Mania I, Rainnie DG. Evidence for a perisomatic innervation of parvalbumin-containing inter-neurons by individual pyramidal cells in the basolateral amygdala. Brain Res. 2005;1035:32–40. doi: 10.1016/j.brainres.2004.11.052. [DOI] [PubMed] [Google Scholar]
- McDonald AJ, Muller JF, Mascagni F. GABAergic innervation of alpha type II calcium/calmodulin-dependent protein kinase immunoreactive pyramidal neurons in the rat basolateral amygdala. J Comp Neurol. 2002;446:199–218. doi: 10.1002/cne.10204. [DOI] [PubMed] [Google Scholar]
- McHugh SB, Fillenz M, Lowry JP, Rawlins JN, Bannerman DM. Brain tissue oxygen amperometry in behaving rats demonstrates functional dissociation of dorsal and ventral hippocampus during spatial processing and anxiety. Eur J Neurosci. 2011;33:322–337. doi: 10.1111/j.1460-9568.2010.07497.x. [DOI] [PMC free article] [PubMed] [Google Scholar]
- Millhouse O, DeOlmos J. Neuronal configurations in lateral and basolateral amygdala. Neuroscience. 1983;10:1269–1300. doi: 10.1016/0306-4522(83)90112-4. [DOI] [PubMed] [Google Scholar]
- Mitra R, Sapolsky RM. Acute corticosterone treatment is sufficient to induce anxiety and amygdaloid dendritic hypertrophy. Proc Natl Acad Sci U S A. 2008;105:5573–5578. doi: 10.1073/pnas.0705615105. [DOI] [PMC free article] [PubMed] [Google Scholar]
- Muller JF, Mascagni F, McDonald AJ. Pyramidal cells of the rat basolateral amygdala: Synaptology and innervation by parvalbumin-immunoreactive interneurons. J Comp Neurol. 2006;494:635–650. doi: 10.1002/cne.20832. [DOI] [PMC free article] [PubMed] [Google Scholar]
- Nakazato M, Hashimoto K, Shimizu E, Niitsu T, Iyo M. Possible involvement of brain-derived neurotrophic factor in eating disorders. IUBMB life. 2012;64:355–361. doi: 10.1002/iub.1012. [DOI] [PubMed] [Google Scholar]
- Nedelescu H, Kelso CM, Lazaro-Munoz G, Purpura M, Cain CK, Ledoux JE, Aoki C. Endogenous GluR1-containing AMPA receptors translocate to asymmetric synapses in the lateral amygdala during the early phase of fear memory formation: an electron microscopic immunocytochemical study. J Comp Neurol. 2010;518:4723–4739. doi: 10.1002/cne.22472. [DOI] [PMC free article] [PubMed] [Google Scholar]
- O’Donnell JM, Shelton RC. Drug therapy of depression and anxiety disorders. In: Brunton LL, editor. Goodmand and Gilman’s the pharmacological basis of therapeutics. McGraw-Hill Professional; 2010. [Google Scholar]
- Ono T, Luiten PG, Nishijo H, Fukuda M, Nishino H. Topographic organization of projections from the amygdala to the hypothalamus of the rat. Neurosci Res. 1985;2:221–238. doi: 10.1016/0168-0102(85)90002-1. [DOI] [PubMed] [Google Scholar]
- Paxinos G, Watson C. The rat brain in stereotaxic coordinates. Academic Press; 2006. [DOI] [PubMed] [Google Scholar]
- Powers PS, Bruty H. Pharmacotherapy for eating disorders and obesity. Child Adolesc Psychiatric Clin N Am. 2009;18:175–187. doi: 10.1016/j.chc.2008.07.009. [DOI] [PubMed] [Google Scholar]
- Quirk GJ, Mueller D. Neural mechanisms of extinction learning and retrieval. Neuropsychopharmacology. 2008;33:56–72. doi: 10.1038/sj.npp.1301555. [DOI] [PMC free article] [PubMed] [Google Scholar]
- Riddle MC, McKenna MC, Yoon YJ, Pattwell SS, Santos PM, Casey BJ, Glatt CE. Caloric restriction enhances fear extinction learning in mice. Neuropsychopharmacology. 2013 doi: 10.1038/npp.2012.268. [DOI] [PMC free article] [PubMed] [Google Scholar]
- Routtenberg A, Kuznesof AW. Self-starvation of rats living in activity wheels on a restricted feeding schedule. J Comp Physiol Psychol. 1967;64:414–421. doi: 10.1037/h0025205. [DOI] [PubMed] [Google Scholar]
- Shen H, Gong QH, Aoki C, Yuan M, Ruderman Y, Dattilo M, Williams K, Smith SS. Reversal of neurosteroid effects at alpha4beta2delta GABAA receptors triggers anxiety at puberty. Nat Neurosci. 2007;10:469–477. doi: 10.1038/nn1868. [DOI] [PMC free article] [PubMed] [Google Scholar]
- Shen H, Sabaliauskas N, Sherpa A, Fenton AA, Stelzer A, Aoki C, Smith SS. A critical role for alpha4betadelta GABAA receptors in shaping learning deficits at puberty in mice. Science. 2010;327:1515–1518. doi: 10.1126/science.1184245. [DOI] [PMC free article] [PubMed] [Google Scholar]
- Smith SS, Shen H, Gong QH, Zhou X. Neurosteroid regulation of GABA(A) receptors: Focus on the alpha4 and delta subunits. Pharmacol Ther. 2007;116:58–76. doi: 10.1016/j.pharmthera.2007.03.008. [DOI] [PMC free article] [PubMed] [Google Scholar]
- Sullivan PF. Mortality in anorexia nervosa. Am J Psychiatry. 1995;152:1073–1074. doi: 10.1176/ajp.152.7.1073. [DOI] [PubMed] [Google Scholar]
- van der Plasse G, Schrama R, van Seters SP, Vanderschuren LJ, Westenberg HG. Deep brain stimulation reveals a dissociation of consummatory and motivated behaviour in the medial and lateral nucleus accumbens shell of the rat. PloS ONE. 2012;7:e33455. doi: 10.1371/journal.pone.0033455. [DOI] [PMC free article] [PubMed] [Google Scholar]
- Vyas A, Mitra R, Shankaranarayana Rao BS, Chattarji S. Chronic stress induces contrasting patterns of dendritic remodeling in hippocampal and amygdaloid neurons. J Neurosci. 2002;22:6810–6818. doi: 10.1523/JNEUROSCI.22-15-06810.2002. [DOI] [PMC free article] [PubMed] [Google Scholar]
- Vyas A, Pillai AG, Chattarji S. Recovery after chronic stress fails to reverse amygdaloid neuronal hypertrophy and enhanced anxiety-like behavior. Neuroscience. 2004;128:667–673. doi: 10.1016/j.neuroscience.2004.07.013. [DOI] [PubMed] [Google Scholar]
- Wright CI, Beijer AV, Groenewegen HJ. Basal amygdaloid complex afferents to the rat nucleus accumbens are compartmentally organized. J Neurosci. 1996;16:1877–1893. doi: 10.1523/JNEUROSCI.16-05-01877.1996. [DOI] [PMC free article] [PubMed] [Google Scholar]
- Yuste R, Denk W. Dendritic spines as basic functional units of neuronal integration. Nature. 1995;375:682–684. doi: 10.1038/375682a0. [DOI] [PubMed] [Google Scholar]