

Abstract
Exploiting changes in welfare policy across states and over time and comparing relevant population subgroups within an econometric difference-in-differences framework, we estimate the effects of welfare reform on adult women's illicit drug use from 1992 to 2002, the period during which welfare reform unfolded in the U.S. The analyses are based on all available and appropriate national datasets, each offering unique strengths and measuring a different drug-related outcome. We investigate self-reported illicit drug use (from the National Household Surveys on Drug Abuse and National Surveys on Drug Use and Health), drug-related prison admissions (from the National Corrections Reporting Program), drug-related arrests (from Federal Bureau of Investigation Uniform Crime Reports), and drug-related emergency department episodes (from the Drug Abuse Warning Network). We find robust evidence that welfare reform led to a 10-21% decline in illicit drug use among women at risk of relying on welfare, as well as associated declines in drug-related arrests (6-7%), drug-related hospital emergency department episodes (7-11%), and possibly drug-related prison admissions (11-19%). The findings indicate that an appropriately designed system with sufficient job opportunities for those are able to work can result in both increases in employment and decreases in drug use.
Introduction
The landmark Personal Responsibility and Work Opportunity Reconciliation Act (PRWORA) of 1996, often referred to as welfare reform, ended entitlement to welfare benefits under Aid to Families with Dependent Children (AFDC) and replaced the AFDC program with Temporary Assistance for Needy Families (TANF) block grants to states. Features of the legislation were time limits on cash assistance, work requirements as a condition for receiving benefits, and increased state latitude in establishing eligibility and program rules. Among the broad goals of PRWORA were to reduce dependence on government benefits by promoting work, encouraging marriage, and reducing non-marital childbearing.
Much research has evaluated the effects of welfare reform on employment, welfare caseloads, marital status, or fertility—outcomes that the reforms were intended to affect. Overall, the evidence indicates that welfare reform increased employment and decreased welfare caseloads, but had weak or mixed effects on family structure. Few studies have investigated the effects of welfare reform on behaviors, such as illicit drug use, that economic theory suggests may be affected by the policy shift. Exploiting changes in welfare policy across states and over time and comparing relevant population subgroups within an econometric difference-in-differences framework, we estimate the effects of welfare reform on adult women's illicit drug use from 1992 to 2002, the period during which welfare reform unfolded. The analyses are based on multiple datasets, each offering unique strengths and measuring a different drug-related outcome. We investigate self-reported illicit drug use (from the National Household Surveys on Drug Abuse and National Surveys on Drug Use and Health), drug-related prison admissions (from the National Corrections Reporting Program), drug-related arrests (from Federal Bureau of Investigation Uniform Crime Reports), and drug-related emergency department episodes (from the Drug Abuse Warning Network). The results, which are robust across different model specifications, comparison groups, and datasets that capture a range of drug-related outcomes reported by different entities, indicate that welfare reform led to declines in illicit drug use among women at risk of relying on welfare.
Background
Illicit Drug Use
Illicit drug use results in substantial costs to families and communities that include healthcare utilization, reduced productivity and unemployment, and criminal justice expenditures. Although illicit drug use declined substantially in the U.S. during the 1980s and 1990s, it has increased since then and represents an important public health problem and policy issue. In 1979, 14.1% of the U.S. population age 12 and older reported using illicit drugs in the past 30 days; that figure decreased to 6.3% in 1998, with the sharpest drop occurring between 1985 and 1990 (Office of National Drug Control Policy 2002). Since then, there has been a notable upward trend. Between 1992 and 2002, the period during which welfare reform unfolded, adult drug use increased by about 30%.1 The cost to society of illicit drug use has been estimated at $181 billion annually (Office of National Drug Control Policy 2004).
Welfare Reform
Although welfare reform is often dated to the landmark 1996 PRWORA legislation, reforms actually started taking place in the early 1990s when the Clinton Administration greatly expanded the use and scope of “welfare waivers” to allow states to carry out experimental or pilot changes to their AFDC programs, with random assignment required for evaluation. Waivers were approved in 43 states, ranging from modest demonstration projects to broad-based statewide programs, and constituted the first phase of welfare reform. Some waivers increased the amount of earnings that recipients were allowed to keep while maintaining welfare eligibility; others expanded work requirements to larger groups, established term limits for cash assistance, permitted states to issue sanctions to recipients who failed to meet work requirements, or allowed states to eliminate increases in benefits to families who had additional children while on welfare. Many policies and features of state waivers were later incorporated into PRWORA, which crystallized those diverse efforts into a focused national “work first” regime with time limits on the receipt of welfare, work requirements as a condition of receiving welfare, and stricter sanctions for non-compliance with program rules.
A key element of PRWORA was a 5 year lifetime limit on welfare receipt, with states having the flexibility to establish even shorter limits. State TANF programs vary considerably within the national guidelines imposed by PRWORA in terms of lifetime limits, fixed period time limits, welfare benefits before work is required, number of hours per week recipients are required to work, age of the youngest child when a mother becomes subject to work requirements, full family sanctions, exemptions from lifetime limits, and many other features.2
In terms of reducing caseloads, welfare reform has been a success; the consensus is that at least one-third of the caseload decline can be explained by welfare reform. At the same time, employment rates of low-skilled mothers rose dramatically (Ziliak 2006), and at least some of the increase was a result of welfare reform (Schoeni & Blank 2000). The effects on family structure were less dramatic. A large literature on the effects of welfare reform on marriage and a smaller one on cohabitation reveal mixed findings, and the literature on non-marital childbearing and female headship indicates slightly negative but inconsistent effects. Together, the findings suggest that the effects of welfare reform on family structure are complex.3
While welfare reform debates have focused on term limits, work requirements, and impacts on welfare rolls and employment, welfare reform has led to a fundamental shift in incentives and would be expected to have effects that are complex and multi-faceted. To gain a complete picture of the effects of welfare reform, it is necessary to look beyond the targeted outcomes of caseloads, employment, marriage, and fertility. Several empirically rigorous studies have gone in this direction by estimating effects of welfare reform on material hardship (e.g., Meyer & Sullivan 2004 and Winship & Jencks 2004, which found no deleterious effects), child well-being (e.g., Kaestner & Lee 2005, which found modest negative effects on prenatal care use and birth weight; review by Morris et al. 2005, which indicates some positive effects on child development; Bitler and Hoynes 2008, which found favorable, but mostly insignificant, effects on maternal depression and children's health and behavior; Leonard and Mas 2008, which found decreases in prenatal care and increases in infant mortality), child maltreatment (Paxson & Waldfogel 2002, which found mixed effects), health insurance coverage (e.g., DeLeire, Levine & Levy 2006; Kaestner & Kaushal 2003; Bitler, Gelbach & Hoynes 2005; and Cawley, Schroeder & Simon 2005, which revealed mixed results), and women's health and behaviors (e.g., Kaestner & Tarlov 2006, which found that welfare reform reduced binge drinking).
By linking cash assistance to work and making benefits time limited, welfare reform is likely to have affected the costs and benefits of using illicit drugs, as described later. The PRWORA legislation also included direct policies vis-à-vis illicit drug use. In particular, PRWORA denies TANF benefits, for life, to women who are convicted of a drug felony unless a state enacts legislation to modify or opt out of the lifetime drug sanction,4 and states can also test and sanction recipients for illicit drug use. These drug use policies under TANF would be expected to decrease drug use among mothers at risk of relying on welfare.
Welfare and Illicit Drug Use
A number of studies have investigated the relationship between welfare and women's drug use. Most, however, have explored the extent to which illicit drug use affects welfare participation rather than how welfare affects drug use. In a study that pre-dates PRWORA, Kaestner (1998), using data from the 1984 and 1988 surveys of the National Longitudinal Survey of Youth (NLSY), found that past year drug use significantly increased future welfare use, but that the effects were modest; the largest effect was for marijuana, a drug not generally associated with addiction. Also using data from the NLSY, but over a longer time period, Cheng & McElderry (2007) found no association between prior drug use and future welfare participation. Pollack et al. (2002) found that about 20% of women receiving TANF in the 1998 National Household Survey on Drug Abuse reported using drugs in the previous year. Meara (2006) found that women who use drugs exit the TANF rolls at about the same rate as women who do not use drugs. Thus, the existing literature indicates that most women on welfare do not use drugs and that drug use does not necessarily cause welfare participation. However, as welfare reform plays out, there could be negative effects of drug use on welfare participation since, as discussed earlier, some states test TANF recipients for illicit drugs and impose sanctions on those who test positive, and many impose a lifetime ban on benefits for women convicted of a drug felony (Rubinstein 2002 and GAO 2005 provide information on state TANF laws regarding drug use). Indeed, substance use is more common among welfare recipients who are sanctioned for failing to comply with TANF rules than among those who have not been sanctioned (Meara 2006).
Most studies of the demand for drugs focus on the effects of prices on drug use. Grossman, Chaloupka & Shim (2002) found that individuals respond to the full cost of drugs, including monetary and non-monetary costs, as they do for other goods. Most studies examining the demand for illicit drugs do not focus specifically on women. One exception is a study by Saffer & Chaloupka (1999) that explicitly examined the demand for drugs by women using the 1988, 1990, and 1991 NHSDA. They found that the demand for hard drugs (cocaine and heroin) is price elastic. They also found that the consumption of marijuana and cocaine increases with income while the consumption of heroin decreases with income, and that marijuana consumption increases with marijuana decriminalization. Another study found that poor mothers with young children are responsive to drug prices (Corman et al. 2005). Finally, two studies investigated effects of transfer payments on drug use. Shaner et al. (1995) found that disability payments may facilitate drug use among individuals with both serious mental illness and drug addiction, and Dobkin & Puller (2007) found that individuals on public assistance are more likely to become hospitalized or die from substance abuse around the days that benefit checks are distributed (they found a weak effect for welfare and a much stronger effect for disability benefits). Overall, these studies point to the need for more research on the effects of cash benefits on drug use.
Welfare Reform and Expected Effects on Women's Illicit Drug Use
Following Saffer & Chaloupka (1999), we posit that the demand for drugs derives from the same theoretical model as for other goods in which an individual maximizes discounted lifetime utility subject to a budget constraint, and is a function of the full price of drugs, prices of other goods, income, the probability and harshness of sanctions, information, and tastes. Many provisions of PRWORA and many AFDC waivers (e.g., time limits, work requirements, increased earnings disregards) increased incentives for women to work and thereby would increase the time cost of using drugs. Those provisions also increased the likelihood that women would be exposed to drug testing by employers, as in 1992-1993, 62 percent of employees in the U.S. were at worksites that conducted some form of drug testing (Hartwell et al. 1996). TANF sanctions for illicit drug use and welfare bans for drug felonies also created stronger deterrents to illicit drug use for both welfare recipients and potential recipients, and may have lead more recipients into drug treatment. The work incentive features of welfare reform could potentially increase access to health insurance (particularly private), which may provide health information and/or drug treatment, although as indicated earlier the literature on effects of welfare reform on health insurance is mixed. Tastes are also relevant, as many proponents of welfare reform claimed that the “work first” regime would increase self-sufficiency and connect previously marginalized poor women to the mainstream, leading them engage in more responsible, and less socially undesirable, behavior (Katz 2001). Together, the potential effects through work, sanctions, health care, and the stricter new regime in general would be expected to decrease illicit drug use. The potential effects through income are less straightforward; e.g., if work requirements, earnings disregards, or other provisions lead to increases in income, the demand for drugs may increase or decrease, depending on whether drugs are a normal or inferior good.
Thus, welfare reform has the potential to increase, decrease, or not affect the use of illicit drugs by women potentially eligible for welfare. However, given the combination of strong work incentives and direct penalties for illicit drug use under PRWORA, we expect that the negative effects on women's illicit drug use will dominate potentially competing and less direct income effects. That is, we expect that welfare reform has reduced adult women's use of illicit drugs.
Data
We use all publicly-accessible national datasets that are both available and appropriate to undertake a comprehensive analysis of the effects of welfare reform on illicit drug use of adult women. First, we use the Substance Abuse and Mental Health Services Administration's annual National Household Survey on Drug Abuse (NHSDA), re-named the National Household Survey on Drug Use and Health (NSDUH) in 2002. The NHSDA/NSDUH is a large-scale nationally representative annual survey that is the pre-eminent source of statistics on adults' illicit drug use in the U.S. We use NHSDA/NSDUH data from 1992 through 2002, which spans the period of welfare reform, to estimate the effects of the reforms on self-reports of any drug use in past year, any drug use other than marijuana in past year, marijuana use in past year, and any drug use in past month. Approximately 20,000 individuals aged 12 and over were sampled in the earlier years (1992-1998) and ∼50,000 individuals in the same age range were sampled in later years. 5
Beyond the self-reported measures of illicit drug use from the NHSDA/NSDUH, we consider several objective measures from administrative records. Two sets of analyses investigate involvement with the criminal justice system for drug offenses and another investigates drug-related encounters within the health care system. For the former, we investigate state-level drug-related admissions into correctional facilities derived from the National Corrections Reporting Program (NCRP), which annually gathers information from official state prison records and provides a good measure of the flow of new inmates into the state prison system. These data include the prisoner's age, education, gender, and type of crime committed. We also investigate monthly state-level drug-related arrests from Federal Bureau of Investigation (FBI) crime reports, which are based on data collected by the FBI from most large criminal justice agencies in the U.S. These data include the prisoner's age, gender, and type of crime.6 It is important to note that many arrestees are not convicted and that many individuals who are convicted are not sent to state penitentiaries. Thus, individuals who are imprisoned for a drug crime (as measured in the NCRP) represent a “hardcore” subset of all drug arrestees.
Finally, we investigate state-level drug-related emergency department (ED) episodes from the Drug Abuse Warning Network (DAWN) collected by the Substance Abuse and Mental Health Services Administration (SAMHSA). The DAWN data are collected quarterly from hospitals in 21 metropolitan areas in 18 states and include information about whether the ED visit was a direct result of illicit drug use, as well as whether there was some indication that illicit drugs were involved in the need for emergency care even when drugs were not the primary reason. The only other relevant variable in this data set is the admitted individual's gender. The DAWN data capture serious health consequences related to illicit drug use.7
We follow the convention in the literature with respect to the construction of the key independent variables capturing shifts in welfare-related policies (reviewed in Blank 2002). The first measure represents federal waivers granted to states to experiment with AFDC rules prior to PRWORA. The second measure represents the implementation of TANF programs post-PRWORA. It is important to consider waivers and TANF separately, since they may have had different effects on behavior. As discussed earlier, the PRWORA legislation explicitly banned welfare participation for individuals with a conviction for a drug felony. Although states could opt out or modify the ban, this rule imposed stricter sanctions that those imposed under AFDC waivers. Thus, the effects of welfare reform on illicit drug use may be more negative (or less positive) under TANF than under the waivers.
Since state identifiers are not available for the NHSDA/NSDUH, our analyses of self-reported drug use exploit variations in welfare policy over time at the national level. For those, we characterize welfare reform three different ways. Our main measure is a dichotomous indicator of TANF implementation. PRWORA legislation was signed into law in late August of 1996 and most states did not implement their TANF programs until early 1997, so we characterize welfare reform as a dichotomous variable equal to one for 1997 through 2002, and zero for the years before 1997. This measure captures any discrete break in illicit drug use trends pre- and post-PRWORA. Second, we characterize welfare reform using separate measures of the proportions of the relevant U.S. population that were exposed to AFDC waivers and to TANF in a given year, which we calculated using actual implementation dates in each state for both major AFDC waiver programs and TANF as well as state population of unmarried women aged 21-49 with less than a college education by year from the U.S. Census.8 Finally, we combined the percent of the relevant population exposed to AFDC waivers and the percent of the relevant population exposed to TANF into one variable—percent of population exposed to any welfare reform. Our combined measure allows us to gauge the robustness of our results, while providing greater statistical power in our estimations.
In the NHSDA/NSDUH analyses, we incorporate the following individual-level characteristics: age and age squared, race/ethnicity (non-Hispanic black, Hispanic, and other non-white non-Hispanic, all compared to non-Hispanic white), marital status (divorced/separated, compared to never married), and education (less than high school, compared to high school graduate with no college). The limited marital status and education categories (e.g., no categories for married and college) reflect sample restrictions based on those criteria, as discussed later. A potential concern, which we address later, is that rising female incarceration rates during the 1990s may have reduced illicit drug use through selection effects, as incarcerated females are selected out of the NHSDA/NSDUH sample. We check for this possibility by controlling for total prison admissions among low-educated females, and also by allowing for the possibility that the trend in total prison admissions may have shifted post-welfare reform.
For the analyses based on administrative data (NCRP, FBI, and DAWN), we characterize welfare reform two different ways and exploit differences in the timing of welfare reform across states with respect to both AFDC waivers and TANF implementation. First, we include separate indicators for AFDC waivers and TANF. For AFDC, the indicator characterizes whether a given state in a given month (for FBI), quarter (for DAWN), or year (NCRP) had a statewide waiver in place that substantially altered the nature of AFDC with regard to time limits, Job Opportunities and Basic Skills training (JOBS) work exemptions, JOBS sanctions, increased earnings disregards, family caps, and/or work requirements.9 A similar indicator is also defined for TANF implementation.10 Second, we include an indicator for any welfare reform (AFDC or TANF).
Method
We employ a quasi-experimental research design – akin to a pre- and post-comparison with treatment and comparison groups – in conjunction with multivariate regression methods to estimate the effects of welfare reform on women's illicit drug use. Analyses using individual-level data from the NHSDA/NSDUH are based on the following model in which illicit drug use (D), for the ith woman during year t, is a function of welfare policy (Welfare) and individual characteristics (X) such as age, race/ethnicity, highest grade completed, and possibly a vector of time-varying factors (Z). The parameter ε represents an individual error term.
| (1) |
The population of interest, that which is affected by welfare reform legislation, is all women at risk of being on public assistance and not just current or former program participants (Kaestner & Tarlov 2006). Potential welfare recipients have been shown to behave strategically in their use of welfare benefits when faced with time limits and other regulatory constraints (DeLeire et al. 2006; Grogger 2004). Thus, it is important when evaluating the effects of welfare reform to consider all women at risk of being on public assistance. The population of interest has traditionally consisted primarily of low-educated, unmarried mothers. We therefore estimate Equation 1 for this group, which we refer to as the target group.
A challenge in any policy analysis is in disentangling the effects of the policy of interest from other time-variant factors that may also affect the outcome. We account for such confounding trends and other policy shifts that coincide with welfare reform by also controlling for the national annual unemployment rate, Medicaid enrollment, log of child support caseload, log of the average real child support payment in the U.S., and log of total prison admissions among less-than-high school educated females.11
In estimating Equation 1, the possibility of omitted variables remains despite these controls for confounding trends and policy shifts. Illicit drug use varies substantially across both years and areas.12 The variations may be the result of policies (such as decriminalizing marijuana or allowing the use of medical marijuana), political forces (such as a war) affecting the supply of drugs, availability of new drugs (such as crack or ecstasy), swings in marketing and prices because of factors associated with the illegal nature of drug possession and sales, or shifts in demand due to economic conditions. Particularly important for our analyses, criminal justice policies and resources vary considerably from year to year and from state to state. For example, changes in laws affect whether possession of certain quantities of drugs are considered misdemeanors or felonies and mandatory minimum sentences. Temporary policy shifts, such as “broken window” policing, may result in large increases in arrests for low-quantity drug possession. Police resources can vary considerably to the extent that Levitt (1997) exploited election cycles as an identifier for police resources in a crime supply function. Emergency department identification and reporting of drug incidents may also be a function of budgets, information, or other constraints. The substantial geographic and time variability inherent in our outcomes of interest raises the specter of additional potentially-unobserved relevant factors. In order to account for time-trends in drug use outcomes correlated with these unobserved factors, we also control for the prevalence of drug use among a comparison group -- individuals who are similar in many ways to the target group but are unlikely to participate in public assistance programs and therefore not likely to be affected by welfare reform policies.13
As a specification check, Equation 1 can also be estimated explicitly for the comparison group, as follows:
| (2) |
Since the comparison group is not at risk of being on public assistance, outcomes for these individuals should not be affected by changes in welfare policies. Thus, the coefficient (π*) on welfare reform in Equation 2 should be zero. If this parameter is non-zero, it reflects omitted factors associated with both welfare policies and illicit drug use.
As an alternate identification strategy and robustness check, we also report difference-in-differences (DD) estimates for the NHSDA/NSDUH from a combined specification estimated for the pooled sample of target and comparison groups, which account for the omitted factors by explicitly utilizing the comparison group as a counterfactual. The assumption underlying this methodology is that in the absence of welfare reform, outcomes would be similar across the target and comparison groups. The impact of welfare reform is identified by comparing changes in outcomes between target and comparison groups pre- and post-shifts in welfare policy.
| (3) |
In the above equation, Target represents a dichotomous indicator equal to one if the individual is in the target group (population at risk of being on welfare) and zero if the individual is in the comparison group (population not at risk of being on welfare). The DD estimate of the effect of welfare reform is the coefficient of the interaction term between the policy measure (Welfare) and the Target group indicator. 14
The choice of target and comparison groups is integral to a valid implementation of the DD methodology. We employ target and comparison groups that are conventionally defined in the literature. To investigate how welfare reform has affected illicit drug use among adult women who are at risk of being on welfare, we compare unmarried women ages 21-49 years with a high school education or below who have a child under the age of 18 in the household (target group) to unmarried women in the same age range and educational group who have no children (comparison group).15 If the comparison group is a valid counterfactual, then it should look very similar to the target group with respect to both levels and trends prior to the policy shift.
Table 1 shows the baseline means for drug use outcomes for the first two years of the sample period (1992 and 1993).16 For past-year indicators of drug use, the responses pertain to 1991 and 1992 which generally predated welfare reform. Only three states (CA, MI, and NJ) had enacted major waivers to their AFDC programs during this period and those were enacted in the final quarter of 1992. As can be seen in Table 1, there are no significant differences in illicit drug use between individuals in the target and comparison groups prior to welfare reform. Further, changes in outcomes between 1992 and 1993 are also not significant between the groups.
Table 1. Baseline Means - Target and Comparison Groups National Household Surveys on Drug Abuse 1992 and 1993.
| Sample | 1992 | 1993 | ||
|---|---|---|---|---|
| Target Group | Comparison Group | Target Group | Comparison Group | |
| Unmarried Women Age 21 - 49 HS Graduate or Less With Children | Unmarried Women Age 21 - 49 HS Graduate or Less No Children | Unmarried Women Age 21 - 49 HS Graduate or Less With Children | Unmarried Women Age 21 - 49 HS Graduate or Less No Children | |
| Any Illicit Drug Use - Past Year | 0.191 | 0.191 | 0.186 | 0.183 |
| Illicit Drug Use Excluding Marijuana - Past Year | 0.101 | 0.118 | 0.108 | 0.096 |
| Marijuana Use - Past Year | 0.153 | 0.166 | 0.142 | 0.149 |
| Any Illicit Drug Use - Past Month | 0.112 | 0.108 | 0.102 | 0.086 |
Note: Sampling weights applied. None of the differences between target and comparison groups are statistically significant.
In analyses based on administrative datasets, we also exploit variation in the timing of welfare reform implementation across states, introducing an additional “difference.” Thus, we estimate the following DD specification separately for the target group:
| (4) |
As discussed earlier, we include indicators for whether a given state had a major AFDC waiver in place at time t, and the whether a given state had implemented TANF at time t. These specifications account for unobserved state-specific time-invariant heterogeneity through state fixed effects (States) and unobserved national trends through year effects (Yeart). To control for additional time-varying state-level variables (Zst) that may confound the relationship between welfare reform and drug use, all of the models based on administrative data include the state/year (and MSA/year for DAWN) unemployment rate and personal income per capita,17 poverty rate,18 minimum wage,19 criminal justice expenditures,20 substance abuse prevention and treatment block grant,21 and relevant measures of other arrests and prison admissions. As before, we account for trends in drug-related outcomes associated with confounding unobservables by controlling for the outcome mean for a group that should not be impacted by welfare policy.22 We also include measures of the relevant population base depending on the analysis sample.23
As with the NHSDA/NSDUH, we estimate Equation 4 for the comparison group as a specification check. We also present DDD estimates, which exploit variation in welfare policy across states, over time, and between target and comparison groups to identify the effects of welfare reform on illicit drug use as proxied by drug-related prison admissions (NCRP), arrests (FBI), or emergency department visits (DAWN) in state (or MSA) s during year t (Ast). We use a log transformation of the outcomes, separately controlling for the log of the relevant population base and allowing its coefficient to remain unrestricted. The log adjusts for the skewness of the drug outcomes, facilitates interpretation (in terms of relative % changes), and makes the effect magnitudes directly comparable across datasets.24 The DDD estimate is based on the following specification (similar to Equation 3) estimated for the pooled target and comparison samples.
| (5) |
The coefficient of the interactions between the welfare reform measures (AFDCWaiver and TANF) and the Target indicator represent the DDD estimate of the impact of welfare policies on the outcome of interest.
For all of the datasets, we attempt to define the target and comparison groups as closely as possible to the “gold standard” used in analyses of the NHSDA/NSDUH—unmarried women ages 21-49 years with a high school education or below who have a child under the age of 18 in the household (target group) and unmarried women in the same age range and educational group who have no children (comparison group). Given data constraints, achieving the exact gold standard with administrative data was not possible. For analyses of prison admissions (NCRP), we compare females ages 21-49 with less than a high school education to females in the same age range with at least a high school education (marital status is not available and the numbers of imprisoned females with more than a high school education are very small).25 For our analyses of arrests and emergency department admissions, we can only conduct female to male comparisons. In particular, for drug-related arrests (FBI), we compare females age 21-49 to males age 21-49, and for drug-related hospital emergency department admissions (DAWN), we compare all females to all males.26 To assess the validity of the various comparison groups, we investigated baseline trends as we did for the NHSDA/NSDUH analyses.
Figures 1-3 document baseline trends between our target and comparison groups, as defined above, for each of the administrative data sets. In documenting these trends, we define welfare reform in a given state as either the implementation of a major waiver to the state's AFDC program or implementation of TANF, whichever occurred first. Trends in the log of drug-related prison admissions, arrests, and drug-related hospital emergency episodes are very similar between the target and comparison groups prior to welfare reform.27 We test that the trends are not statistically different between the groups.28 Such “parallel” pre-welfare reform trends are validating and lend plausibility to the assumption that individuals in the comparison group represent a suitable counterfactual to individuals who are impacted by welfare reform.
Figure 1. Trend Lines - Pre-Welfare Reform Log Drug Related Prison Admissions.
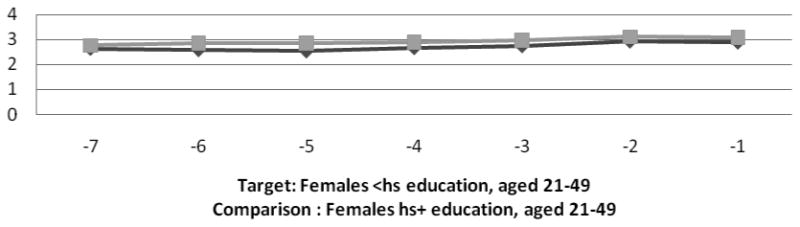
Note: Target group represented by darker line
Figure 3. Trend Lines - Pre-Welfare Reform Log Drug-Related Emergency Room Episodes.
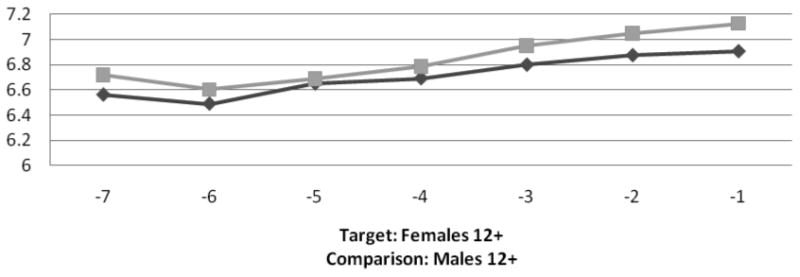
Note: Target group represented by darker line
Results
Self-reported Illicit Drug use from NHSDA/NSDUH
Table 2 presents estimates of the impact of welfare reform, as measured by an indicator for post-1997, based on Equations 1 and 2 for the target and comparison groups, respectively. All specifications incorporate sampling weights. Since the NHSDA/NSDUH is only able to exploit national time-series variation in indicators of welfare policy, standard errors are adjusted for arbitrary correlation across individuals in a given year.29
Table 2. National Household Surveys on Drug Abuse and National Surveys of Drug Use & Health 1992-2002 Target: Unmarried Women with Children, High School Graduates or Less, Ages 21-49 Comparison: Unmarried Women without Children, High School Graduates or Less, Ages 21-49.
| Panel A: Alternative Measures of Drug Use | ||||||||
|---|---|---|---|---|---|---|---|---|
| Sample | Target | Comparison | Target | Comparison | Target | Comparison | Target | Comparison |
| Specification | 1 | 2 | 3 | 4 | 5 | 6 | 7 | 8 |
| Outcome | Any Illicit Drug Use Past Year | Illicit Drug Use Excluding MarijuanaPast Year | Marijuana Use Past Year | Any Illicit Drug Use Past Month | ||||
| Post-1997 | -0.0264** (0.0116) | 0.0104 (0.0153) | -0.0183* (0.0097) | 0.0185 (0.0118) | -0.0250**(0.0102) | -0.00004 (0.0119) | -0.0214***(0.0059) | 0.0098 (0.0090) |
| R-Squared | 0.027 | 0.038 | 0.020 | 0.018 | 0.024 | 0.044 | 0.015 | 0.021 |
| Observations | 15533 | 9877 | 15533 | 9877 | 15533 | 9877 | 15533 | 9877 |
| Panel B: Alternate Specifications Using Any Illicit Drug Use - Past Year | |||||||
|---|---|---|---|---|---|---|---|
| Sample | Target: Unmarried Women w/Children ≤ HS Grad Ages 21-49 |
Comparison: Unmarried Women w/o Children ≤ HS Grad Ages 21-49 |
DD Target + Comparison (using groups from specifications 1 and 2) |
Alt. Target: Unmarried Women ≤ HS Grad Ages 21-49 |
Alt. Comparison: Unmarried Men ≤ HS Grad Ages 21-49 |
Alt. Comparison: Unmarried Women w/Children > HS Grad Ages 21-49 |
Alt. Comparison: Married Women w/Children ≤ HS Grad Ages 21-49 |
| Specification | 1 | 2 | 3 | 4 | 5 | 6 | 7 |
| Post-1997 | -0.0391** (0.0153) | -0.0108 (0.0213) | – | -0.0305* (0.0139) | -0.0051 (0.0405) | 0.0032 (0.0266) | -0.0149 (0.0195) |
| Post-1997* Target | – | – | -0.0354* (0.0181) | – | – | – | – |
| Extended Covariatesa | Yes | Yes | Yes | Yes | Yes | Yes | Yes |
| R-Squared | 0.029 | 0.046 | 0.037 | 0.037 | 0.037 | 0.022 | 0.020 |
| Observations | 15533 | 9875 | 25408 | 25524 | 22324 | 7290 | 20535 |
Notes: Coefficient estimates from linear probability models are presented. All models adjust for sampling weights. Standard errors are adjusted for arbitrary correlation across observations within each year and reported in parentheses. All models control for age, age-squared, race/ethnicity indicators, marital status, household size, and an indicator for whether the individual has graduated from high school; models for the stratified target group also control for the mean annual drug outcome among low-educated unmarried women without children. Significance is denoted as follows:
p≤0.01,
0.01<p≤0.05,
0.05<p≤0.1.
Extended covariates include the unemployment rate, Medicaid enrollment, log of real child support payment, log of the child support caseload among low educated mothers, and log of prison admissions among low-educated females. DD Model 3 in Panel B also includes year indicators and allows the effects of all extended covariates to vary for the target group.
The odd numbered specifications in Panel A pertain to individuals in the target group. Specification 1 suggests that welfare reform reduced past year illicit drug use among low-educated unmarried mothers by 2.6 percentage points.30 Specifications 3 and 5 suggest that this reduction was realized for both hard drugs and marijuana. Specification 7 considers a more recent measure of illicit drug use (past month participation) and indicates that welfare reform is associated with a 2.1 percentage points reduction. These effect magnitudes indicate 14-19 % reductions in illicit drug use relative to the baseline mean prevalence among the target group.31
The even-numbered specifications report estimates for individuals in the comparison group, who are at low risk of welfare receipt. These estimates are generally smaller in magnitude than those for the target group and are statistically insignificant in all cases. If anything, they reflect a small upward trend in drug use among the low-educated population over the period that welfare reform was implemented. Exploiting the comparison group as a full counterfactual for the target group within a DD specification (not reported), by differencing out the effect for the comparison group from the effect for the target group, suggests similar declines (11-24 %) in drug use among low-educated unmarried mothers relative to similar women with no children.
Panel B reports alternative specification checks, with results presented for one outcome (any illicit drug use in the past year) though similar findings emerge for all other outcomes reported in Table 2. To explore the possibility that national trends besides welfare reform may be responsible for the decline in illicit drug use among women at-risk of welfare receipt, models include an extended set of time-varying factors reflecting economic trends (unemployment rates), expansions of public health insurance (Medicaid enrollments), changes in child support enforcement (real child support payment and child support caseload among low-educated mothers), and rising female incarceration rates (prison admissions among low-educated females), all of which coincided with welfare reform. The negative estimated effects of welfare reform on illicit drug use remain robust to the addition of these controls. Specification 1 suggests a significant 3.9 percentage point decline among the target group, with no such effect found among the comparison group reported in the next column. Specification 3 presents the DD estimate based on Equation 3, suggesting a decline of about 3.5 percentage points among low-educated unmarried mothers relative to similar women with no children.
The socio-demographic information available in the NHSDA/NSDUH makes it possible to assess the sensitivity of our estimates to the use of alternate target and comparison groups. Specification 4 broadens the definition of the target group to low-educated unmarried women, without using the presence of minor biological children as a criterion. Welfare reform is associated with reductions in illicit drug use among these women of about 3 percentage points. Expectedly, the effect magnitude is somewhat smaller than that in Model 1 since the target group has become more inclusive of women who may not be eligible for welfare. Specifications 5-7 utilize alternate definitions of the comparison group. It is validating that welfare reform does not have significant or substantial effects among these populations.
Table 3 presents an additional sensitivity check by utilizing alternate measures of welfare reform described earlier – the fractions of at-risk women exposed separately to AFDC Waivers and TANF, and the fraction exposed to any welfare reform. The reported estimates correspond to the effects of an increase in the fraction exposed from 0 to 100%. Since the percent of the at-risk population exposed to AFDC waivers was about 51% at its highest level in 1996, we scale down the estimated effects of AFDC waivers by half in our discussion. Specification 1 indicates that as a greater fraction of the at-risk population was exposed to welfare reform, their past-year illicit drug use declined. AFDC waivers and TANF, respectively, are associated with a 3.8 and 2.9 percentage points decline in past year illicit drug use among low-educated unmarried mothers. These magnitudes reflect 19.9% and 15.2% declines, respectively, relative to the baseline sample mean for the target group. Coefficients for the comparison group (Specification 2) are positive, likely capturing an increasing trend in drug use among low-educated women over this period. Specifications 3 and 4, which define welfare reform as either implementation of an AFDC waiver or TANF, suggest a similar magnitude decline of about 3 percentage points, while also revealing the overall positive trend in drug use for the comparison group. Specifications 5 and 6 show that the negative estimated effects of welfare reform on illicit drug use (between 3.5 and 5.8 % points) remain robust to the addition of the extended vector of covariates.
Table 3. Any Illicit Drug Use - Past Year National Household Surveys on Drug Abuse and National Surveys of Drug Use & Health 1992-2002 Sensitivity Analyses—Alternative Measures of Welfare Reform Target: Unmarried Women with Children, High School Graduates or Less, Ages 21-49 Comparison: Unmarried Women without Children, High School Graduates or Less, Ages 21-49.
| Sample | Target | Comparison | Target | Comparison | Target | Target | DD Target + Comparison |
Alt. Target: Unmarried Women ≤ HS Grad Ages 21-49 |
Alt. Comparison: Unmarried Men ≤ HS Grad Ages 21-49 |
Alt. Comparison: Unmarried Women w/ Children > HS Grad Ages 21-49 |
Alt. Comparison: Married Women w/ Children ≤ HS Grad Ages 21-49 |
|---|---|---|---|---|---|---|---|---|---|---|---|
| Specification | 1 | 2 | 3 | 4 | 5 | 6 | 7 | 8 | 9 | 10 | 11 |
| % Population Exposed to AFDC Waivers | -0.0754*** (0.0235) | 0.0100 (0.0229) | – | – | -0.0693 (0.0540) | – | – | -0.0466 (0.0290) | 0.0143 (0.0944) | -0.0007 (0.0210) | 0.0033 (0.0170) |
| % Population Exposed to TANF | -0.0292** (0.0090) | 0.0402** (0.0157) | – | – | -0.0576** (0.0238) | – | – | -0.0230* (0.0130) | 0.0096 (0.0564) | -0.0021 (0.0117) | -0.0111 (0.0108) |
| % Population Exposed to Welfare Reform | – | – | -0.0296** (0.0099) | 0.0442** (0.0185) | – | -0.0540** (0.0184) | – | – | – | – | – |
| % Population Exposed to Welfare Reform * Target | – | – | – | – | – | – | -0.0567* (0.0313) | – | – | – | – |
| Log Prison Admissions among Less than High School Women * Target | – | – | – | – | – | – | -0.0042 (0.0993) | – | – | – | – |
| Log Prison Admissions * Target* Post-1997 | – | – | – | – | – | – | 0.0023 (0.0042) | – | – | – | – |
| Extended Covariatesa | No | No | No | No | Yes | Yes | Yes | Yes | Yes | Yes | Yes |
| R-Squared | 0.027 | 0.039 | 0.027 | 0.039 | 0.028 | 0.028 | 0.037 | 0.031 | 0.036 | 0.023 | 0.017 |
| Observations | 15533 | 9875 | 15533 | 9875 | 15533 | 15533 | 25408 | 25524 | 22378 | 7290 | 20535 |
Notes: Coefficient estimates from linear probability models are presented. All models adjust for sampling weights. Standard errors are adjusted for arbitrary correlation across observations within each year and reported in parentheses. All models control for the covariates listed in Table 2. Significance is denoted as follows:
p≤0.01,
0.01<p≤0.05,
0.05<p≤0.1
Extended covariates include the unemployment rate, Medicaid enrollment, log of real child support payment, log of the child support caseload among low educated mothers, and log of prison admissions among low-educated females. DD Model 7 also includes year indicators.
A concern raised earlier relates to the possibility that rising female incarceration rates reduced illicit drug use through selection effects. For instance, between 1987 and 2003, the ratio of total female prison admissions to male prison admissions increased from 8% to 12%, and the ratio of total female to male drug-related admissions increased from 10% to 14%, based on the FBI crime reports. If the increase in total female incarceration was related to both welfare receipt and drug use, then the prevalence of drug use among the target group would decline over time simply due to more incarcerated females being selected out of the sample. We note, however, that subsequent analyses find decreases (rather than increases) in drug-related prison admissions associated with welfare reform. Nevertheless, to address the possibility of selection bias, Model 7 estimates the DD specification (Equation 3) and includes an interaction between the target indicator and total prison admissions among low-educated women, and an interaction between the prison admissions and the timing of welfare reform (post-1997). These interactions also address another concern--that the decline in drug use being attributed to welfare reform may reflect the waning of the crack epidemic, which was especially prominent among disadvantaged population subgroups, over the period that welfare reform unfolded. The coefficients of the interactions with prison admissions are insignificant and close to zero, suggesting that these differential confounders are not driving the results. The effect magnitude also remains robust; welfare reform is associated with a 5.7 percentage points (30%) decline in illicit drug use.
Specification 8 considers the alternate broader classification of the target group and does not use the presence of minor biological children as a criterion, and Specifications 9-11 utilize alternate classifications of the comparison group, as was also shown in Panel B of Table 2. Estimates remain robust (though expectedly smaller in magnitude) for the alternate target group, and it is validating that welfare reform is not associated with significant or substantial effects among the various comparison sub-populations. Overall, the results from the various specifications in Tables 2 and 3 confirm that welfare reform appears to have decreased illicit drug use among adult women at risk of welfare receipt in the United States.32
The analyses thus far have relied on individual-level data from the NHSDA/NSDUH. The strengths of the NHSDA/NSDUH include extensive socio-demographic information on the individual, permitting a clean identification of individuals who are potentially at risk of relying on welfare versus those who are unlikely to be impacted by welfare policies. It also includes information on the various types of illicit drugs used. However, as with all survey-based data, individuals may under-report their use of illicit drugs. As long under-reporting is uncorrelated with the policy measures of interest, our estimates would be unbiased. However, because welfare reform increased both the real and perceived penalties associated with drug use, it is possible that women at risk of relying on welfare have a systematically higher propensity to under-report drug use after the policy change. Thus, what may appear as a negative effect of on drug use may instead reflect increased under-reporting as welfare reform took effect. We address this concern by also analyzing objective outcomes related to illicit drug use based on administrative data.
Specifically, we utilize information on state-level drug-related prison admissions from the NCRP, state-level drug-related arrests from the FBI's Crime Reports, and city-level drug-related hospital emergency department visits from DAWN. In addition to bypassing limitations associated with self-reported data, these indicators likely capture more intensive or frequent drug participation. The use of multiple indicators of drug activity measured over multiple data sets collected by different entities for different purposes adds to the weight of the evidence bearing on the impact of welfare reform on illicit drug use. Most importantly, these alternate data sources allow us to exploit variation in the timing of AFDC waivers and TANF across states.
Drug-related Prison Admissions from NCRP
Table 4 presents DD and DDD estimates for drug-related prison admissions from the NCRP. The first four columns correspond to the DD specification as formulated in Equation 4, which exploits variation in the timing of welfare reform across states to estimate the effects of welfare reform on illicit drug use for our primary target group -- low-educated (less than high school educated) women between the ages of 21-49. In the DD specifications for the target group, the welfare reform variables are never statistically significant (although t-values exceed one), and therefore all evidence is only suggestive. Specification 1 suggests that TANF may have reduced drug-related prison admissions among this group by about 26%. AFDC waivers also may have reduced drug-related prison admissions among low-educated females, by about 9%.
Table 4. Log Drug-Related Prison Admissions National Corrections Reporting System 1992-2003.
| Sample | Target: Females, Less than High School Educated Ages 21-49 |
Comparison: Females, HS or Higher Ages 21-49 |
DDD Target + Comparison Constrained |
DDD Target + Comparison Constrained |
||||
|---|---|---|---|---|---|---|---|---|
| Specification | 1 | 2 | 3 | 4 | 5 | 6 | 7 | 8 |
| AFDC Waiver | -0.0916 (0.0754) | -0.1003 (0.0746) | – | – | 0.0872 (0.1514) | – | 0.1679 (0.1120) | – |
| AFDC Waiver* Target | – | – | – | – | – | – | -0.1677 (0.1835) | – |
| TANF | -0.2647 (0.1838) | -0.2614 (0.1958) | – | – | -0.1285 (0.3727) | – | -0.0669 (0.2695) | – |
| TANF* Target | – | – | – | – | – | – | -0.1922** (0.0913) | – |
| Any Welfare Reform | – | – | -0.1002 (0.0736) | -0.1069 (0.0741) | – | 0.0653 (0.1550) | – | 0.1002 (0.1199) |
| Any Welfare Reform* Target | – | – | – | – | – | – | – | -0.1878* (0.0957) |
| Lagged State Economic Conditionsa | No | Yes | No | Yes | Yes | Yes | Yes | Yes |
| Lagged State Welfare Caseloada | No | Yes | No | Yes | Yes | Yes | Yes | Yes |
| State Indicators | Yes | Yes | Yes | Yes | Yes | Yes | Yes | Yes |
| Year Indicators | Yes | Yes | Yes | Yes | Yes | Yes | Yes | Yes |
| R-Squared | 0.961 | 0.962 | 0.961 | 0.881 | 0.948 | 0.880 | 0.905 | 0/088 |
| Observations | 324 | 324 | 324 | 324 | 324 | 324 | 648 | 648 |
Notes: Coefficient estimates from OLS models are presented. Standard errors are adjusted for arbitrary correlation across observations within each state and reported in parentheses. All models also control for state indicators, year indicators, state unemployment rate, state personal income per capita, state poverty rate, state minimum wage, mean age of admission and its square, state substance abuse prevention and treatment block grant, log state population, log female population, log total state arrests, and log state criminal justice spending; models for the stratified target group also control for the mean drug-related prison admissions among higher-educated females. Significance is denoted as follows:
p≤0.01,
0.01<p≤0.05,
0.05<p≤0.1
Controls include one-year lags of the state unemployment rate and state personal income per capita, and one- and two-year lags of the state welfare caseload.
It is possible that state experimentation with welfare reform through waivers and their implementation of TANF may have been related to prior increases in the caseload and prior economic conditions. This would suggest that there may be lagged unobservable time-varying factors related to the state's economy and its welfare caseloads that are correlated with the state's decision of whether and when to implement major waivers to AFDC and the timing of TANF implementation. Specification 2 addresses this possibility by controlling for lagged state-level economic indicators (state-level unemployment rate and personal income per capita) and lags of the state's welfare caseloads. The effect magnitudes are similar to those in Specification 1, and suggest that welfare reform may have reduced drug-related prison admissions by between 10-26 %.
Specifications 3 and 4 correspond to specifications 1 and 2 but utilize an alternate single measure of welfare reform to maximize statistical power and gauge the robustness of the results. Welfare reform is defined as either a major waiver to the state's AFDC program or TANF, whichever occurred first. In line with the other estimates, we find suggestive evidence that welfare reform may have reduced drug-related prison admissions by about 11 % among the target group.
Specifications 5 and 6 present estimates for the comparison group, women with a high school education or above, and suggest some residual trends. These coefficients are also imprecisely estimated, however, due to inflated standard errors. As an alternative specification, in order to maximize degrees of freedom and statistical power, we estimate the DDD specification shown in Columns 7 and 8 (corresponding to Equation 5), which constrains all other non-welfare coefficients to be equal between the target and comparison groups. We are unable to reject this equality constraint, though this may be due to the relatively large standard errors of the other coefficients, and thus these results should be considered complementary to the specifications which do not constrain the other coefficients. Standard errors are lower in these models, and the DDD estimates (reported coefficients of the interaction terms between the target group indicator and indicators of welfare reform) are generally significant at conventional levels. They suggest a similar effect magnitude as above – about 17-19% decline in drug-related prison admissions among low-educated women relative to higher-educated women. Overall, our prison admission models provide additional suggestive evidence that welfare reform reduced at-risk women's drug use.
The magnitude of this effect is consistent with the estimates from the earlier analyses based on the NHSDA/NSDUH. Specifications in Table 2 suggest, for instance, that welfare reform reduced past year illicit drug use participation by 2-4 percentage points (10 - 21% relative to the baseline mean) among the target group. Using the 1992 prevalence of any illicit drug use in the past year among women in the target group (1.94 million), this translates into a decline of between 188,180 and 405,460 drug users in the target population (assuming a fixed population). For the NCRP analyses (Table 4), Specifications 4 and 8, which control for the extended set of covariates, suggest that any welfare reform reduced the number of drug-related prison admissions by 11-19%. Based on 5,078 women in the target group imprisoned for drug-related offenses in 1992, this translates into a reduction in prison admissions by between 559 and 965 women, which is plausible given the estimated reduction in the number of drug users. This implies a marginal probability of a drug-related prison admission conditional on past-year drug use of between 0.001 and 0.005. Thus, for every 1000 individuals deterred from using drugs in a given year, drug-related prison admissions would decrease by about 1 to 5 in that year. The average probability can be readily observed given the estimated number of female drug users in the population and the number of prison admissions for drug-related offenses; it is about 0.002 consistent with our estimated marginal probabilities which range from 0.001 to 0.005.
Drug-related Arrests from FBI Uniform Crime Reports
Table 5 presents DD and DDD estimates for drug-related arrests, derived from the FBI's Uniform Crime Reports. The DD effects based on models estimated for the target group (females ages 21-49) suggest that both AFDC waivers and TANF reduced drug-related arrests by about 6%. All of the relevant estimates reported in specifications 1-4, which correspond to the same-numbered specifications in Table 4, are statistically significant.33 For comparison, we estimate similar models for males, who should not be affected by welfare policy (Specifications 5 and 6). The estimated effects of welfare reform on drug use are statistically insignificant in those cases, though the positive coefficients are consistent with an increasing trend in drug arrests coinciding with welfare reform. Columns 7 and 8 present DDD estimates from models based on Equation 5 and indicate declines in drug-related arrests among females by about 7% relative to males.34
Table 5. Log Drug-Related Arrests FBI Crime Reports 1992-2002.
| Sample | Target: Females Ages 21-49 |
Comparison: Males Ages 21-49 |
DDD Target + Comparison Constrained |
DDD Target + Comparison Constrained |
||||
|---|---|---|---|---|---|---|---|---|
| Specification | 1 | 2 | 3 | 4 | 5 | 6 | 7 | 8 |
| AFDC Waiver | -0.0519** (0.0228) | -0.0593** (0.0206) | – | – | 0.0419 (0.0599) | – | 0.0491 (0.0637) | – |
| AFDC Waiver* Target | – | – | – | – | – | – | -0.0668 (0.0523) | – |
| TANF | -0.0609* (0.0315) | -0.0576* (0.0315) | – | – | 0.0535 (0.0449) | – | 0.0559 (0.0464) | – |
| TANF* Target | – | – | – | – | – | – | -0.0657** (0.0264) | – |
| Any Welfare Reform | – | – | -0.0535** (0.0220) | -0.0590*** (0.0200) | – | 0.0440 (0.0547) | – | 0.0497 (0.0525) |
| Any Welfare Reform* Target | – | – | – | – | – | – | – | -0.0650** (0.0287) |
| Lagged State Economic Conditionsa | No | Yes | No | Yes | Yes | Yes | Yes | Yes |
| Lagged State Welfare Caseloada | No | Yes | No | Yes | Yes | Yes | Yes | Yes |
| State Indicators | Yes | Yes | Yes | Yes | Yes | Yes | Yes | Yes |
| Month Indicators | Yes | Yes | Yes | Yes | Yes | Yes | Yes | Yes |
| Year Indicators | Yes | Yes | Yes | Yes | Yes | Yes | Yes | Yes |
| R-Squared | 0.973 | 0.973 | 0.973 | 0.973 | 0.963 | 0.963 | 0.958 | 0.958 |
| Observations | 6055 | 6055 | 6055 | 6055 | 6044 | 6044 | 12088 | 12088 |
Notes: Coefficient estimates from OLS models are presented. Standard errors are adjusted for arbitrary correlation across observations within each state and reported in parentheses. In addition to indicators for state, year, and month, all models also control for the state unemployment rate, state personal income per capita, state poverty rate, state minimum wage, state substance abuse prevention and treatment block grant, log state population of all agencies with population 50,000+, log covered population of reporting agencies, log total non-drug related state arrests, and log state criminal justice spending; models for the stratified target group also control for the mean drug-related arrests among males ages 21-49. Significance is denoted as follows:
p≤0.01,
0.01<p≤0.05,
0.05<p≤0.1
Controls include one-year lags of the state unemployment rate and state personal income per capita, and one- and two-year lags of the state welfare caseload.
The results for arrests are also consistent with the declines in prison admissions attributed to welfare reform. On average, our data from the FBI and NCRP indicate that the probability of a prison admission for a female, conditional on a drug-related arrest, is about 11-15% over the sample period. Given that our estimates indicate a decline in drug-related arrests by between 5,700 and 6,650 (6-7%, as reported above, based on a baseline of 95,000 female drug arrests in 1992) as a result of welfare reform, the average probability of 11-15% would imply a reduction in drug-related prison admissions by between 627 and 998. Our range of estimates from the NCRP analyses is therefore plausible in suggesting that welfare reform reduced drug-related prison admissions by between 559 and 965.
Drug-related Hospital Emergency Department (ED) Episodes from DAWN
Table 6 considers drug-related hospital ED visits as an indicator of intensive or heavy drug use. Similar to our analyses of drug-related arrests, we compare females (target group) with males (comparison group). Specifications 1 and 2 suggest welfare reform reduced the number of drug-related ED episodes by 5-8% among the target group. As evidenced with the other datasets, the coefficients for models estimated for the corresponding comparison groups (Specifications 3 and 4) likely capture residual unobserved upward trends in drug use concurrent with welfare reform. Thus, the constrained DDD estimates (Specifications 5-6) suggest somewhat larger declines in drug-related ED episodes among females relative to males, on the order of 11-12%.
Table 6. Log Drug-Related Hospital Emergency Department Visits Drug Abuse Warning Network 1992-2002.
| Outcome | Log Drug-Related ED Episodes | Log Drug-Related ED Mentions | ||||||||
|---|---|---|---|---|---|---|---|---|---|---|
| Sample | Target: Females |
Comparison: Males |
DDD Target + Comparison Constrained |
DDD Target + Comparison Constrained |
Target: Females |
Comparison: Males |
||||
| Specification | 1 | 2 | 3 | 4 | 5 | 6 | 7 | 8 | 9 | 10 |
| AFDC Waiver | -0.0808*** (0.0172) | – | 0.0687 (0.0584) | – | 0.0738 (0.0899) | – | -0.0812*** (0.0196) | – | 0.0830 (0.0642) | – |
| AFDC Waiver* Target | -0.1195 (0.1091) | – | ||||||||
| TANF | -0.0531* (0.0305) | – | -0.0175 (0.0640) | – | 0.0153 (0.0624) | – | -0.0533* (0.0282) | – | -0.0220 (0.0689) | – |
| TANF* Target | – | – | – | – | -0.1114** (0.0510) | – | – | – | – | – |
| Any Welfare Reform | – | -0.0748*** (0.0186) | – | 0.0501 (0.0565) | – | 0.0590 (0.0659) | – | -0.0751*** (0.0198) | – | 0.0603 (0.0627) |
| Any Welfare Reform* Target | – | – | – | – | – | -0.1134* (0.0624) | ||||
| Lagged State Economic Conditionsa | Yes | Yes | Yes | Yes | Yes | Yes | Yes | Yes | Yes | Yes |
| Lagged State Welfare Caseloada | Yes | Yes | Yes | Yes | Yes | Yes | Yes | Yes | Yes | Yes |
| MSA Indicators | Yes | Yes | Yes | Yes | Yes | Yes | Yes | Yes | Yes | Yes |
| Quarter Indicators | Yes | Yes | Yes | Yes | Yes | Yes | Yes | Yes | Yes | Yes |
| Year Indicators | Yes | Yes | Yes | Yes | Yes | Yes | Yes | Yes | Yes | Yes |
| R-Squared | 0.982 | 0.982 | 0.946 | 0.946 | 0.916 | 0.917 | 0.979 | 0.979 | 0.941 | 0.940 |
| Observations | 880 | 880 | 880 | 880 | 1760 | 1760 | 880 | 880 | 880 | 880 |
Notes: ED = Emergency Department. Coefficient estimates from OLS models are presented. Standard errors are adjusted for arbitrary correlation across observations within each metropolitan area and reported in parentheses. In addition to indicators for metropolitan area, year, and quarter, all models also control for an indicator for the Target group, state and MSA unemployment rates, state personal income per capita, state poverty rate, state minimum wage, state substance abuse prevention and treatment block grant, log MSA population, and log state criminal justice spending; models for the stratified target group also control for the mean drug-related outcome among males. Significance is denoted as follows:
p≤0.01,
0.01<p≤0.05,
0.05<p≤0.1
Controls include one-year lags of the state unemployment rate, MSA unemployment rate and state personal income per capita, and one- and two-year lags of the state welfare caseload.
For each ED episode, up to four drugs may be reported; as such, the number of mentions exceeds the number of DAWN cases. Specifications 7-10 correspond to specifications 1-4, but for drug-related ED mentions instead of ED episodes. The effect magnitudes remain robust.
We considered our effect magnitudes based on the DAWN in light of the estimated reduction in self-reported illicit drug use based on the NSHDA/NSDUH. Specifically, the 2004 data from the NSDUH and DAWN indicate that the annual ratio of drug-related ED visits to the number of illicit drug users for females is between 0.02 and 0.03. Information on education is not available in DAWN, but we might expect this ratio to be somewhat higher for low-educated females if they are more likely to be heavy or hardcore users. The earlier NHSDA/NSDUH results suggest that welfare reform reduced the number of at-risk (low-educated and unmarried) females who use illicit drugs by as much as 400,000. Assuming that the marginal probability is close to the average probability, this would be associated with a reduction in 8,000-12,000 drug-related ED visits. Our estimates based on the DAWN analyses (Specifications 2 and 6 in Table 6) suggest a plausible reduction of about 7,000-16,000 (7-11 %).
Additional Consistency Checks
Owing to the unique strengths and limitations of each dataset, the robustness and consistency in the patterns and effect magnitudes across the four datasets adds to the weight of the evidence bearing upon how drug use was impacted by welfare reform. While the NHSDA/NSDUH contains socio-demographic information, permitting the most nuanced specifications of target and comparison groups, it lacks information on the state of residence. Thus, we can only exploit variation in welfare at the national level using the NHSDA/NSDUH. While the administrative datasets allow us to exploit state-level variation in welfare reform, our specifications of target and comparison groups are limited by the less detailed socio-demographic information available. In order to assess the consistency of our findings across datasets, we implement two additional checks (results not shown). First, we estimate models for the NHSDA/NSDUH based on the exact (limited) definitions of the target and comparison groups used with the administrative datasets. Specifically, we compare females ages 21-49 to similar aged males--the groups used in the analyses of FBI arrests and the DAWN hospital ED episodes. We also compare less-than-high school educated females (ages 21-49) to females with a high-school education or higher--the groups used in the analyses of NCRP prison admissions. Expectedly, the treatment effects become smaller as the target group becomes more inclusive of women who may not be eligible for welfare, though they remain statistically significant: 2.46 percentage points decline in past-month illicit drug use for unmarried low-educated women with children; 1.88 percentage points decline for low-educated women; 1.42 percentage points decline for women.35 These estimates, as well as the pattern across them, provide further support for our finding that welfare reform is associated with declines in drug use among the at-risk population.
Second, we re-estimate all models for our administrative datasets under the assumption that we do not observe the states or geographic location, and instead utilize the measures of welfare reform from the NHSDA/NSDUH analyses. It is validating, and further raises confidence in the NHSDA/NSDUH estimates, that these models also suggest declines in drug-related outcomes of magnitude similar to those reported in Tables 4-6: 19-24% for drug-related prison admissions, 8-13% for drug-related arrests, and 8-12% for drug-related hospital ED visits.
Conclusion
We find robust evidence that welfare reform led to a 10-21% decline in illicit drug use among women at risk of relying on welfare, as well as associated declines in drug-related arrests (6-7%), drug-related hospital emergency department episodes (7-11%), and possibly drug-related prison admissions (11-19%). We used every available nationally representative data set that is appropriate for addressing this question, considered outcome measures along the continuum from marijuana use to more “hard core” drug use (drug-related imprisonment and emergency department episodes), and used administrative data from a number of different sources in addition to self-reported drug use. The patterns across the different datasets, drug-related outcomes, measures of welfare reform, model specifications, and target/comparison groups paint a remarkably consistent picture: Welfare reform reduced illicit drug use.
Future research is needed to ascertain the extent to which the effects may have operated through employment, TANF drug policies, or other pathways. Our findings of significant but smaller negative effects of welfare reform on binge drinking than on illicit drug use and effects of TANF that are not appreciably larger than those of AFDC waivers suggest that welfare bans and other TANF drug policies are not the main contributing factors. Indeed, fewer than half of states fully implemented the bans for drug felonies (a relatively rare event among women at risk of relying on welfare), and although authorized to do so by the PRWORA legislation, most states do not conduct drug testing of TANF recipients and sanction those who test positive (Rubinstein 2002). Preliminary analyses that stratify by state TANF drug and work incentive policies suggest that welfare reform affected drug use through multiple channels (Corman et al. 2010).
It is important to note that we have estimated average effects that coincided, for the most part, with a strong economy. The overall effects could mask considerable heterogeneity within the target population and might look different during periods of economic recession. The bottom line implication, however, is that an appropriately designed system alongside sufficient job opportunities for those able to work (with appropriate supports for those who are unable to work, such as women caring for disabled children or family members or women who are themselves disabled) would result in both increases in employment and decreases in illicit drug use.
Figure 2. Trend Lines - Pre- Welfare Reform Log Drug Related Arrests.
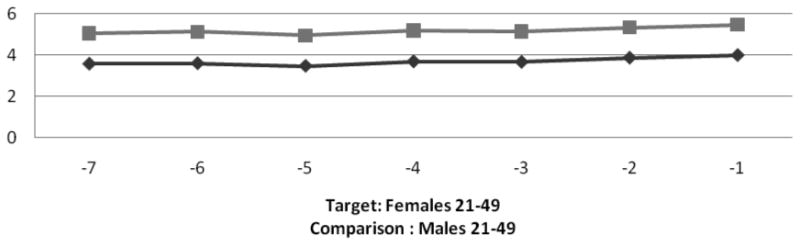
Note: Target group represented by darker line
Acknowledgments
This project was funded in part by the National Institute of Child Health and Human Development (Grant #R01HD060318). We are grateful for helpful comments from Sandy Decker, Jeremy Arkes, Dan Rees, Susan Averett, Ilene Goldberg, and seminar participants at the University of Iceland; and for valuable research assistance from Oliver Joszt.
Footnotes
Source: Authors' calculations, based on weighted averages for any drug use in the past year for adults aged 21 to 49 in the 1992 to 2002 National Household Surveys on Drug Abuse/National Surveys on Drug Abuse and Health.
See www.spdp.org (State Policy documentation project) for details of the policies for specific states.
The information in this section is synthesized from Blank (2002), Moffitt (1992, 1995, 1998), Grogger & Karoly (2005), Gennetian & Knox (2003), Peters, Plotnick & Jeong (2003), and Ratcliffe et al. (2002).
According to the drug provision of PRWORA, anyone who was convicted of a drug felony committed after 7/1/1997was subject to the ban (provision115 of PUBLIC LAW 104–193—AUG. 22, 1996; available at; http://www.gpo.gov/fdsys/pkg/PLAW-104publ193/pdf/PLAW-104publ193.pdf; accessed 8/20/2011). However, beginning August 22, 1996, states could modify the harshness of the sanction (e.g., by reducing the length of the ban or eliminating it altogether) or could change the reference date. For example, California, the last state to implement TANF, on January 1, 1998, set the date at 12/31/97 (http://www.prisonpolicy.org/scans/jpi/doublejep.pdf; accessed on 8/20/2011). Many states modified the harshness of the punishment. By 2002, over half of states had either opted out or modified the lifetime denial of TANF benefits to women with felony drug convictions (GAO 2005).
The NHSDA/NSDUH is a sample of non-institutionalized individuals, and as such, doesn not include women in jail or prison.
Specifically, we used Uniform Crime Reporting Program arrest data from the Monthly Master Files from the FBI for 1992-2002, which provide the number of arrests by age and gender for each month, offense category, and reporting agency. The data include a record for each criminal justice agency in the U.S., whether it reported to the FBI or not, and the population covered by that agency. Not all criminal justice agencies report on the number of arrests by month and offense. From the agency-based observations, we aggregated the data to the month/year/state level and calculated the numbers of drug-related arrests. A few of the agencies reported arrests only for December; because some of these were annual rather than monthly figures, we dropped those agencies. To control for both the total population and the population actually covered by the FBI arrests in the offense categories of interest for the state/month/year, we include both the total state population in all agencies and the total population covered by the FBI arrest data for that state/year/month/offense cluster on the right-hand side in the models of arrests.
The MSAs represented in the DAWN data are Atlanta, Baltimore, Boston, Buffalo, Chicago, Dallas, Denver, Detroit, Los Angeles, Miami, Minneapolis, New Orleans, New York, Newark, Philadelphia, Phoenix, Saint Louis, San Diego, San Francisco, Seattle, and Washington DC. For all data sets other than DAWN, we use data for 1992 to 2002. Because of the smaller number of geographic units in the DAWN data, for those analyses we use information from 1990 to 2002 to increase the sample size and degrees of freedom. DAWN data are available quarterly from 1990 to the first half of 2001. For the second half of 2001and all of 2002, however, data are available only semi-annually. For those 6 quarters, we interpolated quarterly figures from the semi-annual data. Estimates are robust to the use of semi-annual data throughout the sample period instead of the quarterly data.
Information on state implementation of major AFDC waivers and TANF was obtained from the Assistant Secretary for Planning and Evaluation at the U.S. Department of Health and Human Services: http://aspe.hhs.gov/HSP/Waiver-Policies99/policy_CEA.htm. Census data were obtained from: http://www.census.gov/popest/archives/2000s/vintage_2001/CO-EST2001-12/CO-EST2001-12-00.html and www.census.gov/popest/states/tables/NST-EST2008-01.xls .
For the NCRP analyses, our indicator measures the fraction of the year the policy was in place. For instance, the indicator for Maryland, which enacted a major waiver on March 1, 1996, is coded as 0.667 for 1996 to reflect the eight months that the waiver was in place for that year (using October as the reference month, since the analyses are based on the October CPS). 29 states enacted such waivers, across various months, between 1992 and 1996.
States enacted TANF differentially throughout 1996 and 1997 (see footnote 8 for data source).
Unemployment rates were from the Bureau of Labor Statistics: http://data.bls.gov/PDQ/servlet/SurveyOutputServlet?data_tool=latest_numbers&series_id=LNU04000000&years_option=all_years&periods_option=specific_periods&periods=Annual+Data. Medicaid enrollments (as a fraction of the population) were from the Centers for Medicare and Medicaid Services Data: http://www.cms.hhs.gov/NationalHealthExpendData/05_NationalHealthAccountsStateHealthAccountsResidence.asp#TopOfPage. Information on the numbers of low-educated (high school graduate or less) mothers receiving any child support and the size of the average child support payment for this group were obtained from the U.S. Census: http://www.census.gov/hhes/www/childsupport/reports.html. Since those data are available biennially, we interpolate between adjacent years.
For example, rates of imprisonment for drug-related crimes were over 40% higher in 2002 than in 1995, and the mean imprisonment rates per 1,000 people in 1992-2002 ranged from 0.025 in West Virginia to 0.792 in the District of Columbia (authors' calculations from the NCRP data).
Dave et al. (2011) use a similar control to account for unobserved trends in insurance status in studying the Medicaid expansions.
In order to improve precision and maximize statistical power, this specification constrains the other (non-welfare reform) coefficients to be equal between the target and comparison groups. We test the validity of this restriction, and are unable to reject the null hypothesis of equal coefficients for any of the specifications reported.
About 36% of the women in our target group reported that they received public assistance compared to about 6% of our primary comparison group. That is, our target group was 6 times as likely to receive public assistance as the comparison group. In alternate analyses, we also employ three other comparison groups: low-educated unmarried males, unmarried women with children who have completed some college, and married women with children who have less than a college education.
Unfortunately, we could not use data from surveys before 1992 to examine trends due to the change in the design of the survey and the well-documented incompatibility of previous years with the years 1992 and beyond (See U.S. Department of Health and Human Services 1993).
These data were obtained from the U.S. Bureau of Labor Statistics.
Source: U.S. Bureau of the Census, Current Population Survey, Annual Social and Economic Supplements. www.census.gov/apsd/techdoc/cps
Source: Unites States Department of Labor http://www.dol.gov/esa/whd/state/stateMinWageHis.htm
Expenditures data were obtained from U. S. Department of Justice Office of Justice Programs Bureau of Justice Statistics Website http://bjsdata.ojp.usdoj.gov/dataonline/Search/EandE/state_exp_next.cfm
Source: National Conference of State Legislatures website: www.ncsl.org
This is a flexible form of control that, unlike a DDD specification, does not require trends to be similar for the groups (Dave et al. 2011).
Models with NCRP data also include age variables.
Estimates are not sensitive to alternate functional forms: (1) natural log of the probability of the drug-related indicator: ln(Ast/Populationst); and (2) logistic transformation based on the natural log of the odds of the drug-related indicator: ln((Ast/Populationst)/(1-( Ast/Populationst)). Standard errors in all models are adjusted for arbitrary correlation within states over time.
Based on reports of welfare receipt in the NHSDA/NSDUH, this target group was almost 4 times as likely to receive public assistance as the comparison group (22.1% versus 6.2%).
Based on reports of welfare receipt in the NHSDA/NSDUH, this target group was almost 5 times as likely to receive public assistance as the comparison group (8.8% versus 1.8%).
Note that, because population figures did not change substantially in the period of our analysis, trends in rates are quite similar to the trends in the admission/arrest numbers.
We also estimated models relating the natural log of drug-related indicators to an indicator for the target group, indicators for years since welfare reform (defined as the AFDC waiver or TANF, whichever was implemented first), and interactions between the target group indicator and years since welfare reform. The interaction terms were insignificant, suggesting that trends in total drug related indicators were not significantly different between individuals in the target and comparison groups in states prior to welfare reform. To conserve degrees of freedom and maximize statistical power, we also estimated a similar model replacing the dichotomous indicators for years since welfare reform with a continuous measure of years since welfare reform and interacting this measure with the target indicator. The interaction term is again insignificant; the estimated coefficient is small in magnitude (0.0039 for drug-related prison admissions; 0.0084 for drug-related arrests; and -0.022 for drug-related hospital ED episodes). Accounting for quadratic effects yields similar results.
This yields only 11 clusters for the 11 years of data that we use from the NHSDA/NSDUH. Cameron, Gelbach, and Miller (2008) caution that, in the case of few clusters (5-30), standard errors are usually biased downwards and may lead to over-rejection of the null. Several corrections have been proposed. The reported standard errors, for all specifications and datasets, are based on using the adjusted residuals rather than the OLS residuals as inputs into the cluster-robust variance estimator (CRVE). The adjustment scales the OLS residuals upward by (G/G-1)*(N-1/N-k)≈(G/G-1), where G represents the number of clusters, N is the number of observations, and k is the number of covariates, before using them as inputs in the CRVE. Inferences and standard errors remain robust to alternate corrections (noted in Cameron, Gelbach, and Miller 2008) such as the jackknife variance estimator and the pairs cluster bootstrap (based on 50 repetitions).
Estimates are not sensitive to the exclusion of high-school graduates from the target group.
The estimated effects of the other covariates (not shown) are consistent with the literature. Even in this relatively low-educated group of women, the least educated have a higher prevalence of drug use. Prevalence is also generally higher among non-Hispanic blacks and lower among other non-white non-Hispanics, relative to non-Hispanic whites. The age profile suggests a generally declining prevalence over the age range of the sample. Estimates are robust both to the inclusion of a measure of drug use as a minor and to the exclusion of all individual-level covariates (results not shown); for the former, it is notable that women who initiated drug use before age 18 were far more likely than those who initiated later or those who never initiated to be current drug users.
We conducted 3 additional sets of analyses to assess robustness and to further explore the NHSDA/NSDUH results (results not shown). First, we assessed the impact of actual welfare receipt on illicit drug use post-TANF among low-educated unmarried mothers. While welfare recipients in general are more likely than non-recipients to have used illicit drugs in the past year, their prevalence decreased by 3.8 percentage points (14%) post-TANF relative to non-recipients (see Corman et al. 2010). This estimate is consistent with those reported above, and captures the intent-to-treat effect among current welfare recipients. However, focusing solely on welfare recipients is potentially problematic if individuals leaving the welfare rolls are more likely to use drugs; in that case, compositional selection would lead welfare receipt to be negatively correlated with illicit drug use post-welfare reform. This issue underscores the importance of focusing primarily on all women at risk of welfare receipt. Second, we explored the possibility that our results were driven by women in specific age groups by re-estimating models for prior year drug use for subsamples of women age 21 to 34 years and those age 35 to 49. Those results indicate that welfare reform was associated with a decrease in illicit drug use for both groups. Third, we replicated the analyses for a measure of non-illicit substance use: binge drinking, defined as consumption of 5 or more drinks at one time. While some of the mechanisms through which welfare reform may have impacted illicit drug use could also pertain to binge drinking, we expect the effects on latter to be smaller because illicit drug use carried the additional risk of losing welfare benefits. Consistent with results of Kaestner and Tarlov (2006) based on the Behavioral Risk Factor Surveillance System, we found that welfare reform is associated with a decline in women's past month binge drinking by about 1.6-1.7 percentage points (about 10% relative to the baseline mean). Indeed, this effect magnitude is smaller than the declines in illicit drug use reported in Tables 2 and 3.
In other models (not reported), we specifically analyze arrests for drug possession. While this focus reduces the sample size (since, for some states and periods, drug-related arrests cannot be apportioned between those relating to possession versus those related to sales or trafficking), the effect magnitudes are expectedly larger. This is validating since drug possession is a more proximate indicator than any drug-related arrest of drug use. For those states and periods where we are able to differentiate arrests related to possession versus sales, drug possession comprises about 76% of total drug related arrests for women.
As discussed earlier, the lack of detailed demographic information relating to education or marital status precludes the sharper definition of target and comparison groups that was possible with the NHSDA/NSDUH and NCRP. It should be noted, however, that the majority of drug-related arrests among women are among low-educated women who are at a higher risk of welfare receipt. Nevertheless, since not all females who are arrested are likely to be impacted by welfare policy, the effect magnitudes are attenuated and should be interpreted as conservative estimates.
Contributor Information
Hope Corman, Rider University & National Bureau of Economic Research.
Dhaval M. Dave, Bentley University & National Bureau of Economic Research
Nancy E. Reichman, Robert Wood Johnson Medical School
Dhiman Das, Robert Wood Johnson Medical School.
References
- Bitler MP, Gelbach JB, Hoynes HW. Welfare Reform and Health. Journal of Human Resources. 2005;40(2):309–34. [Google Scholar]
- Bitler M, Hoynes H. Welfare Reform and Indirect Impacts on Health. In: Schoeni R, House J, Kaplan G, Pollack H, editors. Making Americans Healthier: Social and Economic Policy as Health Policy. New York: Russell Sage; 2008. pp. 231–80. [Google Scholar]
- Blank RM. Evaluating Welfare Reform in the United States. Journal of Economic Literature. 2002;40(4):1105–66. [Google Scholar]
- Cameron AC, Gelbach JB, Miller DL. Bootstrap-Based Improvements for Inference with Clustered Errors. Review of Economics and Statistics. 2008;90(3):414–27. [Google Scholar]
- Cawley J, Schroeder M, Simon K. Welfare Reform and the Health Insurance Coverage of Women and Children. Forum for Health Economics & Policy. 2005;8(1):1012–12. [Google Scholar]
- Cheng TC, McElderry C. How Do Drug Use and Social Relations Affect Welfare Participation? Social Service Review. 2007;81(1):155–65. [Google Scholar]
- Corman H, Dave D, Reichman NE, Das Dhiman. Effects of Welfare Reform on Illicit Drug Use of Adult Women. National Bureau of Economic Research Working Paper w16072. 2010 doi: 10.1111/j.1465-7295.2012.00459.x. [DOI] [PMC free article] [PubMed] [Google Scholar]
- Corman H, Noonan K, Reichman NE, Dave D. Demand for Illicit Drugs by Pregnant Women. In: Lindgren B, Grossman M, editors. Substance Use: Individual Behaviour, Social Interactions, Markets and Politics. Elsevier; 2005. pp. 41–60. [Google Scholar]
- Dave D, Decker S, Kaestner R, Simon K. The Effect of Medicaid Expansions on Health Insurance Coverage of Pregnant Women: An Analysis Using Deliveries. Inquiry. 2011;47(4):315–30. doi: 10.5034/inquiryjrnl_47.04.315. [DOI] [PubMed] [Google Scholar]
- DeLeire T, Levine JA, Levy H. Is Welfare Reform Responsible for Low-Skilled Women's Declining Health Insurance Coverage in the 1990s? Journal of Human Resources. 2006;41(3):495–528. [Google Scholar]
- Dobkin C, Puller SL. The Effects of Government Transfers on Monthly Cycles in Drug Abuse, Hospitalization and Mortality. Journal of Public Economics. 2007;91(11-12):2137–57. [Google Scholar]
- GAO. Various Factors May Limit the Impacts of Federal Laws That Provide for Denial of Selected Benefits. DC: U.S. Government Accountability Office; 2005. [Google Scholar]
- Gennetian LA, Knox V. Staying Single: The Effects of Welfare Reform Policies on Marriage and Cohabitation, 85. New York: Next Generation Working Paper Series; 2003. [Google Scholar]
- Grogger J. Time Limits and Welfare Use. Journal of Human Resources. 2004;39(2):405–24. [Google Scholar]
- Grogger J, Karoly LA. Welfare Reform: Effects of a Decade of Change. Cambridge, MA: Harvard University Press; 2005. [Google Scholar]
- Grossman M, Chaloupka F, Shim K. Illegal Drug Use and Public Policy. Health Affairs. 2002;21(2):134–45. doi: 10.1377/hlthaff.21.2.134. [DOI] [PubMed] [Google Scholar]
- Hartwell TD, Steele PD, French MT, Rodman NF. Prevalence of Drug Testing in the Workplace. Monthly Labor Review. 1996;119(11):35–42. [Google Scholar]
- Kaestner R. Drug Use and AFDC Participation: Is There a Connection? Journal of Policy Analysis and Management. 1998;17(3):495–520. [Google Scholar]
- Kaestner R, Kaushal N. Welfare Reform and Health Insurance Coverage of Low-Income Families. Journal of Health Economics. 2003;22(6):959–81. doi: 10.1016/j.jhealeco.2003.06.004. [DOI] [PubMed] [Google Scholar]
- Kaestner R, Lee WC. The Effect of Welfare Reform on Prenatal Care and Birth Weight. Health Economics. 2005;14(5):497–511. doi: 10.1002/hec.921. [DOI] [PubMed] [Google Scholar]
- Kaestner R, Tarlov E. Changes in the Welfare Caseload and the Health of Low-Educated Mothers. Journal of Policy Analysis and Management. 2006;25(3):623–43. doi: 10.1002/pam.20194. [DOI] [PubMed] [Google Scholar]
- Katz MB. The Price of Citizenship: Redefining the American Welfare State. New York, NY: Metropolitan Books, Henry Holt & Co.; 2001. [Google Scholar]
- Leonard J, Mas A. Welfare Reform, Time-Limits and Infant Health. Journal of Health Economics. 2008;27:1551–1566. doi: 10.1016/j.jhealeco.2008.05.013. [DOI] [PubMed] [Google Scholar]
- Levitt SD. Using Electoral Cycles in Police Hiring to Estimate the Effect of Police on Crime. American Economic Review. 1997;87(3):270–90. [Google Scholar]
- Meara E. Welfare Reform, Employment, and Drug and Alcohol Use Among Low-Income Women. Harvard Review of Psychiatry. 2006;14(4):223–32. doi: 10.1080/10673220600883150. [DOI] [PubMed] [Google Scholar]
- Meyer BD, Sullivan JX. The Effects of Welfare and Tax Reform: The Material Well-Being of Single Mothers in the 1980s and 1990s. Journal of Public Economics. 2004;88(7-8):1387–420. [Google Scholar]
- Moffitt RA. Incentive Effects of the US Welfare System: A Review. Journal of Economic Literature. 1992;30(1):1–61. [Google Scholar]
- Moffitt RA. Report to Congress on Out-of-Wedlock Childbearing. Washington: Department of Health and Human Services; 1995. The Effect of the Welfare System on Nonmarital Childbearing. 1995. [Google Scholar]
- Moffitt RA. The Effects of Welfare on Marriage and Fertility. In: Moffitt R, editor. Welfare, the Family, and Reproductive Behavior: Research Perspectives. Washington, D.C.: National Academy Press; 1998. pp. 50–97. [PubMed] [Google Scholar]
- Morris PA, Gennetian LA, Duncan GJ. Effects of Welfare and Employment Policies on Young Children: New Findings on Policy Experiments Conducted in the Early 1990s. 2005;20 SDRC. [Google Scholar]
- National Center for Health Statistics. Health, United States, 1990. Hyattsville, Maryland: Public Health Service; 1991. Table 57. [Google Scholar]
- Office of National Drug Control Policy. Drug Use Trends. Washington, DC: Executive Office of the President; 2002. Fact Sheet, available at: http://www.whitehousedrugpolicy.gov/publications/factsht/druguse/drugusetrends.pdf. [Google Scholar]
- Office of National Drug Control Policy. The Economic Costs of Drug Abuse in the United States: 1992–2002. Washington, DC: Executive Office of the President; 2004. Publication No. 207303. [Google Scholar]
- Paxson C, Waldfogel J. Work, Welfare, and Child Maltreatment. Journal of Labor Economics. 2002;20(3):435–74. [Google Scholar]
- Peters EH, Plotnick RD, Jeong SO. How Will Welfare Reform Affect Childbearing and Family Structure Decisions? In: Gordon R, Walberg H, editors. Changing Welfare. New York: Kluwer Academic/Plenum Publishers; 2003. pp. 59–91. [Google Scholar]
- Pollack HA, Danziger S, Seefeldt KS, Jayakody R. Substance Use Among Welfare Recipients: Trends and Policy Responses. Social Service Review. 2002;76(2):256–74. [Google Scholar]
- Ratcliffe C, McKernan SM, Rosenberg E. Welfare Reform, Living Arrangements, and Economic Well-Being: A Synthesis of Literature, 55. Washington, D.C.: The Urban Institute; 2002. [Google Scholar]
- Rubenstein G. The State of State Policy on TANF and Addiction: Findings from the Survey of State Policies and Practice to Address Alcohol and Drug Problems among TANF Recipients. Legal Action Center. [Accessed June 6, 2011];2002 Available at: http://www.lac.org/doc_library/lac/publications/state_of_state.pdf.
- Saffer H, Chaloupka FJ. Demographic Differentials in the Demand for Alcohol and Illicit Drugs. In: Grossman M, Bickel W, Saffer H, editors. The Economic Analysis of Subsance Use and Abuse: An Integration of Econometric and Behavioral Economic Research. Chicago, IL: University of Chicago Press; 1999. pp. 187–212. [Google Scholar]
- Schoeni RF, Blank RM. What Has Welfare Reform Accomplished? Impacts on Welfare Participation, Employment, Income, Poverty, and Family Structure. National Bureau of Economic Research Working Paper #7627. 2000 [Google Scholar]
- Shaner A, Eckman T, Roberts L. Disability Income, Cocaine Use, and Repeated Hospitalization Among Schizophrenic Cocaine Abusers - A Government-Sponsored Revolving Door? The New England Journal of Medicine. 1995;333(12):777–83. doi: 10.1056/NEJM199509213331207. [DOI] [PubMed] [Google Scholar]
- U.S. Department of Health and Human Services Peer Review Committee on National Household Survey on Drug Abuse. Evaluation of Results from the 1992 National Household Survey on Drug Abuse. 1993 Jun 3; Retrieved from U.S Department of Health and Human Services, Substance Abuse and Mental Health Services Administration website: http://www.oas.samhsa.gov/methodsHY/PeerReview92.pdf.
- Winship S, Jencks C. Evidence from the CPS Food Security Supplement. Cambridge, MA: Faculty Research Working Papers Series; 2004. How Did the Social Policy Changes of the 1990s Affect Material Hardship Among Single Mothers? p. 60. [Google Scholar]
- Ziliak JP. Taxes, transfers, and the labor supply of single mothers (Unpublished working paper, 2006) [Accessed June 6, 2011];2006 Retrieved from http://www.nber.org/∼confer/2006/URCf06/ziliak.pdf.