Abstract
Hearing aids help compensate for disorders of the ear by amplifying sound; however, their effectiveness also depends on the central auditory system's ability to represent and integrate spectral and temporal information delivered by the hearing aid. The authors report that the neural detection of time-varying acoustic cues contained in speech can be recorded in adult hearing aid users using the acoustic change complex (ACC). Seven adults (50–76 years) with mild to severe sensorineural hearing participated in the study. When presented with 2 identifiable consonant-vowel (CV) syllables (“shee” and “see”), the neural detection of CV transitions (as indicated by the presence of a P1-N1-P2 response) was different for each speech sound. More specifically, the latency of the evoked neural response coincided in time with the onset of the vowel, similar to the latency patterns the authors previously reported in normal-hearing listeners.
Keywords: P1-N1-P2 complex, N100, auditory evoked potentials (AEP), hearing aids, cortical auditory evoked potentials (CAEP), amplification, event-related potentials (ERP), acoustic change complex (ACC)
The amount of benefit hearing aids provide varies greatly among individuals with hearing loss. Several different factors might account for this variability.1 If hearing aids are set to provide too much or too little gain, listeners may experience discomfort or frustration. An individual's expectations can also influence how much benefit they receive from their amplification.2,3 Also, speech is a complex signal; to perceive it, listeners must have peripheral and central auditory systems that are capable of processing the spectral and temporal cues that differentiate speech signals. Therefore, performance variability might also be related to physiologic differences in the way speech sounds are processed. It is for this reason we are interested in examining the central auditory representation of amplified speech cues in people with hearing loss.
The P1-N1-P2 complex is 1 tool for assessing the neural representation of sound in populations with and without hearing loss. The P1-N1-P2 complex is an auditory evoked potential that is characterized by a positive peak (P1), followed by a negative peak with a latency of about 100 milliseconds after stimulus onset (N1), followed by a positive peak called P2.4 These peaks reflect neural activity generated by multiple sources in the thalamic-cortical segment of the central auditory system.4–6
A number of studies have used the P1-N1-P2 complex to assess the neural representation of acoustic changes contained in speech. Ostroff et al7 demonstrated that the P1-N1-P2 complex could be elicited by time-varying acoustic changes within a naturally produced speech stimulus. They found multiple overlapping P1-N1-P2 responses in response to the naturally produced syllable /sei/. The first P1-N1-P2 complex reflected the onset of the sibilant /s/; the second P1-N1-P2 response reflected the consonant-vowel (CV) transition (/s/ to /ei/). Because these complex waveform patterns were shown to reflect acoustic changes, from silence to sound (onset of consonant /s/) and the CV transition (from /s/ to /ei/), Martin and Boothroyd8 termed this evoked response the acoustic change complex (ACC).
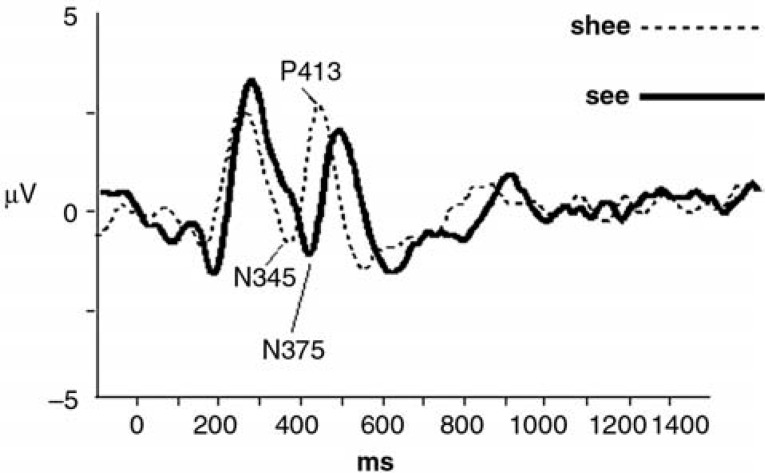
Tremblay et al9 examined ACC patterns in normal-hearing young adults, evoked by 2 different speech stimuli, “shee” and “see” (Figure 1). These particular stimuli were chosen because they share similar acoustic features and are frequently confused by listeners with hearing loss. “Shee” and “see” are similar in that they are fricatives (Table 1). They are different in that (1) “shee” and “see” differ by place of articulation, (2) the fricative portion of “shee” contains lower spectral energy than the fricative portion of “see,”10 and (3) the fricative portion of “shee” is shorter in duration than the fricative portion of “see.”
Figure 1.
The acoustic change complex (ACC) grand averaged responses recorded from normal-hearing subjects, in response to speech stimuli “shee” and “see.” N345 and P413, signaling the consonant-vowel transition, occur significantly earlier for “shee” (dashed line) than for “see” (solid line). Reprinted with permission from Tremblay KL, Friesen L, Martin BA, Wright R. Test-retest reliability of cortical evoked potentials using naturally-produced speech sounds. Ear Hear. 2003; 24;225–232.
Table 1.
Comparison of the Acoustic Characteristics of “See” and “Shee” Speech Tokens
| See | Shee | |
|---|---|---|
| Manner | Fricative-strident | Fricative-strident |
| Place | Alveolar | Palatal |
| Fricative duration | Longer | Shorter |
| CV transition | Later | Earlier |
| Spectral energy frequencies | Higher | Extends to lower frequencies |
| Major region of noise energy10 | Above 4 kHz | Extends down to 3 kHz |
| Duration (specific to the NST stimuli) | 756.30 ms | 654.98 ms |
Note: CV, consonant-vowel; NST, Nonsense Syllable Test.
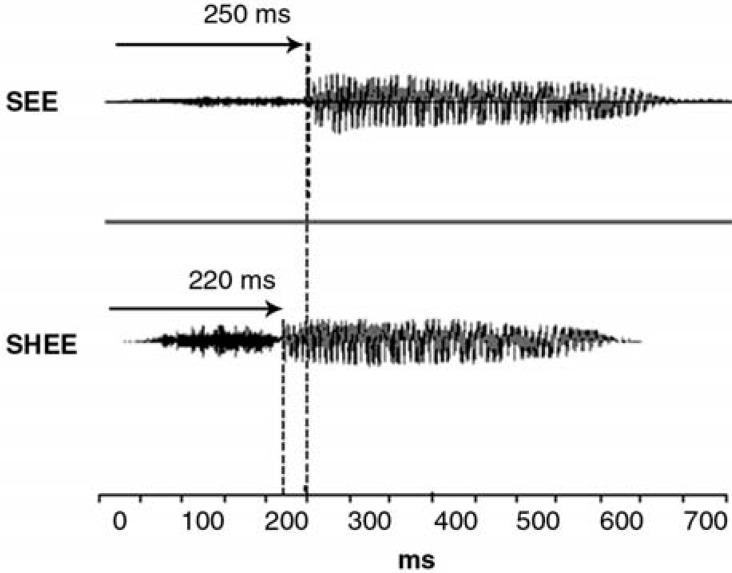
As shown in Figure 1, Tremblay et al9 found that “shee” and “see” each elicit distinct ACC responses. The first negative peak, signaling the onset of the consonant, was not significantly different for the “shee” and “see” stimuli. However, the second P1-N1-P2 complex (N345 and P413), presumably reflecting the CV transition, occurred significantly earlier when evoked by the “shee” stimulus than when evoked by “see.” As seen in Figure 2, onset of the vowel in “shee” occurs 30 milliseconds earlier than the onset of the vowel portion in “see” (Figure 2). This 30-millisecond difference appears to correspond to the 30-millisecond latency difference between the negative peak N345 elicited by the “shee” stimulus and the negative peak N375 elicited by the “see” stimulus (Figure 1).
Figure 2.
Acoustic waveforms of unamplified stimuli “see” and “shee.” The consonant-vowel transition occurs approximately 30 milliseconds earlier for “shee,” than for “see.”
Because we are interested in knowing whether successful hearing aid users have different neural response patterns than do unsuccessful hearing aid users, it is important to determine whether the ACC can be recorded in hearing-impaired listeners who wear hearing aids. To date, we have established that the ACC can be reliably recorded in normal-hearing individuals while wearing hearing aids and that “shee” and “see” speech sounds evoke response patterns that are different from each other.11 It is not known, however, if acoustic changes, such as CV transitions, can be recorded in hearing-impaired individuals who wear hearing aids. Hearing aid users have experienced auditory deprivation that has likely altered spectral and temporal coding throughout the central auditory system,12 and hearing aids alter the spectral and temporal information of the signal. These factors may negatively affect synchronous patterns of neural activity representing acoustic cues that help distinguish one speech sound from another.
Therefore, to learn more about the effects of amplification and hearing loss on the neural representation of CV transitions, we conducted a feasibility study. Once again, stimuli “see” and “shee” were used to evoke the ACC, but this time in hearing aid users with hearing loss. Because these participants could correctly identify “see” and “shee,” it was assumed that some of the acoustic cues, such as the CV transition, were being transmitted and encoded in the auditory cortex. We therefore hypothesized that the P1-N1-P2 response, signaling CV transitions, would be earlier for “shee” compared to “see.”
Methods
Subjects
Subjects included 7 adults aged 50 to 76 years (mean, 63.8; SD, 9.2) with mild to severe bilateral sensorineural hearing loss (Table 2). They had normal immittance results, defined as peak pressure between −150 and +50 daPa, and admittance between 0.3 and 1.4 mL.13 They were right-handed, reported no history of Meniere's disease or neurologic disorders, and had at least 6 months of bilateral hearing aid experience. All subjects provided written consent (using University of Washington Institutional Review Board–approved forms) before participating in the experiment.
Table 2.
Right Ear Air Conduction Thresholds (dB hearing level)
| Subject Number | 250 Hz | 500 Hz | 1000 Hz | 2000 Hz | 3000 Hz | 4000 Hz | 6000 Hz | 8000 Hz |
|---|---|---|---|---|---|---|---|---|
| 1 | 10 | 15 | 40 | 55 | 55 | 75 | 70 | 65 |
| 2 | 32 | 28 | 22 | 38 | 58 | 58 | 68 | 78 |
| 3 | 36 | 52 | 62 | 64 | 66 | 54 | 54 | 68 |
| 4 | 12 | 32 | 38 | 50 | 46 | 36 | 24 | 44 |
| 5 | 32 | 44 | 46 | 50 | 64 | 58 | 80 | 88 |
| 6 | 18 | 22 | 26 | 38 | 58 | 48 | 50 | 48 |
| 7 | 25 | 35 | 40 | 55 | 60 | 65 | 65 | 60 |
| Mean | 23 | 33 | 39 | 55 | 58 | 56 | 59 | 64 |
Stimuli
Two naturally produced CV syllables “shee” and “see” from the standardized University of California, Los Angeles (UCLA) version of the Nonsense Syllable Test (NST) were used.14 Stimulus durations were “shee” = 654.98 milliseconds and “see” = 756.30 milliseconds. Although these stimuli are frequently difficult to identify in individuals with hearing loss, in this experiment only subjects who could correctly identify “see” and “shee” participated in this study.∗
Procedure
Hearing aid fitting. All participants were tested monaurally wearing a customized earmold in the right ear. To avoid any potential interactions that might be introduced by a second hearing aid (eg, circuitry differences, aided thresholds) only 1 ear was tested. Skeleton-style acrylic earmolds with a medium canal length, size 13 tubing, and a parallel vent were used. All participants wore the same Phonak Piconet2 P2 AZ behind-the-ear (BTE) hearing aid in the right ear and a foam earplug in their left ear.
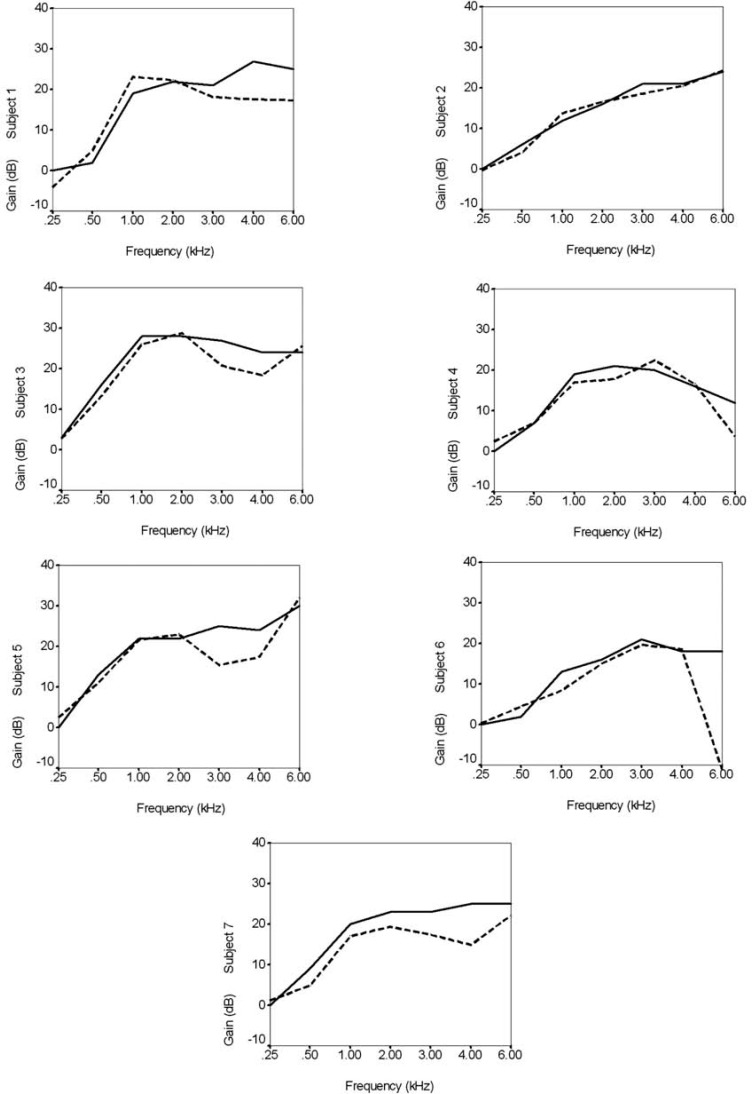
The hearing aid was set to omnidirectional and super compression + adaptive release time (SC+ART), Phonak's compression limiting setting. The hearing aid was fit using the Phonak Fitting Guide in NOAH and the Fonix 6500 electroacoustic analyzer. The amount of gain provided by the hearing aid was individually set for each subject according to the National Acoustic Laboratories Revised (NAL-R)15 prescriptive method. The volume wheel was inactivated so that subjects could not alter the amount of gain provided by the hearing aid. Probe microphone tests were performed on each participant using a 70 dB sound pressure level (dB SPL) input level at 45 degrees azimuth. Figure 3 shows the prescribed and measured real ear insertion gain for each subject. The mean match to target across subjects was within 5 dB at 0.25, 0.5, 1, 2, and 3 kHz, and within 10 dB at 4 kHz.
Figure 3.
Match to hearing aid prescriptive target for each subject. In each panel, the solid line shows the prescribed real ear insertion gain and the dashed line shows the measured real ear insertion gain.
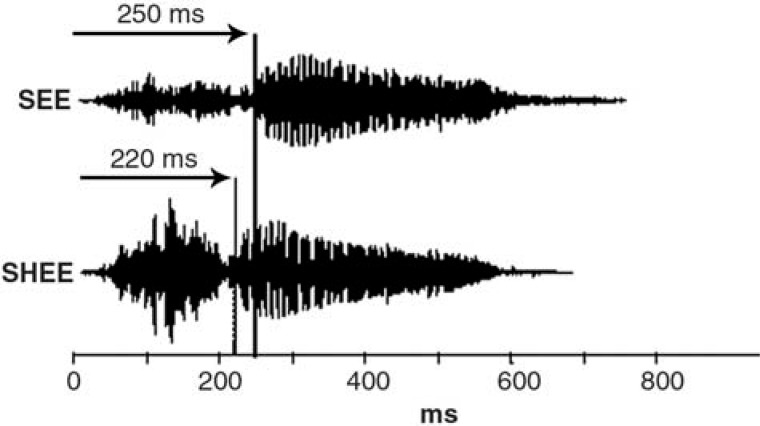
Electroacoustic properties of the Phonak2 P2 AZ hearing aid. According to Phonak specifications, the frequency range of this hearing aid extends from 210 to 6500 Hz. The peak full-on gain is 53 dB, and the high frequency average full-on gain is 49 dB. As mentioned earlier, the amount of gain provided to each subject was individually set according to the NAL-R prescriptive method. Because the goal of this prescriptive method is to maximize speech intelligibility and because all subjects have sloping hearing loss, it provides more gain in the high frequencies than in the low frequencies. Despite these characteristics, in this linear hearing aid the boundary between the fricative and vowel is preserved. Acoustic recordings were measured at the output of the hearing aid in each listener's ear. The procedure is more fully described in the companion article.16 Briefly, a probe microphone was placed in the listener's ear, with the tip of the probe tube extending 5 mm beyond the medial tip of the earmold. Output of the probe microphone was digitized (44.1 kHz sampling rate) and stored on a computer hard drive for later analysis and viewing using a sound-editing program. In each case, there was approximately a 30-millisecond difference between CV transition for the amplified “shee” and “see” stimuli. An example is shown in Figure 4.
Figure 4.
Acoustic waveforms of the stimuli “see” and “shee” recorded from the output of the hearing aid in a listener's ear. The consonant-vowel transition appears to be preserved in both speech sounds.
Electrophysiology
Participants were seated in a sound-attenuated booth, 1 m in front of a JBL Professional LSR25P Bi-Amplified speaker (0 degrees azimuth). The output of the speaker was calibrated at a level of 70 dB peSPL using a sound level meter. Each stimulus was presented 250 times in a homogenous sequence. For example, the stimulus “see” was presented 250 times to generate a single averaged response for this particular syllable. This procedure was repeated for the stimulus “shee.” Stimulus presentation order was counterbalanced across subjects. A personal computer–based system controlled the timing of stimulus presentation and delivered an external trigger to the evoked potential recording system. The interstimulus interval was 1910 milliseconds. Participants were instructed to ignore the stimuli and watch a closed-captioned video of their choice.
Electroencephalographic (EEG) activity was recorded using a 32 channel Neuroscan system. The ground electrode was located on the forehead, and the reference electrode was placed on the nose. Eye blink activity was monitored using an additional channel with electrodes located superiorly and inferiorly to 1 eye and at the outer canthi of both eyes. Ocular artifacts exceeding ±80 μV were rejected from averaging. The recording window consisted of a 100-millisecond prestimulus period and a 1400-millisecond poststimulus time. Evoked responses were analog band-pass filtered online from 0.15 to 100 Hz (12 dB/octave roll-off). All EEG channels were amplified with a gain of 500 and converted using an analog-to-digital rate of 1000 Hz. After eye-blink rejection, the remaining sweeps were averaged and filtered off-line from 1.0 Hz (high-pass filter, 24 dB/octave) to 20.0 Hz (low-pass filter, 6 dB/octave).
Results
All peaks are described in terms of latency. In other words, the N1 response coinciding in time with the CV transition in “shee” is described as N332 because it occurs 332 milliseconds after stimulus onset.
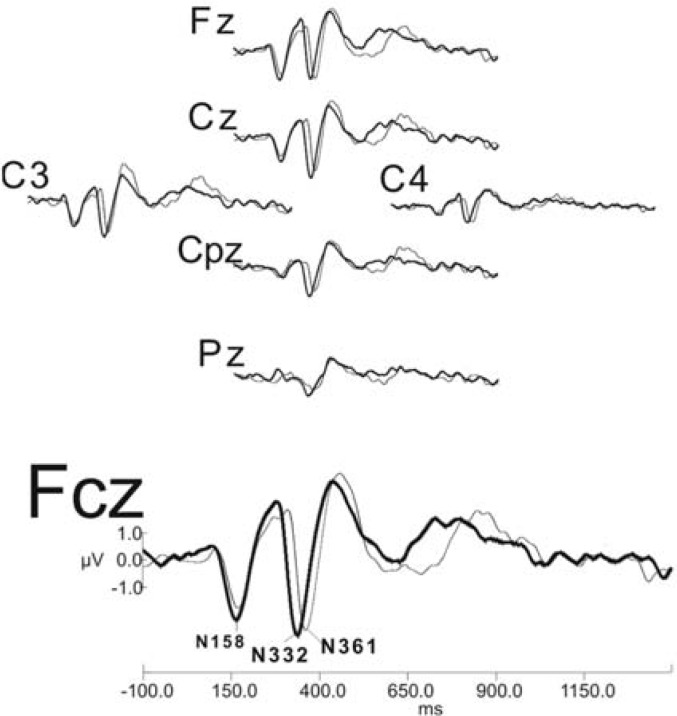
Grand mean waveforms, from multiple electrode sites, are shown in Figure 5. The 2 stimuli “shee” and “see” each elicit distinct waveforms. As typically reported in the literature, P1-N1-P2 responses are larger over frontal electrodes (eg, Fz and Fcz) and become smaller over parietal sites (eg, Pz). Also, evoked neural activity is larger over the hemisphere contralateral to the ear of stimulation. For example, we stimulated the right ear, and P1-N1-P2 responses are larger for C3 (left hemisphere) than for C4 (right hemisphere).
Figure 5.
Grand average waveforms (n = 7), in response to the amplified stimuli “see” and “shee,” as recorded from a representative sample of electrode sites. The “shee” response is shown as a thick line and the “see” response is shown as a thin line. As shown at electrode site Fcz, N332, signaling the consonant-vowel transition in “shee,” appears earlier than the peak signaling the CV transition (N361) in “see.”
Statistical comparisons were made from electrode site Fcz because the response pattern appeared largest at this location. The negative peak (N1), shown here as N332, evoked by the CV transition appears 29.57 milliseconds earlier for the “shee” stimulus. The mean latency value of this response is 331.86 milliseconds for “shee” and 361.43 milliseconds for “see.” To determine whether the 29.57-millisecond difference between stimuli was significant, a Bonferroni-corrected paired t test was conducted, and this latency difference proved to be significant (t = 10.75, df = 6, P < .001).
To determine whether the amplification differentially altered the onset of consonants /s/ and /sh/, a Bonferroni-corrected t test was used to compare the first N1 response (N158 for “shee” and N177 for “see”) signaling the onset of the consonant. No significant latency (t = 2.03, df = 6, P > .05) or amplitude differences (t = 0.59, df = 6, P > .05) were found.
Discussion
Before the present study, the ACC (signaling the CV transition in “see” and “shee”) had been studied in normal-hearing listeners fit with hearing aids. If one is interested in using speech evoked cortical potentials to assess the neural detection of time-varying cues in clinical populations, it is necessary to determine whether these evoked responses could be recorded in people with hearing loss while wearing hearing aids.
Similar to the results of Tremblay et al,9,11 “see” and “shee” elicited distinct ACC neural response patterns. The CV transition for “shee” evoked a negative peak that was earlier than the corresponding peak evoked by “see.” The 29-millisecond difference between N332 and N361 approximated the 30-millisecond vowel onset difference reported by Tremblay et al.9,11 These findings are somewhat surprising because the speech signals were altered by the hearing aid and delivered to an auditory system that had experienced years of auditory deprivation. The combination of age and age-related hearing loss can affect the physiologic representation of time-varying cues.17,19 However, if one takes into consideration that the CV transition was preserved by the hearing aid (as shown in Figure 4), that audibility was sufficient for each listener (Figure 3), and that the stimuli could be correctly identified by each hearing aid user, these results would be expected. In fact, we recently reported similar results in cochlear implant users.18
Results of the present study are encouraging because they introduce a new direction of research. If the neural detection of acoustic changes can be recorded in hearing-impaired individuals while wearing a hearing aid, it might also be possible to characterize the individual neural response patterns of good and poor perceivers. As mentioned earlier, there is a large range of performance variability among hearing aid users. This variability could be related to how the central auditory system detects acoustic cues contained in speech. Perhaps people who struggle to understand speech while wearing their hearing aids have neural activation patterns that are different from those in people who receive great benefit from their hearing aids. And if so, would it be possible to modify the neural response pattern by manipulating the way the hearing aid is processing the signal?
Before these questions can be asked, however, it will be necessary to determine the relationship between evoked neural response patterns and perception, using more speech sounds, and to determine whether hearing aid modifications alter neural response patterns. Thus far, we have focused on the neural detection of CV transitions in people who could perceive the stimuli. It would be interesting to examine neural response patterns elicited by the amplified “see” and “shee” stimuli in individuals who are unable to differentiate these 2 stimuli and compare them to the results of the present study.
It will also be important to refine our EEG methods to examine more subtle spectral cues of speech. In this study we focused on the CV transition as a method for comparing “see” and “shee.” However, as described earlier (Table 2), there are other more critical acoustic cues that differentiate “see” and “shee.” For example, the fricative portion of “shee” contains lower spectral energy than does the fricative portion of “see.” Despite these acoustic differences, neither the study by Tremblay et al9 nor the current study found significant latency or amplitude differences in the neural response patterns used to distinguish one consonant from another, at least not at the electrode sites we measured.
Also, we are just begining to understand the interaction between amplified signals and their neural representation. Although we were able to record the physiologic detection of CV transitions in this group of hearing aid wearers, using this particular hearing aid, results might vary with different signal-processing characteristics. The P1-N1-P2 evoked neural response patterns is heavily influenced by the acoustic content of the evoking signal, and hearing aids alter the acoustic content of the signal. This makes the hearing aid a separate source of variables. Because we have not always found the expected effects of amplification on evoked neural activity,11 we will need to learn more about the output of the hearing aid and how the processed signal is represented in the brain.
A final point to keep in mind is that perception involves more than the physiologic detection of acoustic changes.1 Attention, memory, and cognition also play important roles. Although physiologic measures can provide information about the neural coding of available acoustic cues by the listener's auditory system and can be used to examine the acoustic consequences of hearing aid processing, the physiological detection of sound represents only 1 of the many stages involved in speech-sound perception.
Conclusion
To summarize, hearing aids help compensate for disorders of the ear by amplifying sound; however, their effectiveness also depends on the central auditory system's ability to represent and integrate spectral and temporal information delivered by the hearing aid. The neural detection of some time-varying acoustic cues contained in speech can be recorded using P1-N1-P2 complexes (or the ACC). In this feasibility study, we demontrated that the neural detection of CV transitions (for “see” and “shee” stimuli) can be measured in individuals with hearing loss while wearing a hearing aid.
Acknowledgments
Portions of this article were submitted to the University of Washington Graduate School to fulfill the requirements of a master's thesis by L. Kalstein. The authors acknowledge the assistance of Allison Cunningham, Lendra Friesen, Richard Folsom, Buffy Robinson, and Neeru Rohila. Also acknowledged is funding from the American Federation for Aging Research (AFAR).
Footnotes
Behavioral data were collected using the exact same procedures (presentation level, sound field conditions, hearing aid settings, etc.) described in the Methods section of this article. The only exception is that all 22 tokens (spoken by a female speaker) of the University of California, Los Angeles (UCLA) version of the Nonsense Syllable Test (NST) were presented.14 Single presentations of each of the 22 tokens were presented in random order using ECoS/Win software. Subjects were instructed to select the syllable they heard using a computer mouse. Each token was presented in text, in alphabetical order, on a computer screen. To ensure subjects understood the task, subjects were given practice sessions. After the practice session, participants heard 10 randomized presentations of each of the 22 stimulus tokens. No feedback was provided, and there was no response time limit during this test session. Percentages of correct scores were then extracted for “see” and “shee.”
References
- 1.Souza PE, Tremblay KL. New perspectives on assessing amplification effects. Trends Amplif. 2006;10: XX–XX [DOI] [PMC free article] [PubMed] [Google Scholar]
- 2.Cox RM, Alexander GC. Expectations about hearing aids and their relationship to fitting outcome. J Am Acad Audiol. 2000;11: 368–382 [PubMed] [Google Scholar]
- 3.Schum DJ. Perceived hearing aid benefit in relation to perceived needs. J Am Acad Audiol. 1999;10: 40–45 [PubMed] [Google Scholar]
- 4.Naatanen R, Picton T. The N1 wave of the human electric and magnetic response to sound: a reveiw and analysis of the component structure. Psychophysiology. 1987;24: 375–425 [DOI] [PubMed] [Google Scholar]
- 5.Wolpaw JR, Penry JK. A temporal component of the auditory evoked response. Electroencephalogr Clin Neurophysiol. 1975;39: 609–620 [DOI] [PubMed] [Google Scholar]
- 6.Woods D. The component structure of the N1 wave of the human auditory evoked potential. Electroencephalogr Clin Neurophysiol Suppl. 1995;44: 102–109 [PubMed] [Google Scholar]
- 7.Ostroff JM, Martin BA, Boothroyd A. Cortical evoked responses to spectral change within a syllable. Ear Hear. 1998;19: 290–297 [DOI] [PubMed] [Google Scholar]
- 8.Martin BA, Boothroyd A. Cortical, auditory, event-related potentials in response to periodic and aperiodic stimuli with the same spectral envelope. Ear Hear. 1999;20: 33–44 [DOI] [PubMed] [Google Scholar]
- 9.Tremblay KL, Friesen L, Martin BA, Wright R. Test-retest reliability of cortical evoked potentials using naturally-produced speech sounds. Ear Hear. 2003;24;225–232 [DOI] [PubMed] [Google Scholar]
- 10.Kent R, Read C. The Acoustic Analysis of Speech. New York, NY: Thomson Learning; 2002 [Google Scholar]
- 11.Tremblay KL, Billings CJ, Friesen LM, Souza PE. Neural representation of amplified speech sounds. Ear Hear. 2006;27: 93–103 [DOI] [PubMed] [Google Scholar]
- 12.Willott JF, Hnath Chisolm T, Lister JJ. Modulation of presbycusis: current status and future directions. Audiol Neurootol. 2001;6: 231–249 [DOI] [PubMed] [Google Scholar]
- 13.Roup CM, Wiley TL, Safady SH, Stoppenbach DT. Tympanometric screening norms for adults. Am J Audiol. 1998;7: 55–60 [DOI] [PubMed] [Google Scholar]
- 14.Dubno JR, Schaefer AB. Comparison of frequency selectivity and consonant recognition among hearing-impaired and masked normal-hearing listeners. J Acoust Soc Am. 1992;91(4 pt 1): 2110–2121 [DOI] [PubMed] [Google Scholar]
- 15.Byrne D, Dillon H. The National Acoustic Laboratories' (NAL) new procedure for selecting the gain and frequency response of a hearing aid. Ear Hear. 1986;7: 257–265 [DOI] [PubMed] [Google Scholar]
- 16.Caldwell M, Souza P, Tremblay K. Effects of probe microphone placement on the measurement of speech in the external ear canal. Trends Amplif. 2006;10: XX–XX [DOI] [PMC free article] [PubMed] [Google Scholar]
- 17.Harkrider AW, Plyler PN, Hedrick MS. Effects of age and spectral shaping on perception and neural representation of stop consonant stimuli. Clin Neurophysiol. 2005;116: 2153–2164 [DOI] [PubMed] [Google Scholar]
- 18.Friesen LM, Tremblay KL. Acoustic change complexes (ACC) recorded in adult cochlear implant listeners. Ear Hear. In press. [DOI] [PubMed] [Google Scholar]
- 19.Tremblay KL, Piskosz M, Souza PE. Effects of age and age-related hearing loss on the neural representation of speech cues. Clin Neurophysiol. 2003;114: 1332–1343 [DOI] [PubMed] [Google Scholar]


