Abstract
The Desired Sensation Level (DSL) Method was revised to support hearing instrument fitting for infants, young children, and adults who use modern hearing instrument technologies, including multichannel compression, expansion, and multimemory capability. The aims of this revision are to maintain aspects of the previous versions of the DSL Method that have been supported by research, while extending the method to account for adult-child differences in preference and listening requirements. The goals of this version (5.0) include avoiding loudness discomfort, selecting a frequency response that meets audibility requirements, choosing compression characteristics that appropriately match technology to the user's needs, and accommodating the overall prescription to meet individual needs for use in various listening environments. This review summarizes the status of research on the use of the DSL Method with pediatric and adult populations and presents a series of revisions that have been made during the generation of DSL v5.0. This article concludes with case examples that illustrate key differences between the DSL v4.1 and DSL v5.0 prescriptions.
Work that Leads to the 2005 Algorithm
As summarized by Seewald et al. in this issue (2005), the DSL Method was revised to accommodate the prescription of linear vs nonlinear hearing instruments (Cornelisse et al., 1995). Since that revision, DSL[i/o] has been evaluated in both adult and pediatric populations in a number of studies. In this chapter, we will summarize the current status of DSL evaluation work in children and adults and argue the need for different prescriptive targets for adults and children. We will also present research describing electroacoustic and signal processing issues that have motivated us to make modifications to the input/output structure of the DSL target functions. These modifications will be described, and several case studies will illustrate the magnitude and type of changes to prescriptive targets in DSL v5.0.
Outcomes for Children
Studies using the DSL Method with the pediatric population have been done with various aims and purposes. Some studies have sought to determine whether DSL-related outcomes differ from those of alternative fittings (Snik and Stollman, 1995; Snik et al., 1995; Ching et al., 1997; Scollie et al. 2000) or to compare subversions of DSL such as linear vs nonlinear (Jenstad et al., 1999; Jenstad et al., 2000). Other studies have used DSL as the fitting method within general pediatric hearing and amplification research, such as when evaluating signal processing options or audibility effects in children with hearing loss (Moeller et al., 1996; Bamford et al., 1999; Christensen, 1999; Gravel et al., 1999; Hanin, 1999; Lear et al., 1999; Pittman and Stelmachowicz, 2000; Stelmachowicz et al., 2000; Stelmachowicz et al., 2001; Condie et al., 2002; Stelmachowicz et al., 2002). Other authors incorporate the DSL Method, including the associated clinical procedures described by Bagatto et al., 2005, within recommended clinical guidelines for pediatric amplification (e.g., The Pediatric Working Group 1996; American Academy of Audiology, 2004).
Ongoing research will, therefore, likely always strive to determine the best methods for prescribing the signal processing characteristics of hearing instruments to optimize children's hearing (Scollie, 2005). Furthermore, children's preferences for DSL over an alternative fitting procedure may be influenced by their previous listening experience (Ching et al., 1997; Scollie et al., 2000) and, therefore, are difficult to interpret at this time. Until more definitive evaluation is available, it may be fair to say that the DSL Method is widely used in pediatric audiology and is known to significantly improve children's speech recognition scores over unaided performance (Jenstad et al., 1999). In addition, low-level speech recognition and loudness normalization are improved when a nonlinear version of the DSL prescription is used (Jenstad et al., 1999; Jenstad et al., 2000). The changes to the DSL Method that are described by Bagatto et al., 2005, and in the remainder of this chapter, are aimed at preserving many of the prescriptive characteristics, particularly for the pediatric population.
Outcomes for Adults
During the late 1990s, the DSL[i/o] prescription began to be used with the adult population, in addition to pediatric applications. This was likely because of a number of factors.
First, the DSL v4.1 Method, along with the VIOLA procedure (Cox and Flamme, 1998) and the Fig 6 procedure (Gitles and Niquette, 1995) were nonlinear prescriptive methods that were available at a time when wide-dynamic-range compression (WDRC) hearing instruments gained widespread clinical acceptance.
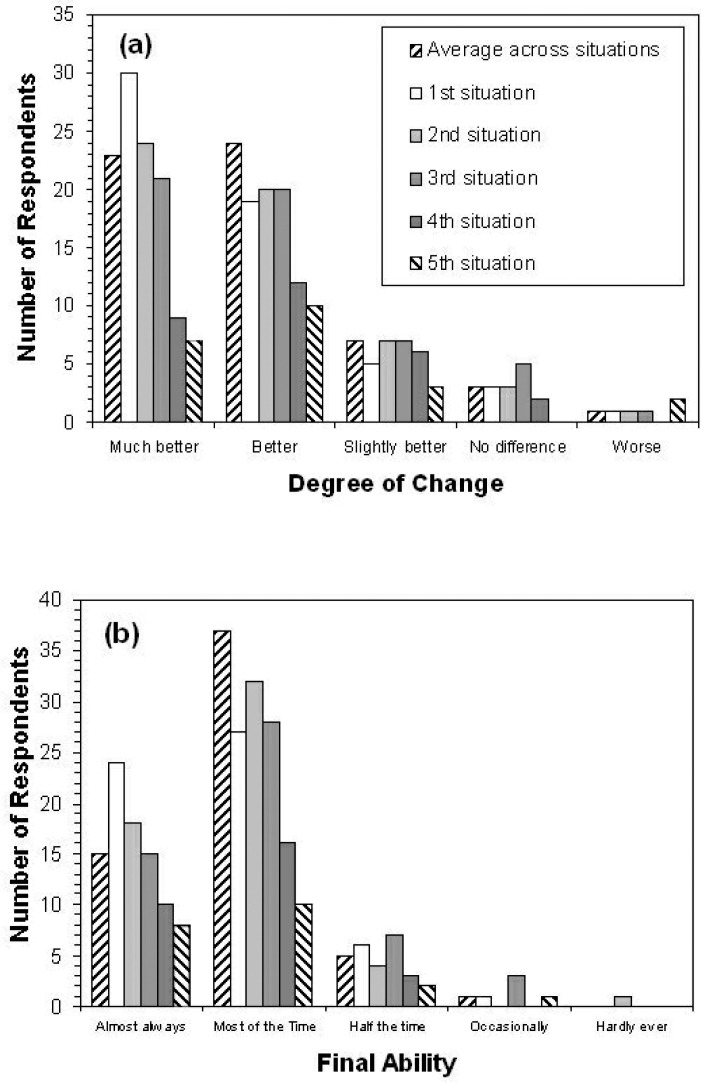
Figure 6.
Results of the Client Oriented Scale of Improvement for a sample of adult hearing instrument users fitted using the DSL Method. Panel A shows Degree of Change scores. Panel B shows Final Ability scores. Each bar indicates the number of respondents indicating a given outcome rating. Results are shown for the self-nominated communication situations, in order of situation priority, as well as the average rating across situations for each listener.
Second, the DSL Method became implemented in various manufacturers’ hearing instrument programming or test software, or both, and was thus accessible for clinical use. Some clinics began to apply it with the adult population, often with the view of using the target as a benchmark that indicated the point at which full audibility of speech cues was likely (e.g., Parsons and Clark, 2002). This was the case within the University of Western Ontario Speech and Hearing Clinic, in which the audiologists applied the clinical protocols of the DSL Method with their adult clients but would modify the gain of the hearing instrument fitting, if necessary, to client preference. Our anecdotal experience with this approach was that some adults would use and adjust to the prescribed gain, but others would not. However, these experiences are not able to generate specific, quantitative estimates of the degree of adjustment required or determine whether the adjustment magnitude interacted with degree of hearing loss, input level, or other factors.
Published results of using DSL[i/o] with adults have been somewhat mixed. Some studies show positive and acceptable results (Humes, 1999; Hornsby and Ricketts, 2003); others show good speech recognition but higher loudness ratings than would be ideal (Lindley and Palmer, 1997; Alcántara et al., 2004; Smeds, 2004). Higher loudness ratings tend to be more pronounced with higher-level inputs or higher frequencies, or both.
Clinical trials that have compared DSL[i/o] with alternative fitting procedures generally have shown that adults prefer less gain than prescribed by DSL, either from a lower-gain prescription such as CAMFIT (Moore et al., 2001) or from a patient-driven procedure that customizes gains to preference (Lindley and Palmer, 1997).
Between 1999 and 2000, we entered into a clinical collaboration with two audiology clinics that routinely used the DSL Method v4.1 with their adult populations. The audiologists at these clinics were interested in beginning a routine hearing instrument outcome test battery, in part because of the recent attention outcome measurement has received in the literature (e.g., Humes, 1999). The summary below will describe this study and the results we obtained.
London Health Sciences Centre/Nova Scotia Speech and Hearing Clinic Study of using DSL[i/o] with Adults
The purpose of this study was to define and quantify the effectiveness of the DSL Method in an adult population. Specifically, we wished to measure hearing instrument benefit and performance outcomes in clinics that routinely used the DSL Method with an adult population. This study dealt with effectiveness (i.e., outcomes in a real clinical environment, across a variety of locations, hearing instruments, and hearing losses) rather than efficacy (i.e., a more controlled trial with certain hearing instruments and losses).
Participants
Nineteen volunteers, aged 24 to 40 years, with a mean of 28 years, were recruited from the School of Communication Sciences and Disorders at the University of Western Ontario and from the staff at the London Health Sciences Centre and the Nova Scotia Speech and Hearing Clinic. All subjects had normal hearing thresholds bilaterally (at or below 20 dB hearing level [HL]) as determined by a pretest screening for the frequencies of 500, 1000, and 2000 Hz.
Fifty-nine patients with a mean age of 70 years (range, 38 to 100 years) were recruited from routine clinical caseload1 and included both previous and new hearing instrument users. All subjects had acquired, predominantly sensorineural hearing losses. As determined by four frequency pure-tone threshold averages (500, 1000, 2000, and 4000 Hz from both ears), the mean degree of hearing loss was 44 dB HL (range, 20 dB HL to 98 dB HL). The participants were clients of the Nova Scotia Speech and Hearing Clinic (Amherst and Truro sites) and the London Health Sciences Centre.
Assessment, Prescription, and Baseline
In addition to routine audiometric assessment, loudness discomfort levels were measured at 500 and 3000 Hz by using the instructions, psychometric procedure, and rating scale described by Hawkins et al. (1987), carried out under insert phones. Also, individual real-ear measures were used to quantify the HL-to-SPL (sound pressure level) transform appropriate to either TDH or insert earphones. These were the real-ear-to-dial difference (REDD) and real-ear-to-coupler difference (RECD), respectively (Bagatto et al., 2005). Prescriptive targets were generated by using the DSL [i/o] algorithm as implemented in the Audioscan RM 500 (Cole and Sinclair, 1998). Hearing instruments were individually selected, taking into account the needs, preferences, and financial resources of the patient. During the fitting appointment, unaided speech perception testing, and the prefitting portion of a questionnaire for self-reported hearing instrument benefit and satisfaction were administered.
Verification and Validation
For new hearing instrument users, outcome measures were targeted for completion approximately 4 weeks after the initial hearing instrument fitting, assuming no physical fit or feedback problems. If significant problems with the fitting occurred or if other changes to the fitting were indicated, the outcome measurement was suspended until a satisfactory fitting was obtained. The observed trial period for new hearing instrument users was therefore extremely variable, but all 31 users did receive some period of use before the outcome evaluation (average trial period, 51 days; range, 7 to 272 days). For long-term hearing instrument users, the outcome evaluation proceeded either with their own hearing instruments in 8 or after provision of replacement hearing instruments in 20 (average trial period, 53 days; range, 0 to 164 days). The frequency response and maximum output were verified by using either 2-cc-coupler simulations of ear canal levels (Seewald et al., 1999) or by direct measurement of the real-ear aided response (REAR) with the Audioscan RM500. If the hearing instrument fitting was judged to be electroacoustically adequate and the client reported that the fitting was physically comfortable, the audiologist administered a test battery of outcome measures, as follows:
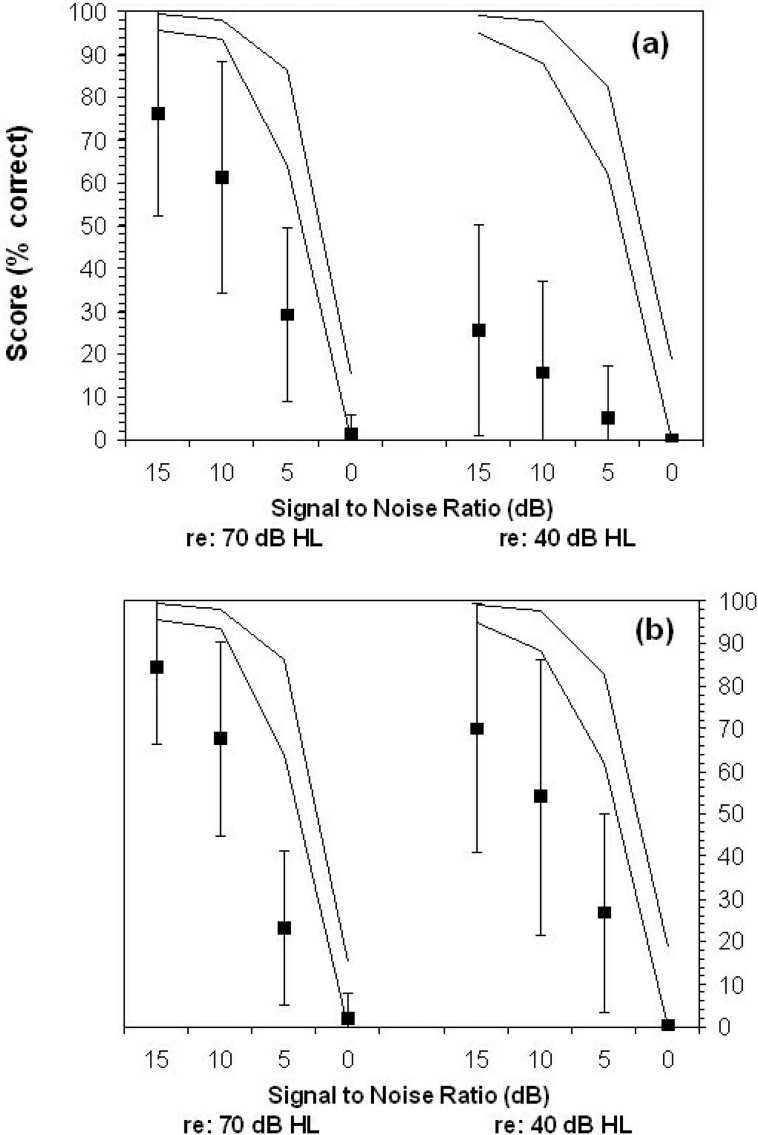
Speech recognition in noise was measured with the Speech-in-Noise test developed by Etymotic Research (Killion, 1997; Villchur, 1993; Killion and Villchur, 1993). The test evaluates speech recognition across four different S/N ratios: 15 dB, 10 dB, 5 dB, and 0 dB, at two presentation levels, 83 dB SPL (70 dB HL) and 53 dB SPL (40 dB HL), with 20 sentences in test level. Five key words were scored per sentence, for a total of 25 words per signal-to-noise ratio and 100 words per test level. The test manual recommends comparison of aided and unaided scores at the 50%-correct point to estimate aided benefit.
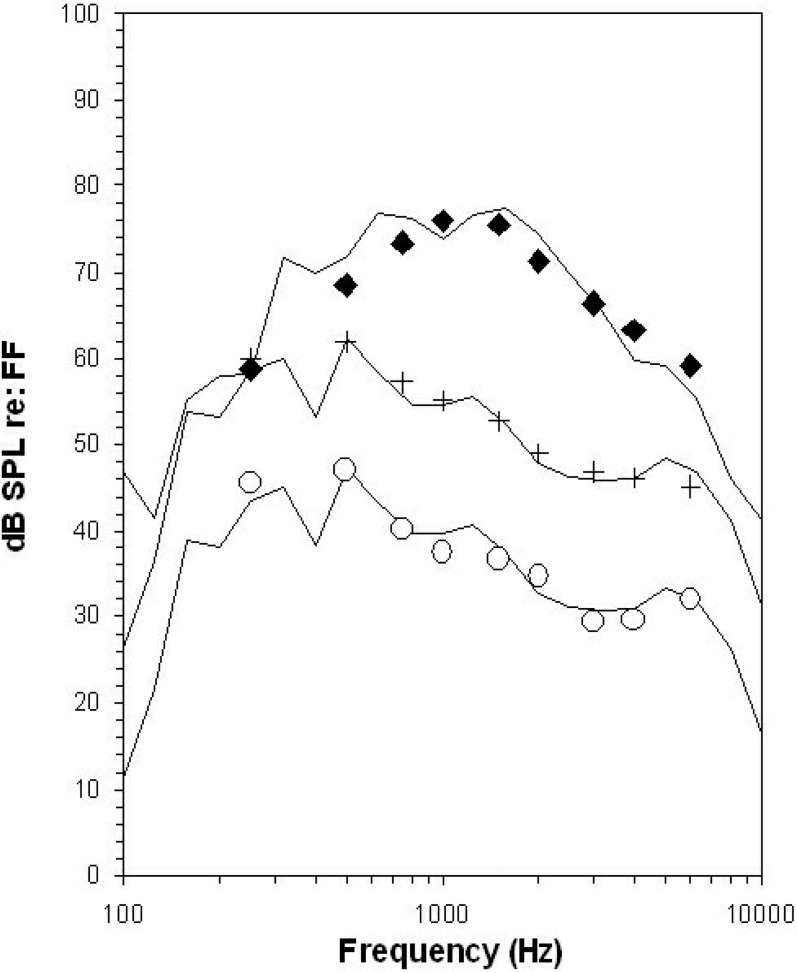
Aided loudness judgments were obtained using the Contour instructions and rating scale (Cox et al., 1997; Cox and Gray, 2001) administered in the sound field (see Table 1). The stimulus was the Rainbow passage (QMass CD) at 53, 70, and 83 dB SPL, presented at 1 meter, 0° azimuth. The three levels of speech were digitally filtered to approximate the presumed input levels and shapes for soft speech (53 dB SPL), average conversational speech (70 dB SPL), and loud speech (83 dB SPL). The measured spectra are shown against these calibration targets in Figure 1.
Self-reported hearing instrument benefit and satisfaction measures were obtained using the Client Oriented Scale of Improvement (Dillon et al., 1997). Evaluation was made for three to five listening situations nominated and ranked in importance by the client during the hearing instrument evaluation. After verification, clients rated the degree of change (e.g., “worse” to “much better”) and final performance ability (e.g., “hardly ever” to “almost always”) for each situation.
Table 1.
Rating Scale for the Contour Test of Loudness Perception
| Rating | Descriptor |
|---|---|
| 7 | Uncomfortably Loud |
| 6 | Loud, but okay |
| 5 | Comfortable, but slightly loud |
| 4 | Comfortable |
| 3 | Comfortable, but slightly soft |
| 2 | Soft |
| 1 | Very Soft |
Figure 1.
Stimulus levels used for loudness ratings of passages of speech. Calibration targets for three overall levels of speech are shown: soft speech (53 dB SPL, ∘), average speech (70 dB SPL, +), and loud speech (83 dB SPL, ♦), all referred to the free field (FF). The measured 1/3-octave band spectra at each overall level are shown by the solid lines.
Results of Verification Measures
Hearing instrument fittings were verified using an Audioscan RM500 probe microphone system. Responses for both speech-level measures and maximum output were evaluated to determine (1) the bandwidth over which the DSL target was met for speech-weighted inputs with an overall level of 70 dB (quantified using either the Swept signal and/or the Dynamic signal), and (2) the difference between the peak of the maximum power output response and the predicted or measured loudness discomfort levels for that ear.
At the final fitting, 85% of measured maximum power output responses had peaks that were no higher than +3 dB above the loudness discomfort level at the nearest frequency, indicating that the maximum output of the hearing instruments had been set to target in most of the fittings. The remaining 15% of the fittings exceeded the +3 dB limit, typically only at the peak of the maximum power output response. In all of these cases, the fitting had used predicted loudness discomfort levels. No fittings exceeded measured loudness discomfort levels, which were typically higher than the predicted values.
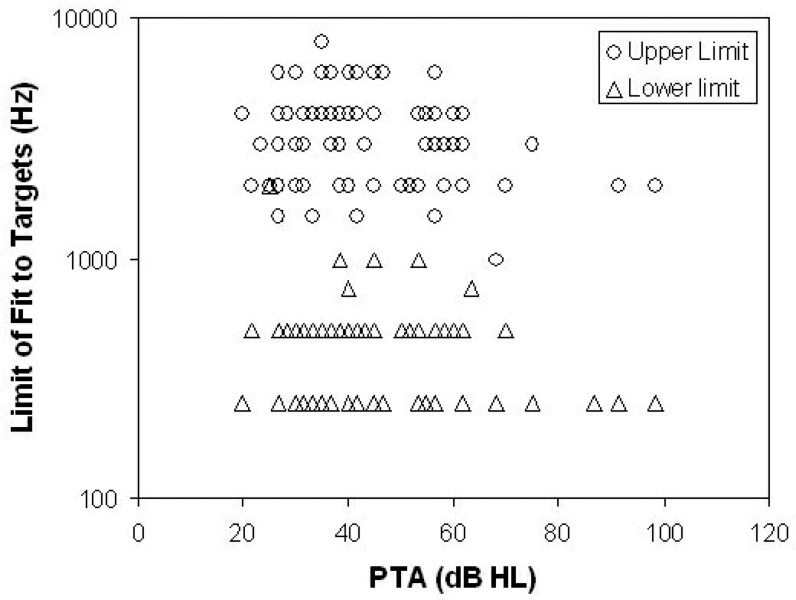
Speech-level measures of frequency response were evaluated to determine the bandwidth over which the DSL targets were met to within ±5 dB. The fit to within the ±5 dB range was visually assessed from printed verification records generated by the Audioscan RM500, and coded to the nearest audiometric frequency.2 The observed limits of fit to targets are displayed by the pure-tone average hearing level of the fitted ear in Figure 2. The lower limit of the fit to targets was 250 to 500 Hz in 93% of fittings. The upper limit of fit to targets was at or above 3000 Hz in 63% of fittings. Excluding ears with severe-to-profound losses (pure-tone average exceeding 71 dB HL) and sloping (exceeding 35 dB between 3000 and 500 Hz) or reverse sloping losses (5 dB or less, same range), 75% of the remaining 36 ears had upper bandwidth limits at or above 3000 Hz. The remaining fittings had been adjusted away from target because of (1) user preference (4 ears), (2) feedback (3 ears), (3) occlusion effect (1 ear), or (4) gain limitations in the fitted devices (5 ears). In these cases, the gain was generally reduced either in restricted frequency regions (for occlusion or feedback) or across frequencies (for user preference). Reductions were on the order of 10 dB.
Figure 2.
Observed limits of fit to targets for 89 ears in a clinical study using DSL with adult hearing instrument users. The highest and lowest audiometric frequencies that were within 5 dB of target are shown against the average hearing level of the fitted ear. Target reference was the DSL 4.1 target for speech-level inputs at 70 dB SPL. PTA = pure-tone average.
These findings suggest that many adult users with lesser degrees of hearing loss were fitted with hearing instruments that closely approximated the DSL target. More severe and more sloping losses were more difficult to fit, however, and other users were underfitted according to user preference. Furthermore, fittings above the DSL target were not observed, and informal visual inspection of the verification data suggested that many fittings within the ±5 dB fitting range were in fact slightly under target in most cases. These findings may suggest that the clinicians in this study used the DSL v4.1 target as a maximum fitting level rather than fitting both above and below the target levels.
Aided Loudness Measures Results
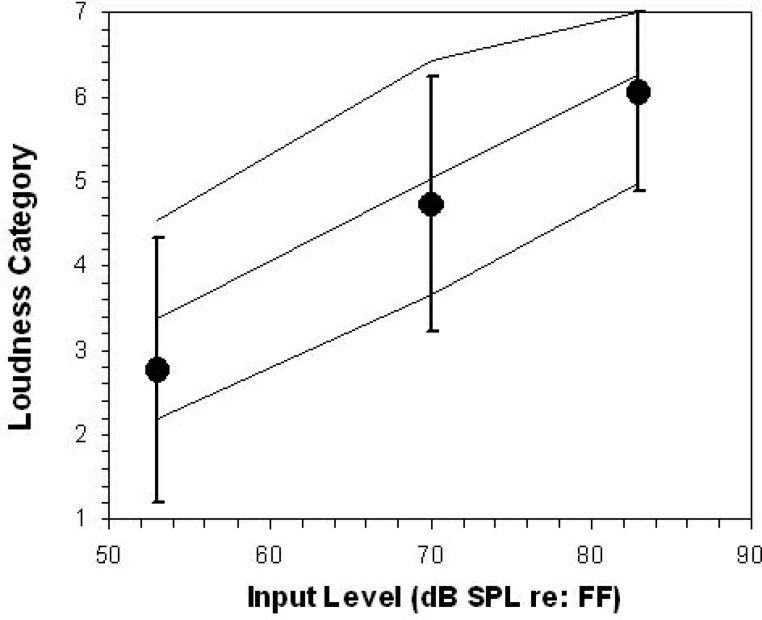
Aided loudness ratings for normally hearing listeners and the hearing instrument users in this study are shown in Figure 3. The mean and 95% confidence interval (CI) for the normally hearing listeners are plotted as a solid line. The mean aided loudness ratings from the hearing instrument users are shown by the circles, with the 95% CI shown by the vertical bars. Most of the hearing instrument users had aided loudness ratings that were within the normal range. On average, the aided loudness ratings for the hearing instrument wearers were slightly below the average normal loudness ratings. The differential effects of linear versus compression processing could not be evaluated in this sample because most of the hearing instrument users wore hearing instruments with compression processing.
Figure 3.
Aided loudness ratings for both normally hearing listeners and hearing instrument users. The mean and the ± 2 standard deviation range for the normally hearing listeners are plotted as solid lines. The mean aided loudness ratings (•) from the hearing instrument users are shown, along with the ± 2 standard deviation range (vertical bars). Most hearing instrument users had aided loudness ratings that were within the normal range. See Table 1 for category descriptors. FF = free field.
Regardless of circuit type, 88% of the listeners rated the 70 dB SPL speech signal in the comfortable range (i.e., somewhere between comfortable but slightly soft, and comfortable but slightly loud). Of the remaining listeners, one rated it as “soft” and four as “loud but OK.” The “loud but OK” rating for 70 dB SPL speech was also observed in five of the normally hearing listeners, so it is difficult to determine whether such a rating should be deemed acceptable or unacceptable on an individual basis. Overall, most of the hearing instrument users rated the 70 dB SPL speech within the comfortable range.
Speech Recognition Measures Results
The results obtained from the speech-in-noise test of hearing impaired listeners are shown in Figure 4 vs the performance obtained from normally hearing listeners. The average aided and unaided speech recognition performance is poorer than was observed in normally hearing listeners for both low-level and high-level speech and for both aided and unaided listening. Some high-performing participants were able to achieve normal or near-normal performance levels, and scores are generally higher in the aided condition.
Figure 4.
Unaided (Panel A) vs Aided (Panel B) results obtained from the speech-in-noise (SIN) test of hearing impaired listeners. Mean performance is shown (▪) along with the 95% confidence interval (vertical bars). The performance of a sample of normally hearing listeners is also shown (95% confidence interval, solid lines).
The raw scores for each listener were used to determine the 50%-correct point, in dB signal-to-noise-ratio (SNR), for each listener. This point is considered the speech reception threshold for sentences (Nilsson et al., 1994). In some cases, the test range of the speech-in-noise material did not encompass the listener's the speech reception threshold for sentences and a linear extrapolation was used to determine the SNR at which they may have scored 50% correct. The differences between the unaided and aided the speech reception threshold for sentences for each listener were derived to estimate aided benefit. Results revealed average benefit of 1.9 dB SNR (standard deviation, 8 dB) in the loud condition and 15.4 dB SNR in the soft condition (standard deviation, 11 dB). The extrapolation may have overestimated true benefit in some cases. However, a benefit of approximately 10 dB SNR occurred at the 25% performance point for the low-level condition, without extrapolation. Regardless of the exact degree of benefit, these results generally agree with the expected profile of benefit for hearing instrument fittings for this test, in that scores for the loud speech condition should not be made worse, whereas scores for the soft speech condition should improve significantly (Killion, 1997).
Self-Reported Benefit and Performance Results
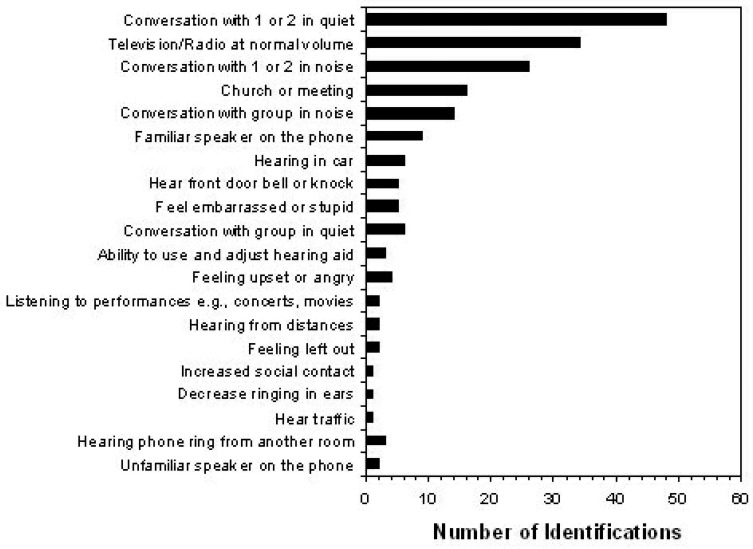
The listening or communication situations nominated by the patients in this study are shown in Figure 5, sorted by the number of patients who nominated each as being targeted for improvement with hearing instrument fitting. The three most commonly identified situations were conversation with a small number of people (in quiet and in noise) and being able to hear the television or radio at a normal volume. The improvement scores obtained from this sample of hearing instrument users are shown in Figure 6. Results are shown for the self-nominated communication situations, in order of situation priority as well as the average rating across situations for each listener. Two score types are shown: (1) degree of change, which estimates hearing instrument benefit; and (2) final ability, which estimates hearing instrument performance. In both measures, a higher number indicates a more successful outcome. The average degree of change was 4.1, corresponding to a rating of “better.” Similarly, the mean final listening ability was 4.2, which falls between ratings of “most of the time” and “almost always.” The 95% CI around the final ability scores ranged from 3.1 to 5, indicating that most of the hearing instrument users in this sample were able to function in high-priority listening situations at least half of the time. Furthermore, results indicate that the largest mean Client Oriented Scale of Improvement scores were in situations of listening in quiet, listening to the television or radio, and in conversation in a group with noise in the background.
Figure 5.
Listening and communication situations nominated by adult hearing instrument users as priorities for hearing instrument fitting on the Client Oriented Scale of Improvement.
Summary and Implications
The results of this study indicate that the DSL[i/o] prescription and associated clinical procedures provided good functional hearing outcomes for this group of patients. However, some patients did require gain reductions to achieve a comfortable and preferred listening level from their hearing instruments. Most fittings were between 5 dB under target and the target itself. No fittings reported an increase in gain over the DSL-prescribed level. Most patients in this study had normalized loudness ratings, but a small number had excessive loudness for high-level inputs. Speech recognition scores and subjective ratings of benefit and performance tended to be high and in accordance with expectations for hearing instrument outcome. This is generally in agreement with the literature on the application of the DSL Method with the adult population. The pattern of gain adjustment, however, may indicate that a modification to the DSL Method is required if it is to be applied to adults with acquired hearing loss without routine gain reduction by the clinician.
Do Adults and Children Have Different Listening Requirements?
The two previous sections describe research that may seem to be in conflict. Studies of children indicate that the amplification levels prescribed by DSL may be appropriate or acceptable, but studies with adults indicate that the DSL 4.1 levels may exceed required or preferred levels, or both. This raises an obvious question: do children and adults have different listening requirements and preferences?
Studies of infant speech discrimination have shown that normally hearing infants aged 7 to 10 months old require greater stimulus levels than are required by adults to discriminate between speech sounds in quiet and in noise (Nozza, 1987; Nozza et al., 1990; Nozza, Miller et al., 1991; Nozza, Rossman, and Bond, 1991). Similarly, children with normal hearing require a greater signal intensity than adults to reach maximal speech recognition performance (Elliott et al., 1979; Elliot and Katz, 1980; Neuman and Hochberg, 1982; Nabelek and Robinson, 1982; Nittrouer and Boothroyd, 1990). Normally hearing children also require higher signal-to-noise ratios to reach maximal performance scores when identifying sentences or consonants in noise (Elliot et al., 1979; Fallon et al., 2002; Scollie, in review) or a broader bandwidth when identifying high-frequency fricatives (Kortekaas and Stelmachowicz, 2000). Loudness growth comparisons between normally hearing children and adults indicate that children require a 7-dB higher input to reach the same loudness level (Serpanos and Gravel, 2000).
Children with hearing impairment have also been studied to determine the role of age-related performance. Gravel et al. (1999) evaluated aided sentence discrimination in noise with a group of children with hearing losses. Children with lower language scores needed higher signal-to-noise ratios to correctly repeat sentences in noise than did children with higher (more mature) language-age scores.
Children with hearing losses have different speech signal requirements than their age-matched peers with normal hearing, even when listening to amplified signals. Studies comparing children with normal and impaired hearing have shown age-related interactions with level, bandwidth, and sensation level in the perception of fricatives or the use of semantic context in recognizing words (Pittman and Stelmachowicz, 2000; Stelmachowicz et al., 2000; Stelmachowicz et al., 2001). One recent study demonstrated that children with normal hearing or children with hearing impairment require a higher Speech Intelligibility Index (American National Standards Institute, 1997) to achieve adult-like performance levels (Scollie, in review). In clinical practice, children's needs may lead experienced clinicians to adjust children's hearing instruments to provide more gain than what would be used by adults. Snik and Hombergen (1993) compared the use gains from a sample of 95 children (2 to 12 years) and 40 adults (18 to 77 years). Linear regression analysis indicated that the children used 5 to 7 dB more gain than was used by the adults.
If we can accept that children require a greater acoustic signal level than is required by adults, we may reasonably ask why this is. Some investigations indicate that children's phonemic development and other aspects of auditory processing continue to mature throughout the early school years. For example, Hnath-Chisholm et al. (1998) tested normally hearing children's perception of phonologic contrasts using a three-interval forced choice procedure. They found a strong age-related effect, with rapid improvement between ages 5 and 7 years, that plateaued by age 12. Blamey et al. (2001) studied a large cohort of children with congenital sensorineural hearing loss. Their results indicate that audio-visual sentence recognition skills mature rapidly to a language age of 7 years, after which a gradual plateau occurs.
Comparisons of the Hnath-Chisholm et al. (1998) data with those reported by Nittrouer and Boothroyd (1990) indicate that although different speech tasks may have differently sloped age-related increase in performance, the specific ages at which changes occur seem relatively constant across studies (Boothroyd, 1997). Moreover, the changes do not seem attributable simply to poor task performance, as error patterns vary with specific distinctive features by age, rather than the more random pattern that would be expected of attentional causes of the age-related trends. This suggests a fundamental immaturity of the auditory or phonologic system, or both, that does not mature until approximately age 12 years, a pattern that is generally consistent with that reported in the developmental psychoacoustics literature for nonspeech auditory perception (Wightman and Allen, 1992; Allen and Wightman, 1994; Allen and Bond, 1997; Allen et al., 1998).
This theory finds support in developmental studies of speech perception and production. For example, although children perform more poorly in noise, they make effective use of contextual cues to aid their understanding of speech in noisy environments. In a recent study, normally hearing 5 year olds, 9 year olds, and adults were asked to repeat the last word of a sentence in a background of noise that was adjusted to allow for similar performance across the age groups (Fallon et al., 2002). All age groups demonstrated similar degrees of improvement when listening to context-rich vs low-context sentences. This indicates that children as young as 5 years of age make good use of semantic context when they are provided with audible speech at an age-appropriate signal-to-noise ratio. Similarly, the developmental weighting shift hypothesis proposes a specific developmental course, spanning ages 3.5 to 7.5 years, in which a normally hearing child refines his or her perception and production of phonemes (Nittrouer, 2002). In the early stages, the child attends to and produces speech patterns that correspond to large movements of the vocal tract. Further development involves the child integrating the use of multiple, subtle acoustic cues. This corresponds developmentally to improvements in the clarity of pronunciation between ages 3 and 8 years.
In summary, not only do children with hearing loss seem to require higher signal levels relative to adults, these trends seem to relate well to the general literature on speech and language development. However, most of the literature has been obtained using tests of speech recognition. It is less clear how these findings relate to the listening preferences of children vs adults. This may be important: if the listening levels required by children are not preferred, or if the preferences of children and adults are similar despite differing performance requirements, the application of the adult-child differences in hearing instrument prescription would be extremely unclear. The following section reports a comparative study of the preferred listening levels of children and two groups of adults (experienced vs inexperienced hearing instrument users).
The Laurnagaray and Seewald Study of Adult/Child Preferred Listening Levels
This study aimed to determine whether the preferred listening level (PLL) differs between adults and children who use hearing instruments and whether adult PLLs differ between new and experienced adult users. A second purpose was to compare measured PLLs to the DSL v4.1 recommended listening level (RLL). It was hypothesized that PLLs would be greater for children and for adults with hearing instrument experience, and that both of these groups would have PLLs closer to the DSL 4.1 RLL compared with the adult new user group.
Participants
All participants received a standard audiometric test battery including otoscopy, tympanometry, air and bone conduction audiometry, and case history. In addition, each subject's RECD was measured by using either a foam tip (for custom hearing instrument wearers) or personal earmold (for behind-the-ear wearers [BTE]). Audiometry was conducted by using the same coupling methods to facilitate conversion of HL thresholds into ear canal sound pressure levels.
Participants were evaluated during routine clinical appointments in which the preferred listening level was determined as a routine post-fitting outcome measure. Patients were included in the study if they did not exhibit conductive hearing loss, as determined by air versus bone conduction audiometry and tympanometry and if they were able to independently manipulate the volume controls of their hearing instrument(s). The study cohort comprised 72 patients in three groups: (1) 24 children who were full-time hearing instrument users (14 boys, 10 girls; 8 to 18 years old; mean age, 12.5 years), (2) 24 experienced adult hearing instrument users (11 men, 13 women; 30 to 78 years old; mean age, 62 years); (3) 24 new adult hearing instrument users (12 men, 12 women; 35 to 79 years old; mean age, 61 years). The degree of hearing loss was moderate to severe, based on pure-tone averages. The average and range of hearing losses by frequency for each subject group are shown in Table 2.
Table 2.
Average, Maximum, and Minimum Hearing Threshold Levels by Frequency for Three Groups of Participants in a Study of Preferred Listening Levels of Hearing Instrument Users
| Frequency (Hz) | |||||||
|---|---|---|---|---|---|---|---|
| 250 | 500 | 1000 | 2000 | 4000 | 8000 | ||
| Children | Average | 50 | 54 | 59 | 62 | 65 | 64 |
| Minimum | 15 | 20 | 20 | 30 | 25 | 20 | |
| Maximum | 85 | 90 | 90 | 90 | 95 | 100 | |
| Experienced Adults | Average | 37 | 40 | 46 | 55 | 60 | 70 |
| Minimum | 20 | 20 | 20 | 40 | 45 | 45 | |
| Maximum | 70 | 65 | 65 | 70 | 70 | 100 | |
| New Adults | Average | 39 | 42 | 46 | 54 | 64 | 69 |
| Minimum | 10 | 15 | 25 | 35 | 35 | 35 | |
| Maximum | 70 | 70 | 70 | 70 | 80 | 95 | |
Prescription and Hearing Instrument Fitting
Prescriptive targets were calculated according to the DSL[i/o] algorithm (Cornelisse et al., 1995), as implemented in DSL 4.1 for Windows software (Seewald et al., 1997). Targets were generated for 2-cc coupler gain for a 60-dB speech-weighted signal, and 2-cc sound pressure level for a 90-dB pure-tone signal. Hearing instrument selection was done according to client need, financial resources, and/or currently used hearing instrument (e.g., previous hearing instrument users). Accordingly, the participants had a variety of linear and nonlinear devices in analog and digital formats. Most participants used BTE instruments (n = 53), and the rest used in-the-ear (ITE) (n = 9) or completely-in-the-canal (CIC) (n = 10) hearing instruments in the test ear.
Hearing instruments were adjusted to meet the prescribed frequency response and output-limiting characteristic as closely as possible, based on 2-cc measures of gain and OSPL-90. The volume control setting that most closely matched the targets was noted and provided to each participant and/or caregiver as a recommended use setting. Hearing instruments were adjusted to meet DSL targets for both new and previous hearing instrument users, for both adults and children. To facilitate the evaluation of the preferred listening level (and comparison to previous studies), the 2-cc gain level at 2000 Hz was measured using a Fonix FP-40 and was noted as a marker of the recommended listening level (RLL). New hearing instrument users were given a 15- to 20-day period of hearing instrument use before testing.
Preferred Listening Level: Procedure and Results
PLLs were measured in the better-hearing ear of each participant, as determined by the four-frequency pure-tone average (i.e., thresholds at 500, 1000, 2000, 4000 Hz). The contralateral ear was plugged by leaving its hearing instrument in place, but turned off. This monaural measurement of the PLL was chosen to facilitate comparison with previously published comparisons with prescriptive targets (Ching et al., 1997; Scollie et al., 2000). Because the DSL 4.1 targets do not employ a binaural correction, no adjustment to targets was made for binaural vs monaural fittings in this study.
A loudspeaker was located 1 meter away from the test subject at 0° azimuth. Phonetically balanced sentences (developed by J. M. Tato) were routed from a CD player through the audiometer to the loudspeaker at 60 dB(A). Stimulus levels were confirmed with a sound-level meter (Lutron SL 40001) before testing, using the “slow” setting.
The volume control on the hearing instrument was reduced to minimum and then each subject was asked to adjust the volume control until the talker sounded the best. Once the patient adjusted the volume control to the preferred level, the hearing instrument was removed, taking care not to disturb the volume control position, and the 2-cc coupler gain was measured and noted at 2000 Hz. Each participant completed this trial twice. The average test-retest difference was less than 1 dB for all three groups, and no individual participant varied by more than 6 dB. Experienced adults and children had test-retest differences of 4 dB or less. One-way analysis of variance (ANOVA) indicated no significant group effects for test-retest differences (F (2,69) = 1.065; p = 0.35).
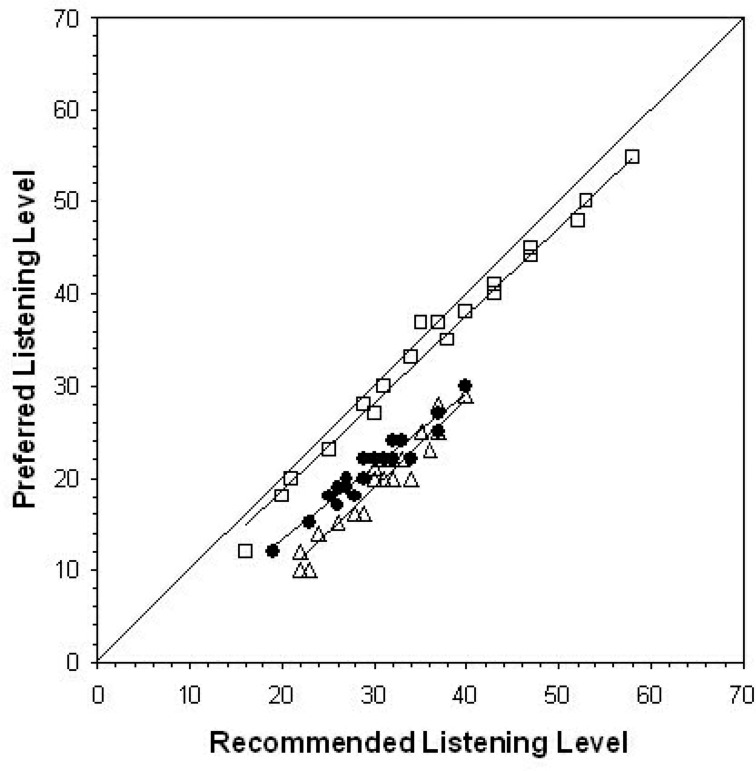
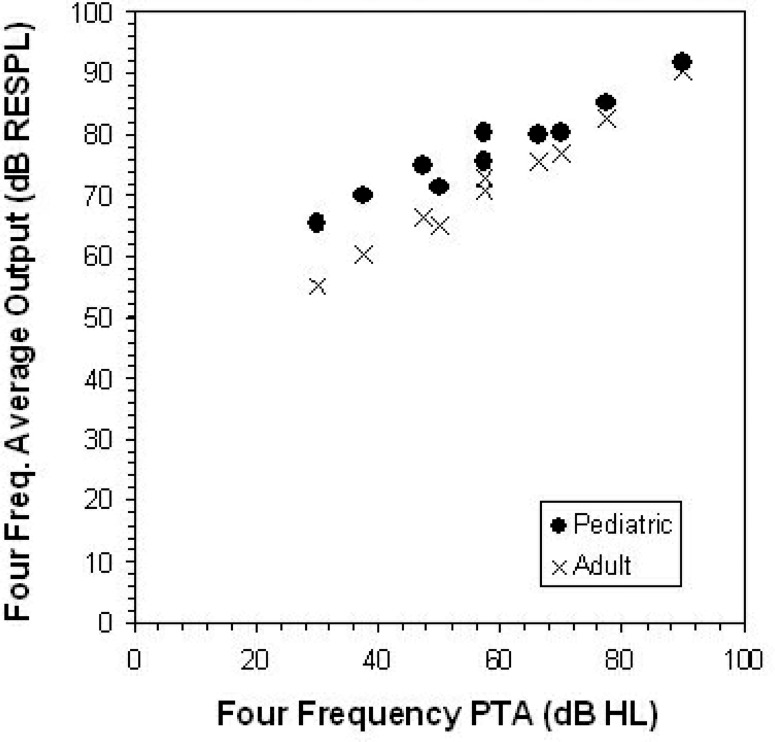
ANOVA on the differences between the PLL and RLL for each subject, by subject group, indicates significant differences between the three groups (F (2,69) = 258.2, p = 0.000). Tukey's honestly significant differences test indicated that the three groups differed from one another regarding their agreement between PLL and RLL. Children had PLLs that were closest to the target (or RLL) value with the mean PLL at 2 dB below the DSL v4.1 target. Experienced adults were the next closest, with a mean PLL 9 dB below target. New adult hearing instrument users had the lowest PLLs, which were 11 dB below target on average. In summary, roughly an 8-dB difference in PLL was observed between the adults and children, and PLLs in adults increase by a small but significant amount with hearing instrument use.
Individual PLLs are shown against prescribed gain levels in Figure 7. This figure allows examination of whether the PLL/RLL agreement has any relationship to hearing threshold levels, because higher target levels are due to higher threshold levels. Linear regressions were computed for each subject group to further examine whether deviation from target was best characterized as a simple offset (i.e., by the y-intercept being greater than zero) or an interaction with target level (i.e., by the slope being significantly different than unity). The resulting regression lines are also shown in Figure 7, with 95% CIs for each coefficient estimate shown in Table 3. Results indicate that the children's PLLs did not deviate significantly from the DSL target, as indicated by CIs for the regression coefficients surrounding zero (for the y-intercept) and unity (for the slope). Results for the experienced adults were somewhat different for the experienced adults, with a y-intercept CI spanning zero but a slope below unity. This finding is consistent with PLLs closer to DSL targets for milder losses. Results for the new adult users indicated a slope CI spanning unity, while the y-intercept was less than zero. This finding is consistent with adult new users requiring a fixed correction to the DSL 4.1 target to reach PLL, regardless of hearing threshold level.
Figure 7.
Recommended vs preferred listening levels (measured in 2-cc coupler gain at 2000 Hz) for three groups of subjects: children (□), new adult hearing instrument users (Δ), and experienced adult hearing instrument users (•). Regression lines (see text for details) are shown for each subject group, along with a diagonal line at target listening levels.
Table 3.
Confidence Intervals (95%) for Estimates of Regression Coefficients Derived by Comparing DSL Target Gain Levels With Preferred Gains of Three Patient Groups
| Children | New Adult Users | Experienced Adult Users | ||||
|---|---|---|---|---|---|---|
| Lower Bound | Upper Bound | Lower Bound | Upper Bound | Lower Bound | Upper Bound | |
| Y-intercept* | 2.47 | 1.65 | −13.7 | −6.87 | −5.36 | 0.27 |
| Slope | 0.9 | 1.01 | 0.86 | 1.09 | 0.7 | 0.88 |
The y-intercept unit is the difference between target and preferred levels.
Implications for Prescription
This study found significant differences between the new and experienced adult patients’ preferences. Some authors have suggested that acclimatization may play a role in determining whether the loudness associated with hearing instrument fitting is acceptable to an adult (Gatehouse, 1993; Turner et al., 1996; Munro and Lutman, 2003), but others argue that acclimatization does not play a role (Keidser and Grant, 2001). Proponents of the acclimatization view would speculate that a new hearing instrument user might prefer a lower listening level than would be attainable after an acclimatization period. The results of this study support this, although the magnitude of change in the PLL was small (2 dB on average).
The results of this study also indicate that recommended volume control settings from the DSL[i/o] Method closely approximate children's preferred listening levels for speech inputs of 60 dB A. This finding replicates the results reported by Scollie et al. (2000). In both this study and the Scollie et al. study, the children had worn hearing instruments that had been fitted according to the DSL target and therefore may have acclimatized to this listening level. In contrast, Ching et al. (1997) found that children who had worn the NAL-RP prescription had preferred listening levels that were closer to the NAL-RP recommended listening levels.
The contrast between these findings is difficult to interpret for two reasons. First, the studies used different levels of technology, different versions of fitting methods, and different ranges of hearing levels. Second, it is not clear from these findings whether children's preferences are more influenced by prior experience or by a developmental requirement for a higher listening level. The marked difference between the adult and child preferred listening levels in this study may indicate that inherent adult-child differences are an important factor to consider in electroacoustic prescription.
These results also indicate that the DSL[i/o] Method likely overestimates preferred listening levels for adult hearing instrument users, with the greatest overestimation observed for inexperienced adults. These findings may be specific to a 60-dB speech level and do not speak to the listening needs of adults with severe-to-profound hearing loss, as they were not tested in this study. Regardless, these results make clear the concept that adults and children with hearing loss have distinctly different preferences for listening level in addition to the different listening level requirements for speech recognition performance described above. This finding is perhaps consistent with the under-target trend for at least some adults in the study reported earlier in this chapter and possibly explains some differences between targets generated by more adult-focused prescriptive formulas (e.g., NAL-NL1, CAMFIT) and more pediatric-focused methods (e.g., DSL). A comprehensive prescriptive approach would need to consider that adults and children not only require, but also prefer different listening levels, perhaps by generating different prescriptions based on client age.
Description of the New Algorithm
Philosophy and Introduction to Version 5.0
The two principles underlying this revision of the DSL [i/o] algorithm are (1) to implement evidence-based revisions and/or additions to the approach described as the DSL [i/o] v 4.1 algorithm (Cornelisse et al., 1995; Seewald et al., 1997), and (2) to change the scope of computation in the algorithm to support specific hypothesis testing in pediatric hearing instrument research. Goals for DSL v5.0 include:
avoiding loudness discomfort during hearing instrument use,
recommending a hearing instrument frequency response that ensures audibility of important acoustic cues in a conversational speech signal as much as possible,
supporting hearing instrument fitting in early hearing detection and intervention programs,
recommending compression characteristics that are appropriate for the degree and configuration of the hearing loss, the technology to be fitted, and that attempt to make a wide range of speech inputs available to the listener,
accommodating the different hearing needs of listeners with congenital versus acquired hearing loss,
accommodating the different hearing requirements of quiet and noisy listening environments.
The motivation for the first principle is likely familiar to most readers, as it is the general approach—pose an algorithm, evaluate it, revise, and begin again—taken by most authors of prescriptive formulas. This cycle of development and revision has, to date, seen both the DSL and NAL families of prescriptive procedures move through approximately four major revisions along with a greater number of minor ones. In this chapter, we will describe a further collection of such evidence-based revisions in the areas of assessment data, transform data, target mapping, target modification, and targets for clinical verification of hearing instruments using either speech or non-speech test signals. This section of the chapter will focus primarily on target generation, summarizing the status of evidence that motivates each change. Where evidence is limited, we will describe the limitations and suggest directions for future evaluative research.
Assessment Data Revisions
As discussed by Bagatto et al. (2005), the DSL Method defines assessment data, such as audiometric thresholds, in real-ear sound pressure level so that age-related external ear canal acoustics are removed from the target generation process. Therefore, the main revisions in the area of assessment data were not conceptual in nature, but rather, involved the adoption of new normative data (described by Bagatto et al.) and calibration standards. Other changes have included the development of an interpolation routine to address the issue of partial audiometric data and the inclusion of specific corrections for electrophysiologic estimates of infant thresholds. These changes are summarized in the following sections.
New Calibration Standards
In DSL 4.1, the audiometric calibration values were compiled from a variety of sources. In DSL v5.0, audiometric calibration data are taken entirely from ANSI (American National Standards Institute, 1996), which is an ISO-harmonized standard. This should facilitate consistent agreement of the internal calculations used by DSL with those used by audiometers, probe microphone measures, and manufacturers’ software packages. Two specific decisions were made, given a choice of multiple values within the ANSI 1996 S3.6 standard. First, the standard contains more than one reference equivalent threshold sound pressure level (RETSPL) for TDH-series phones to include the 39, 49, and 50 forms of this transducer. The stored data for TDH phones in DSL v5.0 correspond to the TDH-50 values. The remaining TDH calibration options agree closely with these values.
Second, the RETSPL for insert phones is available for a variety of couplers: the HA1 coupler, the HA2 coupler, and an occluded ear simulator (OES; ANSI, 1996). Further, the HA2 coupler described for use in audiometric calibration has a shorter tubing length than is used for coupler measurement of BTE hearing instruments because it does not include the earmold simulator (ANSI, 1996). DSL must derive target values for BTE hearing instruments for infants and children, so this coupler definition difference had to be resolved. We have therefore taken the following steps:3
the insert phone RETSPL for the occluded ear simulator (OES) defines the normal hearing threshold used in the prescriptive algorithm,
the difference between the OES and the HA1 RETSPLs was calculated and used to define an average adult RECD,
this RECD is used within the HL-to-SPL transform for insert phones, whenever average adult data are used.
This solution has several advantages. First, it defines a minimum audible pressure curve that is in agreement with the calibration levels of a standardized audiometric transducer. Second, it allows the RETSPL and the RECD to be defined for the same coupler. Third, it ensures that ear canal threshold values will be in agreement across audiometers, regardless of the coupler type (i.e., HA1, HA2, OES) used during audiometric calibration. Overall, this avoids calculation errors that could arise from poorly considered definitions of couplers and normative RECD values.
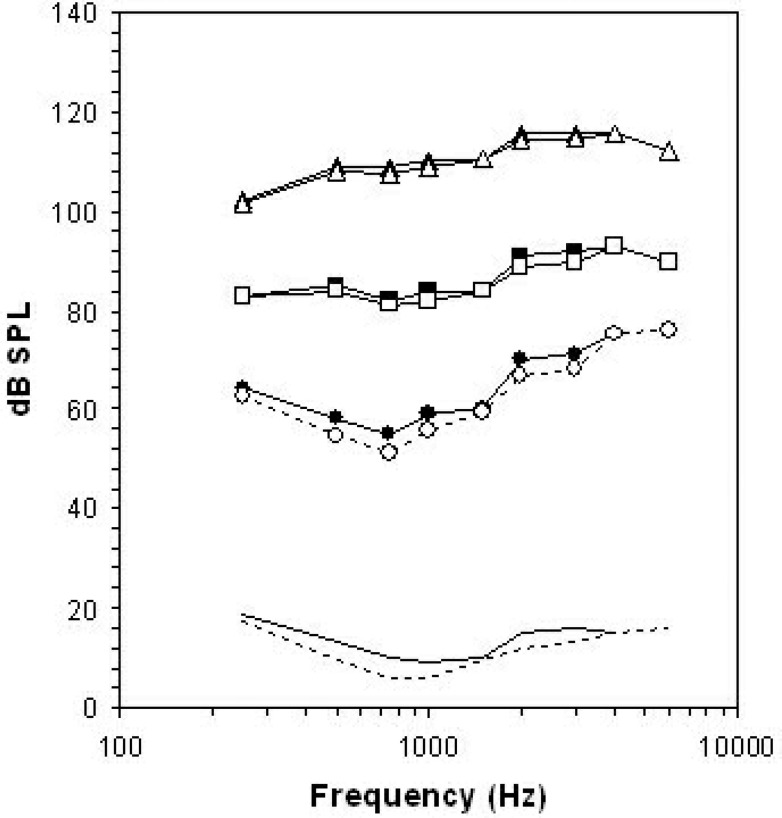
Clearly, these modifications will cause some change to the DSL targets independently of any revisions made to the prescription algorithm itself. The impact of these modifications was investigated by calculating hearing instrument prescriptions using the DSL 4.1 algorithm, using both the DSL 4.1 and ANSI (1996) calibration values. An audiogram of 0 dB HL was used to ensure that observed changes were due to adjustments in audiometric calibration standards rather than being reduced or altered by gain and/or compression. Across frequencies, the target-to-target differences are no greater than 1.5 dB at a given frequency for both speech-level targets and predicted upper limits of comfort (see Figure 8).
Figure 8.
Comparison of DSL v4.1 targets derived using ANSI 1989 and ANSI 1996 audiometric calibration standards. Filled symbols represent targets generated using ANSI 1989 values and open symbols show targets from ANSI 1996. The solid and dashed lines without symbols represent minimum audible pressure (MAP) values used in DSL v4.1 and ANSI 1996 occluded ear simulator (OES).
Electrophysiologic Estimates of Thresholds
If audiometric thresholds are obtained using electrophysiologic rather than behavioral measures, other corrections may be required. DSL v5.0 will support data entry from electrophysiologic measures of thresholds using the frequency-specific auditory brainstem response (ABR). Clinicians may enter data in the normalized HL (nHL) scale or in the estimated HL (eHL) scale (see Bagatto et al., 2005 for a discussion of these terms). If the nHL scale is used, stored DSL algorithm corrections can be used to convert nHL data to a dB eHL reference. Alternatively, clinicians can enter their own (custom) dB nHL-to-dB eHL correction values. The DSL 5.0 default nHL-to-eHL correction values were derived on a sample of children who were tested using linearly gated 2-1-2 cycle tone bursts, calibrated according to Stapells’ recommendations (Stapells et al., 1990; Stapells, 2000). A detailed description of this project is available in this issue (Bagatto et al.). Clinicians who test using ASSR procedures are advised to ensure that the ASSR system is applying an nHL-to-HL correction that is valid for use with infants who have hearing loss. If this is the case, data may be entered directly into DSL by using the eHL scale. No further correction will be applied when the eHL scale is used. The eHL designation is simply used to mark the thresholds as estimated rather than behaviorally measured.
The end result of assessment data handling is the transformation of clinician-entered thresholds in dB HL (and loudness discomfort levels, if available) to a reference in ear canal SPL. In pediatric audiology, it is common to have partial audiometric data, especially at the beginning of the audiologic confirmation process. Typically, clinical practice guidelines recommend obtaining at least two threshold data points before hearing instrument fitting (The Pediatric Working Group, 1996). This is supported by DSL v5.0 by computing targets based on as few as two thresholds, with interpolation to produce targets at the frequencies in between the assessed thresholds. This provides the clinician with a complete, or nearly complete, set of target criteria for the purpose of selecting initial hearing instruments. It should be noted, however, that interpolated threshold values are not reported by the software so that confusion does not arise about which thresholds have or have not been directly measured. The impact of this strategy is that partial audiometric data can be used to generate a complete spectrum of targets across frequencies.
Definition of Inputs
An important starting point for this revision was the definition of speech inputs for use in defining a functional range of speech in hearing instrument prescription. Several studies have examined changes in the overall level and spectral shape of speech as vocal effort level changes (Pearsons et al., 1977), taking into account the impacts of age (Cornelisse et al., 1991; Pittman and Stelmachowicz, 2003), gender (Cox and Moore, 1988), language (Byrne et al., 1994), and self-speech vs speech of others (Cornelisse et al., 1991; Pittman and Stelmachowicz, 2003). These reports provide important details to supplement our knowledge of the average level and shape for conversational speech at a distance of 1 meter (Cox and Moore, 1988).
Effects of Vocal Effort
As vocal effort level increases from “casual” to “shouted,” the overall level of speech increases from about 56 dB to 84 dB SPL re: free field, on average across men, women and children (Pearsons et al., 1977). The spectral shape of the speech also changes from a low-frequency emphasis to a mid-frequency emphasis—shouted speech peaks in the range of 1250 to 1600 Hz rather than the 500-Hz peak characteristic of normal vocal efforts. Conversational-level speech, or speech with a normal vocal effort, is most often measured from a distance of 1 meter. This type of speech has been reported as having an overall level of nearly 60 dB SPL in studies reported on the topic (Pearsons et al., 1977; Cox and Moore, 1988). Other levels are more typically used in hearing instrument prescriptions and/or fitting equipment, however. An overall level of 70 dB SPL is common, even though it is an estimate of a vocal effort level somewhat between “raised” and “loud” rather than “conversational.” This is likely due to historical reasons. The 70-dB estimate was conceived when linear gain hearing instruments were popular, and it was generally accepted that people tended to raise their voices when speaking to someone wearing a highly visible hearing instrument. The convention of using 70 dB SPL to define average speech inputs has led several authors to report a version of their measured spectrum that has been adjusted to an overall level of 70 dB SPL (Cox and Moore, 1988; Cornelisse et al., 1991; Byrne et al., 1994). As well, most commonly used generic prescriptive formulas use an overall level of 70 dB SPL to define conversation-level speech inputs for WDRC targets as well as the input level in target gain calculations for use with linear hearing instruments (Seewald et al., 1993; Ching et al., 1997; Seewald et al., 1997; Dillon, 1999). For linear fittings, use of a somewhat higher level may be warranted to prevent hearing instrument rejection because of loudness discomfort during raised vocal efforts of conversational partners.
In the current era of hearing instrument prescription, however, we may wish to acknowledge a few major changes. First, hearing instruments now offer some degree of level-dependent processing for most degrees of hearing loss, allowing the hearing instrument to adjust itself for a range of speech input levels. Second, hearing instruments are now smaller and less visible than in previous years, even in the BTE category, for most levels of hearing loss. Together, these two developments may adjust our priority away from the traditional 70 dB SPL estimate of conversational level speech and toward attempting to provide support for communication with a conversational partner who is using a normal vocal effort. This change would be in better agreement with the test levels used by the Speech Intelligibility Index (ANSI, 1997).
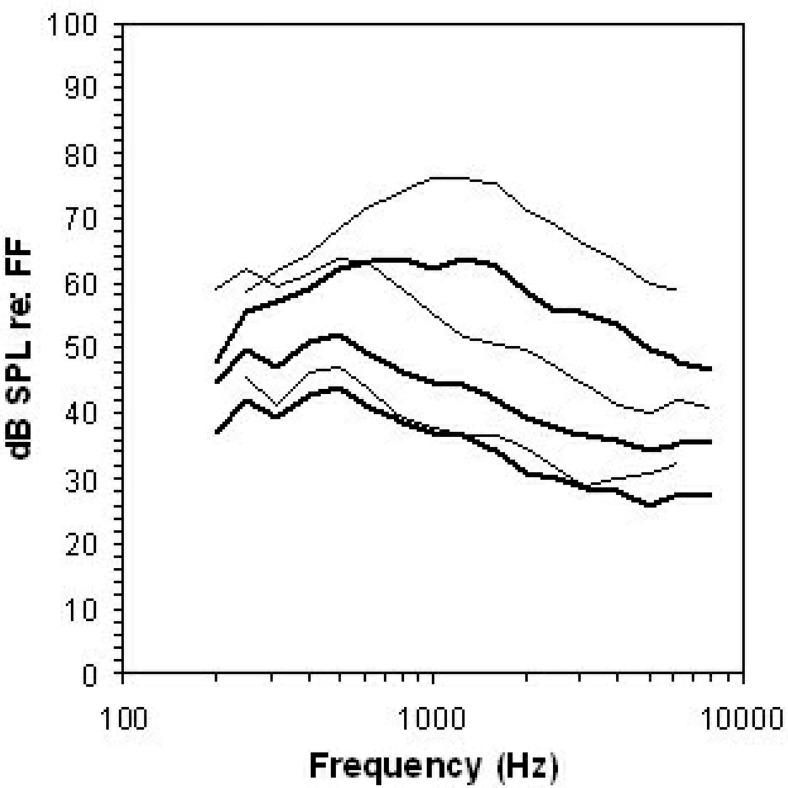
These considerations motivate several changes in the definition of “speech” in the DSL Method. Figure 9 illustrates some of the speech spectra assumed by DSL v4.1 compared with corresponding spectra assumed by version 5.0. Version 4.1 had the goal of fitting the widest possible range of inputs into the residual auditory area of the listener (Cornelisse et al., 1995). Accordingly, the widest possible range of speech spectra was selected to illustrate the widest possible effect of WDRC technology. The “loud” estimate was selected from the “shout” vocal effort data averaged across men, women, and children, reported by Pearsons et al. (1977).4 The “soft” estimate is similar to the “casual” vocal effort data from the same data set. The “average” speech spectrum was, for pediatric hearing instrument fittings, an arithmetic average of two speech spectra reported by Cornelisse et al. (1991). The first spectrum was the speech of men, women, and children measured from 1 meter, with an average vocal effort adjusted to match an overall level of 70 dB SPL. The second spectrum was the levels of children's speech (72 dB SPL) measured at the location of a BTE hearing instrument microphone placed on the talker (i.e., an estimate of self-speech, see below for more information). These two spectra were arithmetically averaged5 to select a speech spectrum that was midway between the two per 1/3-octave band. This compromise was termed the “UWO Child” speech spectrum and is used to reflect the notion that children spend some of the time listening to the speech of others and some of the time listening to their own speech. The UWO Child spectrum was also adjusted to have an overall level of 70 dB SPL.
Figure 9.
Unaided long term average speech spectra assumed by the DSL Method in versions 4.1 (thin lines) and 5.0 (thick lines) when representing low-, moderate-, and high-level speech. See text for specific details regarding sources and overall levels.
Several of these decisions have been revised in developing DSL v5.0 (Figure 9). The soft spectrum has an overall level of 52 dB SPL, selected from the overall level of casual speech produced by women (Pearsons et al., 1977). However, the Pearsons et al. spectra for casual vocal effort levels show likely noise floor contamination above 3150 Hz, as indicated by a steadily rising spectrum that is not consistent with the typical spectral shape of speech signals. Therefore, we chose the spectral shape associated with normal vocal effort and attenuated it to have an overall level of 52 dB. The “conversation” spectrum is the average spectrum reported by Cox and Moore (1988) at an overall level of 60 dB SPL. The “loud” spectrum is derived from loud speech of men, women, and children and has an overall level of 74 dB SPL (Pearsons et al., 1977).
The change to the loud spectrum was made for several reasons. First, the descriptor loud is more accurate if the corresponding vocal effort level is used. Second, we felt that loud speech is more frequently encountered in real communication situations than is shouted speech. Finally, we wanted to provide a set of targets that could be used within probe-microphone verification and/or loudness rating protocols that would allow clinicians to detect and troubleshoot loudness problems. Shouted speech does not allow this, because even normally hearing listeners are apt to rate it as uncomfortably loud (see also Figure 2). In contrast, normally hearing listeners would likely rate 74 dB speech as either “loud but OK” or “comfortable but slightly loud.” Therefore, clinicians who wish to assess loudness normalization and acceptability will be better able to detect problematic loudness if a 74 dB SPL rather than an 82 dB SPL speech signal is used. Similarly, use of a 60 dB SPL level to represent conversational speech may be more likely to elicit a normal loudness rating of “comfortable,” allowing the clinician to assess loudness comfort more directly than if a 70-dB speech signal is used (see also Figure 2). Finally, it is likely that speech at other input levels may be of interest. Therefore, clinical applications of DSL v5.0 may support generation of targets for levels other than these three pre-defined spectra.
Speech of Other Talkers versus Own Speech
All of the spectra discussed above pertain to receiving speech from other talkers. For children, monitoring of their own speech is an important component of learning to produce spoken language. Acoustically, one's own speech reaches one's own ear, allowing a child to hear his or her own vocal productions, at least for children with normal hearing. For a child with hearing loss, the self-speech spectrum may not be high enough in level to allow self-monitoring, particularly at the high frequencies where speech levels are typically low and hearing thresholds are typically elevated.
Specific spectra for self-speech were originally described by Cornelisse et al. (1991). In DSL v5.0, the child self-speech spectrum from Cornelisse et al. is used for children aged 5 to 18 and is reduced by 3 dB for children younger than age 5 (Pittman and Stelmachowicz, 2003). For adults, self-speech is defined from the adult spectrum, also reported by Cornelisse et al. Unlike previous versions of DSL, in DSL 5.0 these self-speech spectra are not used to prescribe targets for frequency shaping but can be used to generate descriptions of the aided levels of self-speech. This is in part due to the prevalent use of multichannel compression. In DSL 3.1, linear gain hearing instruments were optimized to handle a spectrum midway between that of self-speech and speech from others by changing the frequency-gain function. Multichannel compression can be expected to better accommodate the rapid changes between receiving the two forms of speech than this older, linear gain strategy. Therefore, we have removed the self-speech input option from computations that drive frequency shaping. This change does not alter the high-frequency gain requirement for WDRC instruments.
Removing the self-speech spectrum from the frequency-gain calculations does not diminish the importance of optimizing auditory self-monitoring in pediatric hearing instrument fitting. Recent research indicates that high frequency audibility is an important factor in the speech and language development of children with hearing loss (Stelmachowicz et al., 2004). Rather, we wish to think differently about the technologies that may be applied to achieve good audibility of a child's own speech. To support this, we encourage the use of multichannel compression and provide target spectra that describe the audibility of self-speech, assuming that the hearing instrument is set to the DSL 5.0 targets for the speech of others. Such information can be important in troubleshooting developmental deficits in the production of specific speech sounds or for guiding the development of verification systems that simulate “own speech” as a test condition.
Summary and Implications
The two sections above have explained the detailed rationales for selecting certain speech spectra as points of reference within the DSL Method. More specifically, they have discussed several changes in philosophy that have been made from the 4.1 iteration of DSL to the current version 5.0. Two primary changes have been made. First, the range of input levels that receive primary prescriptive consideration now extends from 52 to 74 dB SPL rather than extending to shouted levels of speech at 82 dB SPL. Second, the conversational speech spectrum is now referenced to 60 dB SPL and is no longer shaped to reflect the spectrum of one's own speech. These reference speech targets will be applied in the next section in a revised nonlinear prescriptive algorithm.
Target Generation
As described by Seewald et al. (2005) in this issue, the DSL[i/o] algorithm is a generic prescriptive algorithm that computes targets for hearing instrument performance that are matched to the hearing threshold levels, age, and hearing instrument fitting characteristics of the individual hearing instrument user. Version 4.1 of DSL was designed with a WDRC stage at each frequency. That is, the algorithm was not originally developed to include a compression threshold, nor did it account for the effects of multichannel vs single-channel compression. Clinical application of DSL 4.1 used specific input levels for speech-weighted signals and did not employ a binaural correction, venting corrections, or adjustments for conductive losses. In the following sections, we will describe several modifications to the DSL[i/o] algorithm within DSL v5.0. The modifications described below use the DSL[i/o] algorithm as a starting point, with additional consideration given to the structure of the input/output plot to include multiple stages of processing as well as new definitions for output limiting, compression thresholds, and adjustments for the individual profiles of hearing instrument users who may have congenital or acquired hearing losses, monaural or binaural fittings, and who may use single or multiple channels of compression in either quiet or noisy environments.
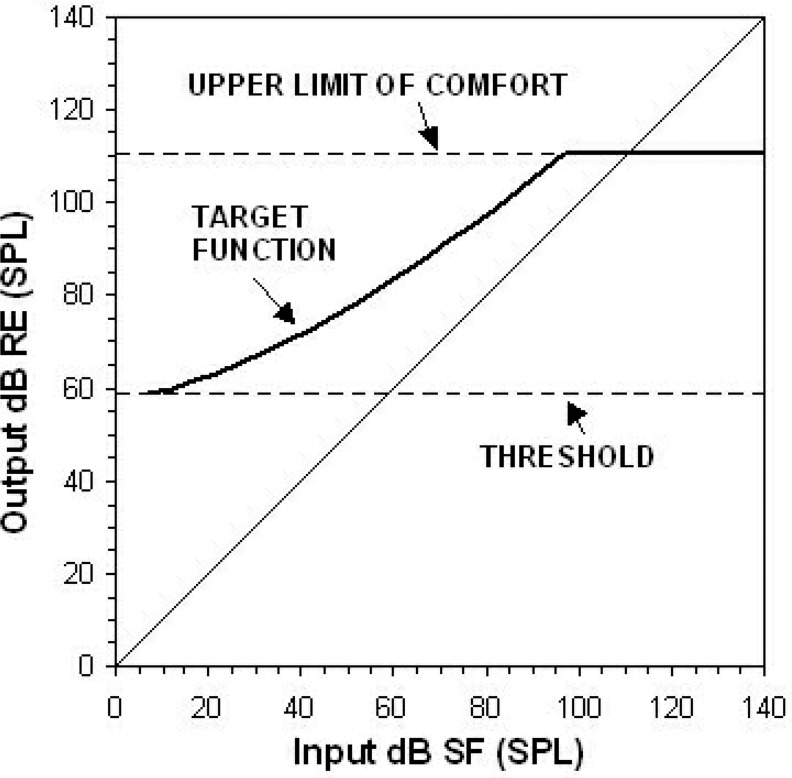
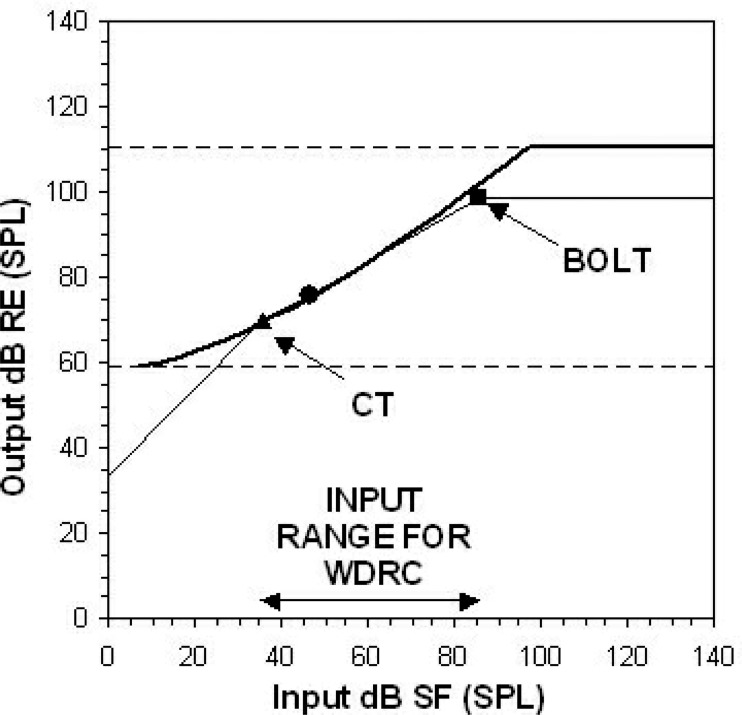
The DSL[i/o] algorithm comprises a very broad compression phase that begins at 0 dB HL, reflecting the goal of loudness normalization (Cornelisse et al., 1995). An illustration of this target approach is provided in Figure 10 for a hearing threshold level of 50 dB HL. In clinical applications of the DSL[i/o] algorithm, higher compression thresholds could be applied to reflect the actual compression characteristics of the fitted hearing instrument, but the [i/o] algorithm itself attempts to make audible a very broad range of inputs. In DSL v5.0, we use the DSL[i/o] algorithm as a starting point but modify it to apply WDRC to a somewhat smaller input range. These inputs are specifically selected to be those that are most important for functional communication.
Figure 10.
The DSL[i/o] target input/output function (thick line) for a 50 dB HL threshold at 1000 Hz, computed using a loudness normalization strategy. The input levels are plotted in dB SPL in the sound field (SF). The output levels are plotted in dB SPL in the real ear (RE). The dashed lines represent the limits of the auditory area at this frequency. The diagonal line represents unaided signals (unity gain). Detection thresholds have been converted to dB RE SPL and used to predict upper limits of comfort (both shown by dashed lines).
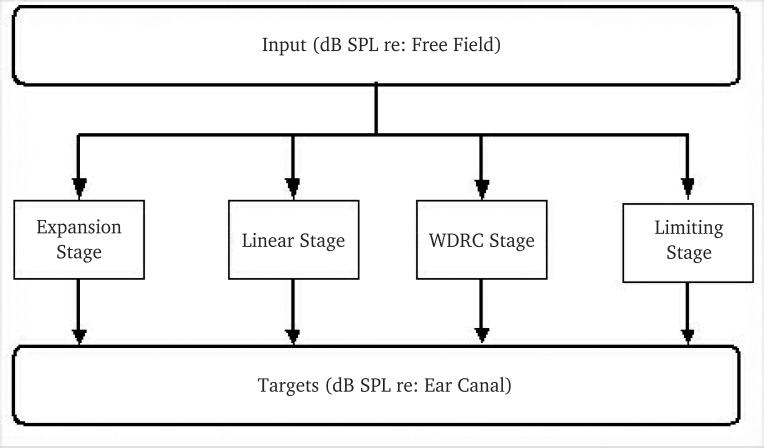
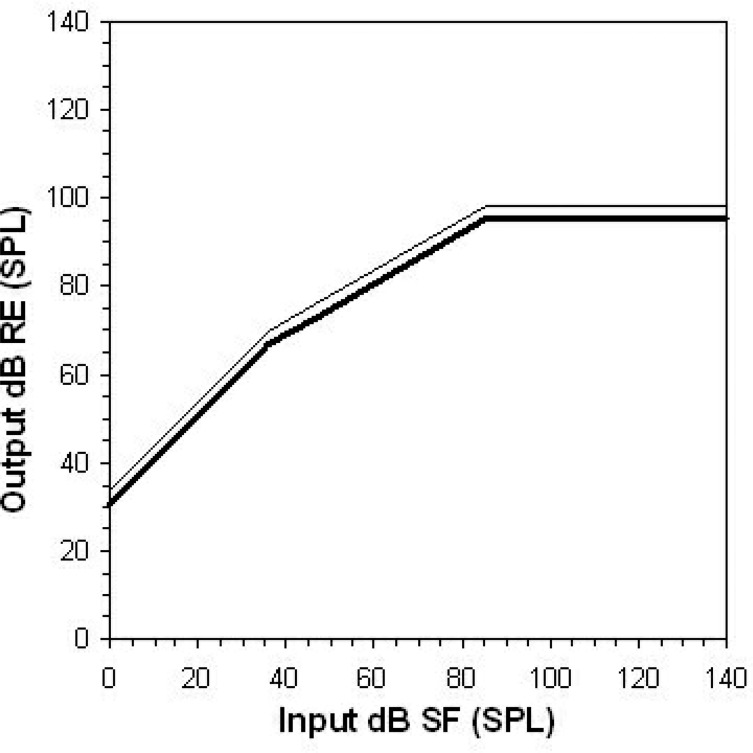
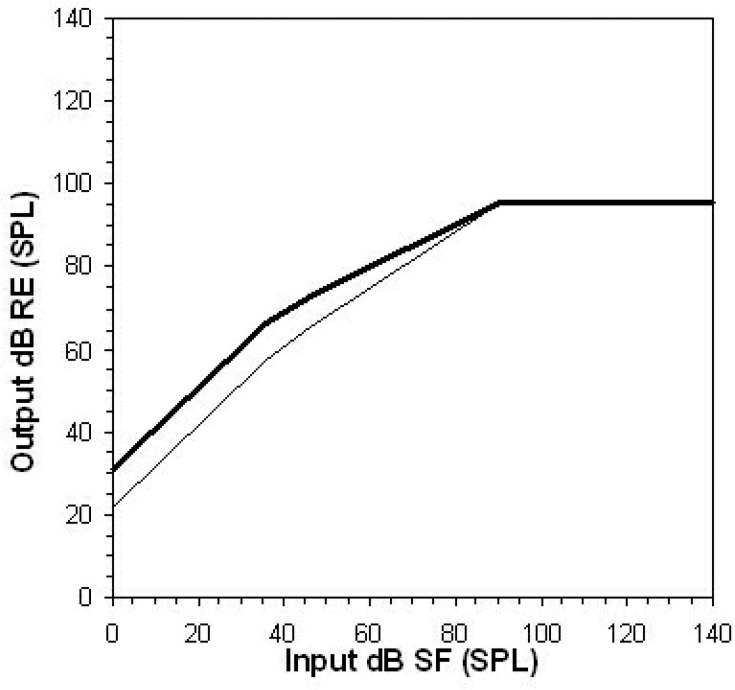
To achieve this, we have developed a multistage input/output (m[i/o]) algorithm that includes four stages of processing: (1) expansion, (2) linear gain, (3) compression, and (4) output limiting (Figure 11). These m[i/o] stages reflect conventional digital signal processing for amplitude control in many modern digital hearing instruments. The multistage algorithm uses predefined input ranges to delineate the four processing stages. For example, the compression stage is intended to include some or all of the conversational speech range, with fewer of the softer inputs of the speech range included in the compression stage as hearing levels increase. The input stages are then grouped across frequencies according to the channel structure of the hearing instrument. The final result of these computations is a series of target input/output functions that define how a multichannel, multistage device should respond to speech inputs across vocal effort levels. The following sections will describe how each stage is computed, how the general strategy is modified to take into account how older and younger hearing instrument users’ needs differ, and how quiet and noisy environments are handled by hearing instrument signal processing.
Figure 11.
Conceptual illustration of the computational stages included in the DSLm[i/o] algorithm. WDRC = wide-dynamic-range compression.
Output Limiting
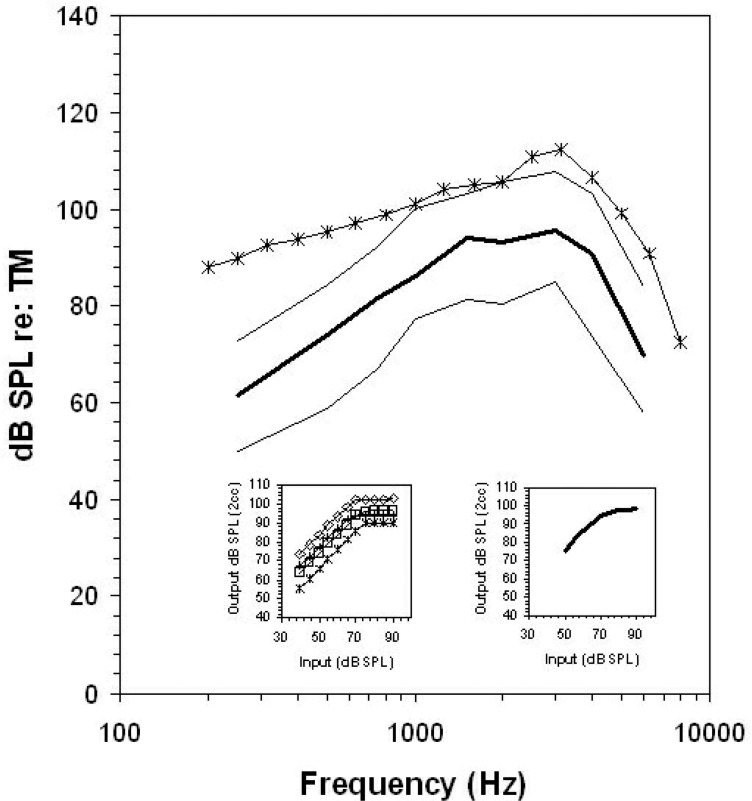
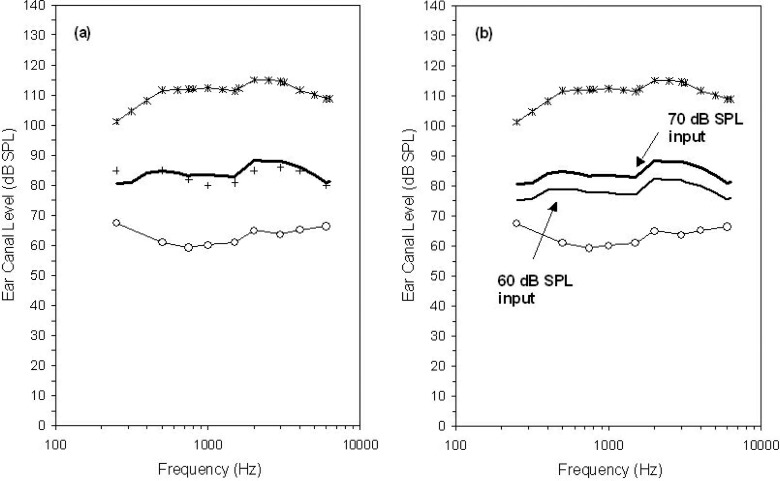
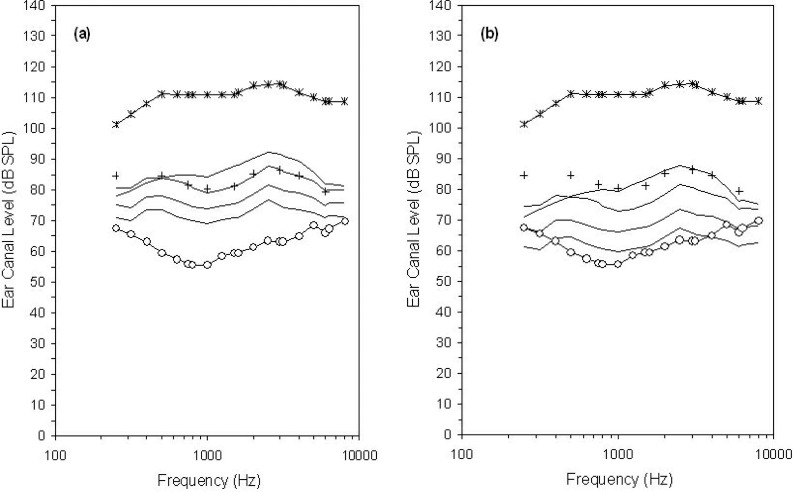
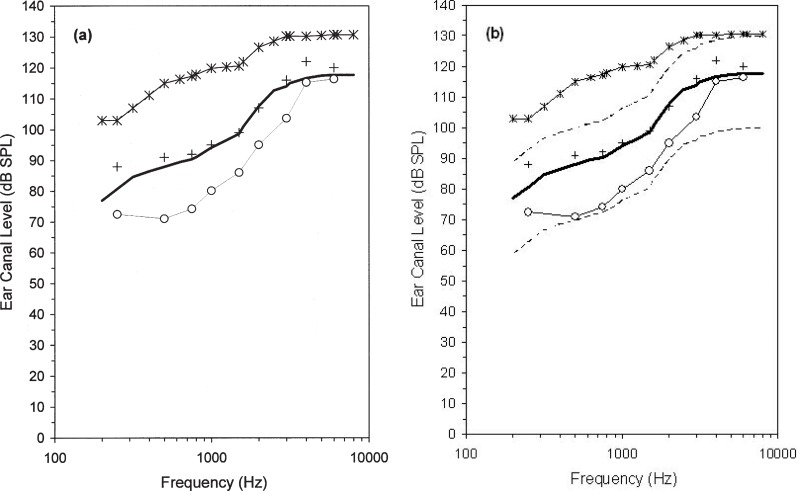
Generic hearing instrument prescriptions must define generic output limiting targets, despite the large differences between methods, for the clinical verification of output limiting vs manufacturers’ internal definition of output limiting and hearing instrument signal processing for high-level real-world signals. Clinically, hearing instrument output limiting is typically measured with a high-level (i.e., 90 dB SPL or greater) narrowband test signal input. In contrast, hearing instrument manufacturers create software parameters that control the output levels of the device itself, often according to the internal definition of output used by the signal processor. This is defined per channel and may be specific to peak levels, RMS levels, or both peak and RMS levels, which can be expected to differ by 5 to 10 dB, depending upon the channel structure of the hearing instrument (Dillon, 2001). Mismatches between a generic target and the programmed and/or verified maximum output of the hearing instrument may therefore result if two different definitions of maximum output are compared. An illustration of this is shown in Figure 12. A single-channel hearing instrument with output compression limiting and an adaptive release time was measured with both a pure-tone sweep at 90 dB SPL and with a 2-minute passage of speech6 at 83 dB SPL. Based on input/output functions, this hearing instrument was in saturation for the both the pure tone and the speech signal. Both measures may therefore be considered estimates of the maximum output of this hearing instrument.
Figure 12.
Electroacoustic evaluation of two high-level signals measured on the same hearing instrument. Displayed curves indicate the measured levels of an aided 90 dB SPL pure-tone sweep (*), the aided dynamic range (thin lines) and long-term average speech spectrum (thick line) of speech are presented at 82 dB SPL. Insets show input/output plots for the same aid, measured for speech-weighted noise (right) and pure tones (left) at 500 (*), 1000 (□), 2000 (⋄), and 4000 Hz (+).
The amplified speech signal was analyzed to derive the long-term average speech spectrum, measured in dB RMS per 1/3-octave band, and the peaks and valleys of speech, measured as the 99th and 30th percentiles in the amplitude distribution per 1/3-octave band, over the entire 2-minute sample, with an FFT time window of 125 msec. These speech analyses are generally considered standard measurement definitions for the electroacoustic analysis of the spectrum and dynamic range of speech. Equivalent methodology is used in describing the speech spectrum and dynamic range by the literature that is frequently used to define our knowledge of the speech input signal to hearing instruments (Cox, 1985; Cox et al., 1988; Cox and Moore, 1988; Byrne et al., 1994; Olsen, 1998). The 99th percentiles of the amplitude distribution are generally used to define the peaks of speech (Dunn and White, 1940), which may be an appropriate measurement of maximum output levels for a speech signal (Scollie and Seewald, 2002). The distance between the 99th percentile and the LTASS defines the crest factor of the speech signal.
Both RMS and percentile-based analysis of speech can be used in combination with pure tone or other narrowband measures to assess maximum output in several ways. First, note in Figure 12 that the aided pure-tone sweep produced the highest levels of all estimates of hearing instrument output. Second, note that the aided pure-tone sweep is a close estimate of the aided peaks of speech in those frequency regions that correspond to the peak gain and output area of this hearing instrument's frequency response (i.e., 1000 to 4000 Hz). Third, note that the aided LTASS measurement is approximately 10 to 15 dB below the aided peaks of speech and much further below the aided pure-tone measurement. Depending upon which estimate is used, the maximum output of this hearing instrument could be considered to be 112 dB SPL, 108 dB SPL, or 96 dB SPL. The first two values are narrowband, short-duration measures (or a close approximation to this), while the third, lowest value, is within a broadband long-term average spectrum. This speaks to the importance of a specific definition of measurement type when discussing maximum output, particularly with the advent of digital hearing instruments that use broadband and/or multichannel output limiting strategies.
Version 5.0 of DSL provides three variables that may be used in defining output limiting: (1) the user's narrowband upper limits of comfort (ULC), which should not be exceeded by any aided narrowband signal regardless of input level; (2) targets for narrowband inputs of exactly 90 dB SPL—these targets may be slightly below the upper limits of comfort if the hearing instrument is not fully saturated by a 90-dB input; and (3) a broadband output limiting threshold (BOLT). This BOLT value, although intended for use with broadband inputs, is also defined per 1/3-octave band so that it may be used as a frequency-specific limit within spectral analyses of speech. Each of these target types may be used for slightly different purposes, depending upon the test signals at hand, and/or the user's knowledge of the signal processing characteristics of the hearing instrument to be tested. Clinical applications of DSL v5.0 may offer one, some, or all of these options so that an appropriate target can be provided.
Narrowband Output Limiting Targets
Narrowband predictions of the listener's ULC are best compared to narrowband hearing instrument measurements. The goodness-of-fit to this type of target may be assessed by clinicians (i.e., using electroacoustic measurements) or by hearing instrument manufacturer's fitting modules (i.e., to set narrowband output limiting controls within the hearing instrument's signal processor). Test signals that are appropriate for electroacoustic measurements include pure tones, warbled pure tones, and measurements of short duration, high-level components of speech. The fit-to-targets goal is that the measured levels should not exceed the predicted ULC. This type of target has been used within the DSL Method for several versions (Seewald et al., 2005). The targets are generated by a quadratic equation that relates ear canal thresholds to the predicted ULC and limits the predicted values to a maximum of 140 dB SPL in the ear canal. These equations are available as predictions within DSL v5.0, or may be replaced with measured ULC values, if available.
Broadband Output Limiting Targets
The BOLT defines the frequency-specific saturation kneepoint for the 1/3-octave band RMS levels of speech signals. This variable is computed to allow the calculation of a frequency-specific saturation stage, while also acknowledging that the input signal is broadband. The BOLT is useful when prescribing hearing instruments that employ broadband output limiting or when making a 1/3-octave band analysis of aided high-level signals for comparison to target levels.
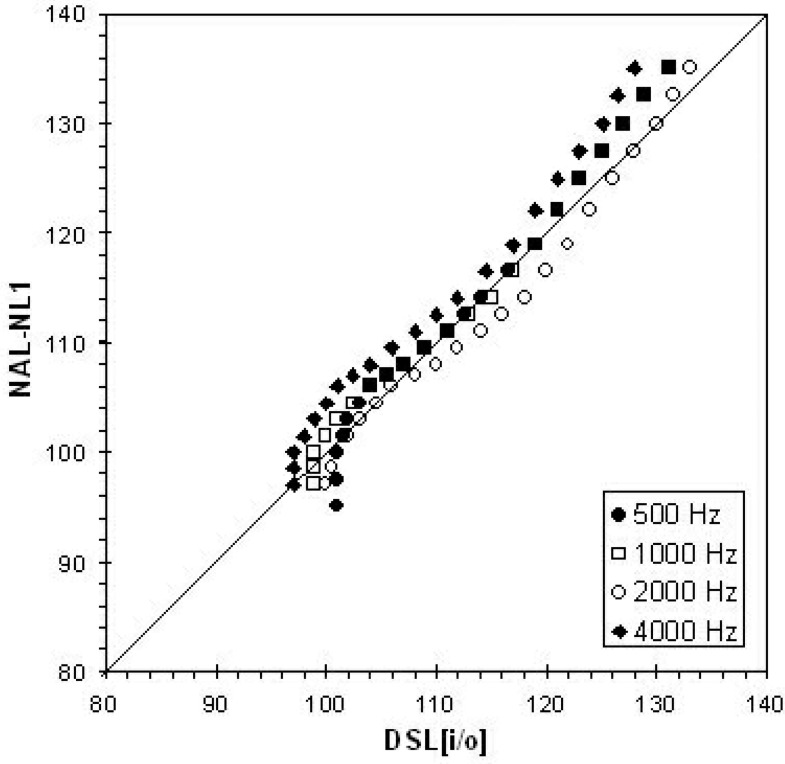
The BOLT level is placed at a fixed level below the narrowband ULC. This fixed distance between the BOLT and the ULC was defined through a combination of literature review and data re-analysis. Literature review was targeted at (1) the relative success of hearing instrument fittings employing a known output limiting strategy, (2) comparison of the DSL-predicted ULCs to those of other prescriptive formulas, and (3) loudness summation for high-level narrowband versus broadband signals. Research indicates that hearing instruments with appropriate narrowband output limiting are successful in avoiding loudness discomfort in real-world use (Dillon and Storey, 1998; Munro and Patel, 1998). Also, comparison of the experimentally validated NAL prescription of output limiting with the DSL-prescribed ULCs indicates that they are highly similar (see Figure 13). Both of these findings, along with the appropriate loudness results obtained with linear and WDRC fittings in our laboratory (Jenstad et al., 1997), encourage us to maintain the DSL-predicted ULC equations.
Figure 13.
Target real-ear aided response (REAR) levels for four frequencies from two prescriptive formulas (DSL[i/o] and NAL-NL1) for flat hearing threshold levels ranging from 0 through 110 dB HL. Target calculations assume an adult user, TDH phones, and a behind-the-ear-style hearing instrument with one channel.
To supplement the narrowband ULCs with an additional broadband target, two questions had to be answered. First, how far below the narrowband ULC should the long-term average speech spectrum be limited to avoid loudness discomfort? Second, how much compression of the unaided crest factor of speech is observed in nonlinear hearing instruments? By considering these two factors in combination, we arrived at a solution that simultaneously allows the peaks of speech to be placed at or near the ULCs (as shown in Figure 12), yet limits the LTASS to a level that would not be inappropriately loud. Bentler and Pavlovic (1989) found that the threshold of discomfort for an 8-component pure-tone complex was 16 dB below the threshold of discomfort for a single pure tone. Pure-tone thresholds of discomfort are typically compared with the peaks of speech, which are assumed to be 10 to 15 dB above the RMS levels of speech. Therefore, this experimental result may be best interpreted as a requirement to place the RMS levels of speech approximately 16 dB below the threshold of discomfort, which places the peaks of speech 1 to 6 dB below the threshold of discomfort. For the purposes of DSL v5.0, we will take the median of this range and assume 3 dB of broadband loudness summation after accounting for the crest factor of speech.
An accurate prescription of this 3-dB goal requires knowledge of the actual crest factor (i.e., the difference between the peaks and LTASS of speech) observed in hearing-aid-processed speech. Raw data describing the aided LTASS from a set of 41 linear and nonlinear hearing instruments has been previously reported (Scollie et al., 2001). The recordings from this study were re-analyzed to determine the peaks of speech (for the 82 dB SPL stimulus). The difference between the speech peaks and the previously reported LTASS data was computed to estimate the crest factor for each hearing instrument. The average crest factor per frequency ranged from 9.2 to 13.9 dB, across all hearing instruments in the sample. A subset of hearing instruments was selected to determine the maximum effects of compression in 6 fast-acting7 nonlinear devices and 13 linear devices fitted to equivalent audiograms. Figure 14 (panel a) shows the mean crest factors for four test frequencies along with standard deviations. The mean crest factors between the two groups of hearing instruments differ by no more than 1.6 dB, and the range of ±1 standard deviation overlaps considerably at all test frequencies. Similar results were found for a comparison of linear and multichannel hearing instruments: crest factors differed by no more than 1.9 dB, with the range of crest factors overlapping considerably between the two groups of devices (Figure 14, panel b). Planned comparisons with a Bonferroni correction indicated that no statistically significant differences existed between the crest factors observed for high-level speech between linear and fast-acting nonlinear hearing instruments.
Figure 14.
Comparison of measured crest factor for speech from linear hearing instruments vs either nonlinear, fast-acting hearing instruments (a) or nonlinear, multichannel hearing instruments (b).
Based on these data, the average crest factor of speech is approximately 10 dB when processed by conventional hearing instruments. Although this estimate changes somewhat between hearing instruments, the changes cannot be reliably attributed to either fast-acting compression effects or multichannel signal processing, at least as they are quantified and/or described by conventional standards. Therefore, the BOLT has been set at 13 dB below the ULC in DSL 5.0. This corresponds with a hearing instrument fitting that places the peaks of speech 3 dB below the ULC. The addition of the BOLT to the i/o algorithm defines the limiting stage displayed in the DSLm[i/o] target function for 1/3-octave bands of speech (Figure 15). The addition of the BOLT parameter to the algorithm should result in a prescription that limits the output of speech signals more appropriately by taking into account the headroom required for speech signal processing.
Figure 15.
Comparison of DSL[i/o] and DSLm[i/o] target input/output functions, shown as thick and thin lines respectively. The dashed lines mark the detection thresholds and upper limits of comfort. The target level for 60-dB speech in this band is also shown for reference (•). See Figure 10 for fitting details. RE = real ear; BOLT = broadband output limiting threshold; WDRC = wide-dynamic-range compression.
Compression
Compression is used in hearing instrument signal processing for two general purposes: (1) WDRC, an automatic volume control that acts gradually over a wide range of input levels, sometimes adjusted with the goal of normalizing loudness perception; and (2) output compression limiting (OCL), an output limiter that uses a high compression ratio to prevent high-level inputs from saturating the hearing instrument receiver and/or exceeding a user's ULC. For the purposes of this document, the OCL form of compression is considered a form of signal processing used to meet output-limiting targets (see previous section). The remainder of this section will focus on the WDRC form of compression.
The DSL[i/o] algorithm used a specific approach to the use of WDRC, in which normalization of frequency-specific loudness was the goal. The algorithm computed a narrow-band, curvilinear, target input-output function that would amplify all input levels to a normal loudness (see Figure 10, see also Seewald et al., 2005). This loudness mapping procedure was repeated at each audiometric frequency, resulting in a series of nine input/output plots that were used to prescribe frequency responses at any input level.
In the DSLm[i/o] algorithm, the specific approach is not necessarily that of loudness normalization for two reasons. First, current loudness models do not account for the adult-child differences in preferred listening level reported earlier in this chapter, nor for the developmental differences in listening requirements that are evident in the literature. Second, loudness normalization attempts to make all sounds audible and normally loud. It is not likely that this is an appropriate goal for low-level background noise, nor is it an attainable goal given the noise floor of most hearing instruments. Therefore, we wish instead to use compression processing to meet the goals of providing audibility and comfortable loudness of important speech cues, given some consideration for the general limits of hearing instruments and the limited dynamic range of the individual hearing instrument user. This requires consideration of conversational speech and the range of speech across vocal effort levels, and building a compression stage that spans as much of this as possible.
The process begins with the computation of the DSL v4.1: DSL[i/o] prescription, limited as described above. This is followed in DSL v5.0: DSL m[i/o] by prescription of a compression threshold and the definition of gain for speech within the compression region. These two computations will be described below.
Prescribing the WDRC Compression Threshold (CT)
The first step in this process is to define the lowest speech level that can reasonably be considered a candidate for WDRC processing in real hearing instruments worn in real environments. This functions as a prescribed compression threshold that should be attainable with conventional technology. More ambitious goals for WDRC can be incorporated into DSL 5.0 by overriding the calculated levels. It should be noted that this degree of matching the target CT to the actual CT of the hearing instrument may require a software-assisted approach to be clinically feasible. As well, it may require a closed and well-fitted earmold and/or an effective feedback controller for the instrument to be wearable without feedback. The WDRC CT, like other variables in the m[i/o] target function, are defined as 1/3-octave band levels of speech. The prescribed overall levels of the compression thresholds range from approximately 30 dB SPL to about 70 dB SPL re: free field, as a function of hearing level (Figure 16).
Figure 16.
Relation between hearing threshold levels (dB HL) and proposed input levels (dB SPL in the sound field) for the wide-dynamic-range compression (WDRC) threshold. The solid line is a third-order polynomial fit to a set of hypothesized compression threshold values (•). Dashed lines indicate the range of speech inputs considered by DSL 5 (i.e., 52 and 74 dB SPL), for reference.
The rationale for the compression threshold is, by necessity, largely hypothesis-based. Very little evidence exists that determines an appropriate compression threshold prescription, particularly as it would relate to single vs multichannel compression devices. Therefore, the six points shown in Figure 16 are proposed as initial starting points for compression thresholds in this version of DSL. The third-order polynomial function that runs through them is proposed as a nonlinear function that can be used as a prescription algorithm. This strategy requires experimental validation, both of the general concept (i.e., that compression threshold should vary as a function of hearing level) and the specific values used.
The compression threshold is intended to keep the gain in the hearing instrument high, even at low inputs, so that low-level speech recognition is supported. This adjustment is made assuming that the compression ratio will also increase as hearing loss increases, as already computed by the DSLm[i/o] algorithm. The points of 0 and 15 dB HL were set to 15 dB above the sound field calibration level for 0 dB HL as a compromise between audibility for low-level speech vs low-level background noise in relatively quiet environments. For listeners with losses of about 40 dB HL, DSL-based WDRC fittings allowed ceiling speech recognition and loudness normalization for speech at an input level of 48 dB SPL (Jenstad et al., 1999; 2000). The remaining points were determined through review of attainable and successful pilot WDRC fittings in our laboratory that attempted to maintain the compression stage across as broad a speech input range as possible. For severe-to-profound hearing losses, the fitting goal was modified to use WDRC as a means for controlling the loudness of high-level speech. For application in the frequency-specific target i/o plots, this overall strategy was converted to use ear canal SPL thresholds rather than HL thresholds and was applied using frequency-specific levels of speech and threshold level. Polynomial fits were re-computed for each frequency. The final product of this work is a series of frequency-specific equations that relate hearing threshold level to a prescribed compression threshold. For steeply sloping losses, a higher compression threshold is prescribed in the high frequencies vs the lower frequencies. Therefore, at each frequency, the input range associated with WDRC processing is defined as the range between CT and the first input level that would be limited by either the long-term average speech spectrum at BOLT or the peaks of speech at ULC.
As mentioned earlier, the notion of prescribing a variable CT based on hearing levels is a new, hypothesis-driven aspect of DSL v5.0. Experimental evaluation of this feature is necessary. In clinical implementation of DSL v5.0, the prescribed compression threshold can be either used or overridden with a modified compression threshold. This may be an important factor to consider when using DSL v5.0 with some technologies. For example, when fitting WDRC technology for severe and profound losses, it may be possible to use a lower CT than recommended by DSL if the higher gains can be achieved without feedback. In fittings with well-fitted earmolds and/or effective feedback cancellation schemes, such a strategy may be well worth pursuing.
Prescribing Gain Within the WDRC Stage
The second step in the process is to prescribe the gains that should be applied within the WDRC stage. Target levels and compression ratios are initially computed using the DSL[i/o] algorithm. However, recall that this algorithm reflects an entirely compressive goal of hearing instrument fitting. The DSL m[i/o] algorithm restricts the input range over which this compressive algorithm is applied by using the HL-dependent algorithm for CT described above. Therefore, the DSL[i/o] algorithm is used to compute a target for speech at 60 dB SPL, unless this would fall below the WDRC CT. If this occurs, the level of the CT is used. The WDRC stage is then defined as the straight line with a slope that equals the compression ratio target that passes through this DSL[i/o]-derived speech target. The WDRC stage ends where it meets the limiting stage on the upper side and terminating at the CT on the lower side (see Figure 15). Below this level, a linear gain rule is applied. Above the BOLT level, the i/o function is limited with an infinite ratio.
If the hearing instrument also offers expansion, the linear stage may be limited to span only the input range between the compression threshold and a point that is 10 dB below the RMS level of soft speech. It is assumed that input signals below this level are likely background noise. As with the compression threshold, the expansion threshold can be overridden with the known threshold used by the device. Below the expansion threshold, an expansion stage is computed with a nominal expansion ratio of 1/10. This stage of processing produces negative gain targets, and should therefore be disabled when working with hearing instruments that do not offer this type of processing, or when the status of expansion processing in the device is unknown.
Effective Compression Ratio
Typically, description of compression ratios in the hearing instrument industry is done to report the slope of the hearing instrument's input/output function between the compression threshold and the limiting threshold. This type of compression ratio is usually measured via pure tone input/output plots and only applies to the WDRC stage of the hearing instrument's signal processing. In cases with high compression thresholds, this narrowband compression ratio measurement may not reflect the hearing instrument's processing characteristics for real-world signals. This type of compression ratio is computed within DSL v5.0, but is also supplemented by another definition of compression ratio, termed the “effective” compression ratio (ECR). This calculation fixes a specific input range, regardless of the current compression threshold setting, so that the ECR measurement is always an indicator of how much compression is present across a functional range of speech inputs, from soft to loud (but not shouted) speech. This value is intended to functionally describe the amount of long-term compression of inputs that will be encountered by the listener. It is not intended to be an electroacoustic descriptor for verification, although it does provide a general indication of the amount of compression required. Depending on hearing loss, these input levels can potentially be processed by the limiting, WDRC, linear, or perhaps even the expansion stage of the DSLm[i/o] algorithm. Therefore, the effective compression ratio value is increased whenever the soft-loud input range is partially or completely processed within the WDRC or limiting phase. Conversely, it is reduced whenever any portion is processed by the expansion stage.
Modifying DSLm[i/o] for Individual Fittings Binaural Fittings
Various authors have attempted to measure the degree of binaural loudness summation (BLS) in listenings with and/or without hearing impairment. Dermody and Byrne (1975) evaluated BLS in binaural hearing instrument users using 1/3-octave band noises ranging from 10 to 40 dB sensation level at 3 frequencies. The average BLS ranged from 2.3 to 5.5 dB. Other evaluations of BLS tend to indicate larger values as the stimulus level increases on the order of 3 dB at threshold and 10 dB at the loudness discomfort level (Haggard and Hall, 1982; Hall and Harvey, 1985; Bentler and Nelson, 2001). However, Hawkins et al. (1987) reported that the degree of BLS is strongly related to psychophysical procedure, reporting BLS at loudness discomfort levels that ranged from 0.4 to 10.3 dB across procedures. BLS was smallest (and near zero) when loudness discomfort levels were measured using a clinical procedure. Nonetheless, BLS measured via adaptive procedures was reported to be 5 to 7 dB in the vicinity of the most comfortable level for speech-weighted noise. In summary, low- to mid-level signals show clear evidence of BLS in the range of 3 to 5 dB when measured with speech noise or narrowband noise. BLS likely increases with bandwidth and may increase with input level.
In DSL v5.0, prescribed targets for speech are reduced by 3 dB across input levels for binaural fittings (Figure 17). The reduction of 3 dB, rather than 5 dB, is likely a conservative estimate but was chosen for several reasons. Specifically, other new features of v5.0 also result in gain reduction (see sections on adult targets, output limiting, compression thresholds, and targets for noisy environments), so the binaural correction was made conservatively to preserve audibility, particularly for pediatric fittings. The amount of BLS may vary between individual listeners, so clinical application of binaural targets may require an individualized approach, when possible.
Figure 17.
Comparison of monaural and binaural target input/output functions generated by the DSLm[i/o] algorithms, shown as thin and thick lines respectively. See Figure 10 for fitting details.
Adult Fittings
There is current debate on the interpretation of loudness judgements made near the detection threshold. Some authors argue that loudness growth near threshold is extremely rapid, indicating that listeners do not truly perceive “softness” for sounds at or near the threshold (Buus, Müsch, and Florentine, 1998; Buus and Florentine, 2002). Others argue that this is not the case (Moore, 2004). However, the sensation level range of this debate encompasses only the first 5 to 10 decibels of the normal dynamic range. In studies of loudness over the first 20 decibels above threshold, categoric scaling judgments across a group of normal hearing individuals were defined by ratings of “inaudible” to “very soft” (Launer, 1995). Because DSL [i/o] is based on loudness normalization, the input dynamic range for target calculation extends to the threshold of normal hearing, labeled “Imin” in the publication of DSL[i/o] (Cornelisse et al., 1995). The inclusion of inputs as low as 0 dB HL may produce a higher compression ratio and gain for low-to-moderate levels than may be desirable for adult hearing instrument users.
We performed simulations of fittings made with and without the 0 to 20 dB HL region included in the input range of the DSL m[i/o] formula. For a 50 dB HL, this correction reduces the gain for 60-dB speech by approximately 7 dB (Figure 18). This is in good agreement with the adult-child differences in preferred gain reported earlier and with adult-child loudness growth differences reported in the literature (Serpanos and Gravel 2000).
Figure 18.
Comparison of pediatric/congenital and adult/acquired target input/output functions generated by the DSLm[i/o] algorithms, shown as thin and thick lines respectively. See Figure 10 for fitting details.
For hearing instrument fitting in adult listeners with acquired hearing impairment, this allows the prescription to fit to the maximum of the 18-to 30-year-old normal hearing range, or 20 dB HL, rather than to the minimum of the normal hearing range, corresponding to 0 dB HL. In DSL m[i/o], this correction is applied before calculation of the multistage input/output algorithm. This results in a lower level of prescribed gain for the entire target input-output function, and a lower compression ratio. The effect of the correction is therefore nonlinear, in that it causes a different amount of reduction at different input levels. The correction for adult-acquired hearing losses was applied to 10 audiograms spanning the mild-through-profound range, with a range of slopes (Table 4). Resulting target values were compared with targets derived without the correction (i.e., the pediatric-congenital prescription), shown as four frequency average thresholds and targets in Figure 19. The slight variations observed across HL values are due to the differences in slope for the 10 test audiograms. The difference in prescriptive targets is largest for mild-to-moderate losses. A smaller correction is applied as hearing level increases, with differences of about 3 dB for hearing losses in the 80 dB HL region. This is a desired effect, because it maintains audibility of speech for severe and profound hearing losses. The adult targets are recommended for use with hearing instrument users who have acquired hearing loss. Further experimental evaluation of the age-related correction is required. Clinical application of this correction will allow the clinician to indicate whether the hearing impairment was congenital (or at least early in life) vs acquired postlingually, likely as an older adult. Put differently, the age correction is not tied in any way to the birth date of the patient but, rather, is a clinical choice to be made on an individual basis.
Table 4.
Hearing Threshold Levels, in dB HL, for 10 Theoretical Audiograms Used in Generating Targets from the DSLm[i/o] Algorithm
| Frequency (Hz) | |||||||||
|---|---|---|---|---|---|---|---|---|---|
| 250 | 500 | 750 | 1000 | 1500 | 2000 | 3000 | 4000 | 6000 | |
| A | 30 | 30 | 30 | 30 | 30 | 30 | 30 | 30 | 30 |
| B | 30 | 30 | 35 | 35 | 40 | 40 | 45 | 45 | 50 |
| C | 30 | 30 | 35 | 40 | 45 | 50 | 60 | 70 | 75 |
| D | 30 | 35 | 40 | 45 | 50 | 60 | 80 | 90 | 90 |
| E | 50 | 50 | 50 | 50 | 50 | 50 | 50 | 50 | 50 |
| F | 50 | 50 | 55 | 55 | 60 | 60 | 65 | 65 | 70 |
| G | 50 | 50 | 50 | 55 | 65 | 70 | 80 | 90 | 95 |
| H | 70 | 70 | 70 | 70 | 70 | 70 | 70 | 70 | 70 |
| I | 70 | 70 | 75 | 75 | 80 | 80 | 85 | 85 | 90 |
| J | 90 | 90 | 90 | 90 | 90 | 90 | 90 | 90 | 90 |
Figure 19.
Average real-ear output targets for DSL v5.0 as a function of four-frequency pure-tone average threshold values (dB HL), for pediatric/congenital and adult/acquired target types in DSL v5.0. PTA = pure-tone average; RESP = real-ear sound pressure level.
Prescriptions for Use in Noise
The hearing instrument prescription generated in DSL v5.0 is specific to either quiet or noisy listening environments. For quiet environments, the DSLm[i/o] algorithm is used as described above, aiming for a high level of audibility even for low-level sounds. However, in noisy environments, this level of audibility may amplify background noise. A variety of technologies are available for use in noisy environments, ranging from personal FM systems, to directional microphones, to alternative hearing instrument memories employing noise attenuation processing or alternative frequency responses using reduced gain. The noise prescription within DSL v5.0 is aimed at the latter strategy. Obviously, technologies such as FM systems or directional microphones are preferable to this strategy, as they are effective in increasing signal-to-noise ratio and thereby improving speech intelligibility. However, these technologies are not always available for various reasons, including device and/or financial limitations. Therefore, DSL v5.0 will generate a lower-gain prescription for use in noise that aims to (1) preserve audibility of acoustic cues in speech that are expected to contribute most to intelligibility, and (2) raise the compression threshold to reduce the gain applied to background noise. Both pediatric and adult prescriptions may be modified for use in noisy listening environments.
Two corrections are made if a noise program is selected. First, the frequency response is weighted using the “average speech” band importance function initially described by Pavlovic (1987) and later included in the Speech Intelligibility Index standard (ANSI, 1997). The importance function is compressed by a factor of two before application to prevent large reductions in audible bandwidth, which are known to reduce speech intelligibility in noise (Skinner and Miller, 1983). This particular weighting was chosen as the least age- and material-dependent of published importance functions. Second, the compression threshold is raised by 10 dB to reduce the gain for background noise (i.e., when the talker is not speaking). Together, these two corrections result in a lower sensation level at lower and higher frequencies and less gain for low-level inputs than would be prescribed by the targets for use in quiet environments. This may be effective for increasing the acceptability of noisy signals (Dean and McDermott, 2000), assuming that three conditions are met: (1) the compression is sufficiently fast-acting to reduce gain for background noise when the speaker is talking, (2) the speaker raises his or her voice to a positive signal-to-noise ratio; and (3) the 10 dB increase given to the compression threshold is correctly placed. This approach to prescribing a different set of amplification characteristics for use in noisy environments requires experimental evaluation to determine if acceptability of noise is increased. It is not expected that this approach will improve speech intelligibility and, therefore, is best considered as one of a family of options that exist for managing noisy environments for hearing instrument users.
Multichannel Compression
The DSL m[i/o] calculations can be modified to correspond to the channel structure of hearing instruments that use multiple channels of compression. The 1/3-octave band frequencies are grouped into common channel families defined by the crossover frequencies in the hearing instrument, and the multistage input/output algorithm is re-computed per channel. This results in a single compression ratio target per channel. The gains within the compression region of the resulting i/o target plots are also adjusted so that the prescribed frequency response is preserved, at least for mid-level signals. Essentially, this requires slight frequency re-shaping to prevent hearing instruments with different channel structures from providing a different frequency response for mid-level speech signals. Therefore, targets at moderate input levels show very little effect of channelization, while targets for very high and very low inputs show a somewhat greater effect. For example, the difference between a single-channel and a 17-channel prescription is as large as 4 dB for an audiogram sloping to a severe high frequency loss (Audiogram G in Table 4). This assumes that the hearing instrument's frequency response is smooth, regardless of the channel structure (i.e., targets do not assume large notches in frequency response shape in the region of crossover frequencies).
Conductive Losses
Listeners with conductive and/or mixed hearing losses have higher loudness discomfort levels and prefer a higher level of use gain than do listeners with hearing loss that is entirely sensorineural in nature (Berger, 1980; Carlin and Browning, 1990; Walker, 1997a; Walker, 1997b; Liu and Chen, 2000). Several strategies developed to account for these effects in hearing instrument prescription have been proposed in the literature. When prescribing maximum output, some suggest increasing the estimate of loudness discomfort level by the air-bone gap, or at least by a large proportion of the air-bone gap (Dillon and Storey, 1998; Walker, 1998). When prescribing gain, some suggest prescription and summation of separate gain prescriptions for the conductive and sensorineural hearing loss, once the bone conducted thresholds have been corrected for the Carhart effect (Walker, 1997a; Dillon and Storey, 1998). At least one laboratory evaluation suggests that adult hearing instrument users with mixed hearing loss preferred a listening level equivalent to the NAL prescription plus gain equivalent to the conductive portion of their hearing loss (Walker, 1998). Another evaluation suggests that hearing instrument users with mixed hearing losses used about 6 dB more gain than hearing-matched peers with sensorineural losses (Carlin and Browning, 1990). However, both the Carhart effect and the impact of conductive loss on loudness discomfort levels are variable across individuals, making accurate estimation difficult (Gatehouse and Browning, 1982; Walker, 1997a, 1998; Liu and Chen, 2000). This would likely be further complicated in pediatric applications where frequent partial data occur, making a frequency-specific correction rather difficult. Also, successful corrections proposed in the literature have recommended a greater gain increase when based on the NAL prescription (Walker, 1997b) than other studies based on the half-gain rule (Berger, 1980) and caution against fully applying gain increases from laboratory studies in real-world hearing instrument fittings until further evaluation is completed (Walker, 1998).
In a nonlinear prescription that is based on an input/output function, adjustments to the loudness discomfort level estimate will cause the input/output function to steepen, becoming more linear and employing more gain. This strategy has been applied in DSL v5.0, but with several limits. First, targets in DSL are not allowed to exceed 140 dB SPL in the ear canal, regardless of circuit type or the presence of conductive hearing loss. Second, predictions of the ULC are increased by 25% of the uncorrected air-bone gap, averaged across the frequencies of 500, 1000, 2000, and 4000 Hz. This was done, rather than a frequency-specific correction, to avoid large modifications to the prescribed frequency response, given the rather large effects that this can have on perceived sound quality and intelligibility (Walker, 1998). This results in a correction approach that provides a smaller correction as hearing level increases (often because the 140 dB limit to the loudness discomfort level is reached). Gain increases to conversational speech are 5 to 9 dB at most (i.e., assuming a conductive overlay of 60 dB) between hearing threshold levels of 30 and 90 dB HL (Figure 20). This amount of reduction is in agreement with increases reported in studies of use gain in real environments by hearing instrument users with conductive or mixed hearing losses (Berger, 1980; Carlin and Browning, 1990).
Figure 20.
Effect of applying a conductive correction to the prescribed gains for conversational speech. Prescribed 2-cc coupler gains (average gain for 500, 1000, 2000 Hz) for four flat hearing losses are shown, assuming either sensorineural loss or various degrees of conductive overlay within the stated hearing threshold level.
Sample Prescriptions: DSL v4.1 versus DSL 5.0
The previous sections have explained the rationales for several changes made to the DSL[i/o] prescriptive algorithm to generate a new version, the DSL multistage input/output algorithm, or DSLm[i/o], for use in the version 5.0 of the DSL Method. The main effects of these changes are (1) output limiting that is more appropriate for speech signals, (2) a change to define targets for a different range of speech inputs, (3) generation of targets for different listening situations and different ages of hearing instrument wearers, and (4) more detailed matching of the target i/o properties with the compression characteristics of modern hearing instruments. The impacts of some of these changes are illustrated in Figures 21 through 23. Essentially, for any one hearing loss, up to four different prescriptions may be generated: (1) an infant or child using a hearing instrument in a quiet environment, (2) an infant or child in a noisy environment in the absence of other noise reduction technology; or (3) and (4) these two options modified for use with adults. Four such prescriptions are shown for a moderate-to-moderately severe hearing loss. First, the pediatric/quiet prescription was developed, which is generally similar to the DSL 4.1 prescription for inputs of 70 dB SPL (Figure 21, panel a). If the 60 dB SPL definition of conversational speech is used, the targets will appear lower simply because the input level is lower (Figure 21, panel b). This does not reflect a change in prescriptive goals, but is likely a more realistic depiction of the aided levels of conversational speech.
Figure 21.
(a) DSL v5.0 prescriptive targets for a pediatric hearing instrument user for a speech input of 70 dB SPL (solid heavy line), displayed in an SPLogram format that shows threshold (○), predicted upper limit of comfort (*), and the DSL v4.1 targets for 70 dB SPL speech (+). All targets are shown as long-term average speech spectra in 1/3-octave bands. (b) DSLlm[i/o] targets for speech at 60 dB SPL input levels are shown by the thin line.
Figure 23.
DSL v5.0 and DSL v4.1 (+) prescriptive targets for a pediatric hearing instrument user and an adult hearing instrument user with equivalent hearing losses of 50 dB HL and equivalent ear canal acoustics. Format follows that of Figure 21. Panel a shows targets for the pediatric user, for speech inputs of 52, 60, 70, and 74 dB SPL. Panel b shows targets for the adult user for the same input levels.
For severe-to-profound and/or steeply sloping losses, new target limits may cause the DSL v5.0 prescription to appear lower than the DSL v4.1 prescription. The new limits for output limiting of speech may cause targets to be limited at lower levels than were used in DSL v4.1. An example of this is shown in Figure 22. The DSL v5.0 target for 70 dB SPL speech inputs appears to have been reduced by about 5 dB relative to the DSL 4.1 target (panel a). However, this limit allows headroom for the peaks of speech (panel b). The lower target is, therefore, a realistic limit for speech signals and is not intended to diminish importance of high-frequency audibility for children. When the listener's dynamic range is less than the 30 dB input dynamic range of a speech signal, electroacoustic limits may mean that some parts of the speech signal are inaudible to avoid discomfort.
Figure 22.
DSL v5.0 and DSL v4.1 (+) prescriptive targets for pediatric hearing instrument user with a sloping hearing loss. Format follows that of Figure 21. Panel a: Targets for the Long Term Average Speech Spectrum are shown. Panel b: Assumed levels of the peaks and valleys of speech are superimposed (- - -).
As described above, adults with acquired hearing losses will be prescribed a lower level of audibility than would be provided for infants or children. This difference is illustrated for the same audiogram, assuming the same HL to SPL transform,8 for input levels ranging from 52–74 dB SPL, along with the DSL v4.1 prescription (Figure 23). The prescription shown for use in quiet environments is somewhat lower in overall level for adults (panel b) than for children (panel a). The reduction in target levels also results in lower prescribed levels for lower-level speech. This prescription can be modified further for use with binaural fittings or for use in noise. Despite the various ranges of gain used in these four prescriptions, audibility of the peaks of speech (which would be 10 dB above each of the plotted target spectra) would be maintained in the important 500 to 3000 Hz band for all prescriptions. This reflects the goals of the DSL Method, to provide audibility and comfort of a broad bandwidth of speech, as described in Chapter 1 of this volume (Seewald et al.).
Acknowledgment
We gratefully acknowledge the assistance of Jeff Crukley, Andreas Seelisch, Julianne Tenhaaf, and Carol van Evera in the preparation of this chapter, and Bill Campbell, Maria Kyroglou, and Jane Steinberg for their contributions to data presented in this paper. Finally, we express our gratitude to Ben Hornsby, senior editor, and to two anonymous reviewers, whose thoughtful comments helped to improve the presentation of this work.
Footnotes
We express our deep gratitude to Tim Lushington and Shari Black-Syrovy for collecting these data, to Maria Kyroglou for data entry and early analyses, and to Nancy Smith, Suzette MacIsaac, Brad Stach, and Lorienne Jenstad for contributing to planning this project.
Although a finer scale for indexing fit to targets would have been desirable, it would also have been difficult to achieve consistently given the small size of the verification printouts.
We gratefully acknowledge the significant contributions of Bill Cole, president, Etymonic Design, Inc., in developing this solution.
Data from the Pearsons study have also been republished, in part, by Olsen (1998) in order to facilitate access to the results of the study.
Because this was not intended to determine the average decibel level of the two spectra combined, power addition was specifically not done in this calculation.
For details of instrumentation and methodology, see Scollie and Seewald (2002).
Defined as having release times less than 100 msec.
This assumes that the adult and child have equivalent ear canal characteristics. This is unlikely, but allows direct target comparisons to be made for the purposes of this illustration.
References
- Alcántara JI, Moore BC, Marriage J. (2004). Comparison of three procedures for initial fitting of compression hearing aids II. Experienced users, fitted unilaterally Int J of Audiol 43: 3–14 [DOI] [PubMed] [Google Scholar]
- Allen P, Bond CA. (1997). Multidimensional scaling of complex sounds by school-aged children and adults J Acoust Soc Am 102: 2255–2263 [DOI] [PubMed] [Google Scholar]
- Allen P, Jones R, Slaney P. (1998). The role of level, spectral, and temporal cues in children's detection of masked signals J Acoust Soc Am 104: 2997–3005 [DOI] [PubMed] [Google Scholar]
- Allen P, Wightman FL. (1994). Psychometric functions for children's detection of tones in noise J Speech Hear Res 37: 205–215 [DOI] [PubMed] [Google Scholar]
- American Academy of Audiology (2004). Pediatric Amplification Protocol Audiol Today 16(2): 46–53 [Google Scholar]
- American National Standards Institute (1996). American National Standard for Audiometers, ANSI S3.6–1996. New York: Acoustical Society of America [Google Scholar]
- American National Standards Institute (1997). Methods for calculation of the Speech Intelligibility Index, ANSI S3.5–1997. New York: Acoustical Society of America [Google Scholar]
- Bamford J, McCracken W, Peers I, Grayson P. (1999). Trial of a two-channel hearing aid (low-frequency compression-high-frequency linear amplification) with school age children Ear Hear 20: 290–298 [DOI] [PubMed] [Google Scholar]
- Bagatto MP, Moodie ST, Scollie SD, et al. (2005). Clinical Protocols for Pediatric Amplification, Trends Amplifi.
- Bentler RA, Pavlovic CV. (1989). Comparison of discomfort levels obtained with pure tones and multitone complexes J Acoust Soc Amer 86: 126–132 [DOI] [PubMed] [Google Scholar]
- Bentler RA, Nelson JA. (2001). Effect of spectral shaping and content on loudness discomfort J Am Acad Audiol 12: 462–470 [PubMed] [Google Scholar]
- Berger KW. (1980). Gain requirements of conductive hearing losses Br J Audiol 14: 137–141 [DOI] [PubMed] [Google Scholar]
- Blamey PJ, Sarant JZ, Paatsch LE, et al. (2001). Relationships among speech perception, production, language, hearing loss, and age in children with impaired hearing J Speech Lang Hear Res 44: 264–285 [DOI] [PubMed] [Google Scholar]
- Boothroyd A. (1997). Auditory development of the hearing child Scand Audiol Suppl 46: 9–16 [PubMed] [Google Scholar]
- Buus S, Florentine M. (2002). Growth of loudness in listeners with cochlear hearing losses: recruitment reconsidered Assoc Res Otolaryngol. 3(2): 120–139 [DOI] [PMC free article] [PubMed] [Google Scholar]
- Buus S, Müsch H, Florentine M. (1998). On loudness at threshold. J Acoust Soc Amer 104: 399–410 [DOI] [PubMed] [Google Scholar]
- Byrne D, Dillon H, Tran K, et al. (1994). An international comparison of long-term average speech spectra. J Acoust Soc Am 96: 2108–2120 [Google Scholar]
- Carlin WV, Browning GG. (1990). Hearing disability and hearing aid benefit related to type of hearing impairment Clinical Otolaryngol Allied Sci 15: 53–57 [DOI] [PubMed] [Google Scholar]
- Ching T, Newall P, Wigney D. (1997). Comparison of severely and profoundly hearing impaired children's amplification preferences with the NAL-RP and the DSL 3.0 prescriptions Scand Audiol 26: 219–222 [DOI] [PubMed] [Google Scholar]
- Christensen LA. (1999). A comparison of three hearing-aid sound-processing strategies in a multiple-memory hearing aid for adolescents. Sem Hear 20: 183–195 [Google Scholar]
- Cole WA, Sinclair ST. (1998). The Audioscan RM500 Speechmap/DSL fitting system Trends Amplif 3: 125–139 [DOI] [PMC free article] [PubMed] [Google Scholar]
- Condie RK, Scollie SD, Checkley PC. (2002). Children's performance: Analog vs. digital adaptive dual-microphone instruments. Hear Rev 9:40, 42-43-56. [Google Scholar]
- Cornelisse LE, Gagné JP, Seewald RC. (1991). Ear level recordings of the long-term average spectrum of speech Ear Hear 12: 47–54 [DOI] [PubMed] [Google Scholar]
- Cornelisse LE, Seewald RC, Jamieson DG. (1995). The input/output (i/o) formula: A theoretical approach to the fitting of personal amplification devices. J Acoust Soc Am 97: 1854–1864 [DOI] [PubMed] [Google Scholar]
- Cox RM. (1985). A structured approach to hearing aid selection. Ear Hear 6: 226–239 [DOI] [PubMed] [Google Scholar]
- Cox RM, Alexander GC, Taylor IM, Gray GA. (1997). The contour test of loudness perception Ear Hear 18: 388–400 [DOI] [PubMed] [Google Scholar]
- Cox RM, Flamme GA. (1998). Accuracy of predicted ear canal speech levels using the VIOLA input/output-based fitting strategy Ear Hear 19: 139–148 [DOI] [PubMed] [Google Scholar]
- Cox RM, Gray GA. (2001). Verifying loudness perception after hearing aid fitting Am J Audiol 10: 91–98 [DOI] [PubMed] [Google Scholar]
- Cox RM, Mateisch JS, Moore JN. (1988). Distribution of short-term RMS levels in conversational speech J Acoust Soc Am 84: 1100–1104 [DOI] [PubMed] [Google Scholar]
- Cox RM, Moore JN. (1988). Composite speech spectrum for hearing aid gain prescriptions J Speech Hear Res 31: 102–107 [DOI] [PubMed] [Google Scholar]
- Dean MR, McDermott HJ. (2000). Preferred listening levels: The effect of background noise for moderate-to-profoundly hearing impaired aid users Scand Audiol 29: 139–149 [DOI] [PubMed] [Google Scholar]
- Dermody PJ, Byrne DJ. (1975). Auditory localisation by hearing-impaired persons using binaural in-the-ear hearing aids Br J Audiol 9: 93–101 [Google Scholar]
- Dillon H. (1999). NAL-NL1: A new procedure for fitting non-linear hearing aids. Hear J 52: 10–16 [Google Scholar]
- Dillon H. (2001). Hearing Aids. New York: Thieme [Google Scholar]
- Dillon H, James A, Ginis J. (1997). Client Oriented Scale of Improvement (COSI) and its relationship to several other measures of benefit and satisfaction provided by hearing aids J Am Acad Audiol 8: 27–43 [PubMed] [Google Scholar]
- Dillon H, Storey L. (1998). The National Acoustic Laboratories' Procedure for selecting the saturation sound pressure level of hearing aids: Theoretical derivation Ear Hear 19: 255–266 [DOI] [PubMed] [Google Scholar]
- Dunn HK, White SD. (1940). Statistical measurements on conversational speech J Acoust Soc Am 11:27. [Google Scholar]
- Elliot LL, Connors S, Kille E, et al. (1979). Children's understanding of monosyllabic nouns in quiet and in noise. J Acoust Soc Am 66: 12–21 [DOI] [PubMed] [Google Scholar]
- Elliot LL, Katz D. (1980). Children's pure tone detection. J Acoust Soc Am 67: 343–344 [DOI] [PubMed] [Google Scholar]
- Fallon M, Trehub SE, Schneider BA. (2002). Children's use of semantic cues in degraded listening environment. J Acoust Soc Am 111: 2242–2249 [DOI] [PubMed] [Google Scholar]
- Gatehouse S. (1993). Role of perceptual acclimatization in the selection of frequency responses for hearing aids J Am Acad Audiol 4: 296–306 [PubMed] [Google Scholar]
- Gatehouse S, Browning GG. (1982). A re-examination of the Carhart effect. Br J Audiol 16: 215–220 [DOI] [PubMed] [Google Scholar]
- Gitles TC, Niquette PT. (1995). FIG6 In Ten. Hear Rev 2: 28–30 [Google Scholar]
- Gravel JS, Fausel N, Liskow C, Chobot J. (1999). Children's speech recognition in noise using omni-directional and dual-microphone hearing aid technology. Ear Hear 20: 1–11 [DOI] [PubMed] [Google Scholar]
- Haggard MP, Hall JW. (1982). Forms of binaural summation and the implications of individual variability for binaural hearing aids Scand Audiol Suppl 15: 47–63 [PubMed] [Google Scholar]
- Hall JW, Harvey ADG. (1985). Diotic loudness summation in normal and impaired hearing J Speech Hear Res 28: 445–448 [DOI] [PubMed] [Google Scholar]
- Hanin L. (1999). Amplification considerations for the young infant with hearing loss Sem Hear 20: 175–181 [Google Scholar]
- Hawkins DB, Montgomery AA, Prosek RA, Walden BE. (1987). Examination of two issues concerning functional gain measurements J Speech Hear Res 52: 56–63 [DOI] [PubMed] [Google Scholar]
- Hnath-Chisolm TE, Laipply E, Boothroyd A. (1998). Age-related changes on a children's test of sensory-level speech perception capacity. J Speech Lang Hear Res 41: 94–106 [DOI] [PubMed] [Google Scholar]
- Hornsby BW, Ricketts TA. (2003). The effects of hearing loss on the contribution of high- and low-frequency speech information to speech understanding J Acoust Soc Am 113: 1706–1717 [DOI] [PubMed] [Google Scholar]
- Humes LE. (1999). Dimensions of hearing aid outcome J Am Acad Audiol 10: 26–39 [PubMed] [Google Scholar]
- Jenstad LM, Cornelisse LE, Seewald RC. (1997). Effect of stimulus context on individual loudness functions Ear Hear 18(5): 401–408 [DOI] [PubMed] [Google Scholar]
- Jenstad LM, Seewald RC, Cornelisse LE, Shantz J. (1999). Comparison of linear gain and wide dynamic range compression hearing aid circuits: Aided speech perception measures Ear Hear 20: 117–126 [DOI] [PubMed] [Google Scholar]
- Jenstad LM, Pumford J, Seewald RC, Cornelisse LE. (2000). Comparison of linear gain and wide dynamic range compression hearing aid circuits: Aided loudness measures Ear Hear 21: 32–44 [DOI] [PubMed] [Google Scholar]
- Keidser G, Grant F. (2001). Comparing loudness normalization (IHAFF) with speech intelligibility maximization (NAL-NL1) when implemented in a two-channel device Ear Hear 22: 501–515 [DOI] [PubMed] [Google Scholar]
- Killion MC. (1997). The SIN report: Circuits haven't solved the hearing-in-noise problem Hear J 50: 28–32 [Google Scholar]
- Killion MC, Villchur E. (1993). Kessler was right- partly: But SIN test shows some aids improve hearing in noise Hear J 46: 31–35 [Google Scholar]
- Kortekaas RW, Stelmachowicz PG. (2000). Bandwidth effects on children's perception of the inflectional morpheme /s/: Acoustical measurements, auditory detection, and clarity rating J Speech Lang Hear Res 43: 645–660 [DOI] [PubMed] [Google Scholar]
- Launer S. (1995). Loudness perception in listeners with sensorineural hearing impairment. Ph.D Thesis. Oldenburg University, Oldenburg, Germany.
- Lear S, Toe D, Rickards F, Seewald RC. (1999). Effect of output limiting levels upon the speech perception skills of congenitally hearing impaired adolescents Sem Hear 20: 237–250 [Google Scholar]
- Lindley G, Palmer C. (1997). Fitting wide dynamic range compression hearing aids: DSL[i/o], the IHAFF protocol, and FIG6 Am J Audiol 6: 19–28 [Google Scholar]
- Liu TC, Chen YS. (2000). Loudness discomfort levels in patients with conductive and mixed hearing loss Auris Nasus Larynx 27: 101–104 [DOI] [PubMed] [Google Scholar]
- Moeller MP, Donaghy KF, Beauchaine KL, et al. (1996). Longitudinal study of FM system use in nonacademic settings: Effects on language development Ear Hear 17: 28–41 [DOI] [PubMed] [Google Scholar]
- Moore BCJ, Alcántara JI, Marriage JE. (2001). Comparison of three procedures for initial fitting of compression hearing aids: 1 Experienced users, fitted bilaterally. Br J Audiol 35: 339–353 [DOI] [PubMed] [Google Scholar]
- Moore BC. (2004). Testing the concept of softness imperception: loudness near threshold for hearing-impaired ears J Acoust Soc Am. 115(6): 3103–11 [DOI] [PubMed] [Google Scholar]
- Munro KJ, Lutman ME. (2003). The effect of speech presentation level on measurement of auditory acclimatization to amplified speech J Acoust Soc Am 114: 484–495 [DOI] [PubMed] [Google Scholar]
- Munro KJ, Patel RK. (1998). Are clinical measurements of uncomfortable loudness levels a valid indicator of real-world auditory discomfort? Br J Audiol 32: 287–293 [DOI] [PubMed] [Google Scholar]
- Nabelek AK, Robinson PK. (1982). Monaural and binaural speech perception in reverberation for listeners of various ages J Acoust Soc Am 71: 1242–1248 [DOI] [PubMed] [Google Scholar]
- Neuman AC, Hochberg I. (1982). The effect of reverberation on the phoneme discrimination of children. Paper presented at the 1982 ASHA Convention. Toronto, ON. Ref Type: Generic [Google Scholar]
- Nilsson M, Soli SD, Sullivan JA. (1994). Development of the Hearing in Noise Test for the measurement of speech reception thresholds in quiet and in noise J Acoust Soc Am 95: 1085–1099 [DOI] [PubMed] [Google Scholar]
- Nittrouer S. (2002). Learning to perceive speech: How fricative perception changes, and how it stays the same J Acoust Soc Am 112: 711–719 [DOI] [PMC free article] [PubMed] [Google Scholar]
- Nittrouer S, Boothroyd A. (1990). Context effects in phoneme and word recognition by younger children and older adults J Acoust Soc Am 87: 2705–2715 [DOI] [PubMed] [Google Scholar]
- Nozza RJ. (1987). Infant speech-sound discrimination testing: Effects of stimulus intensity and procedural model on measures of performance J Acoust Soc Am 81: 1928–1939 [DOI] [PubMed] [Google Scholar]
- Nozza RJ, Miller SL, Rossman RN, Bond LC. (1991). Reliability and validity of infant speech-sound discrimination-in-noise thresholds J Speech Hear Res 34: 643–650 [DOI] [PubMed] [Google Scholar]
- Nozza RJ, Rossman RN, Bond LC. (1991). Infant-adult differences in unmasked thresholds for the discrimination of consonant-vowel syllable pairs Audiol 30: 102–112 [DOI] [PubMed] [Google Scholar]
- Nozza RJ, Rossman RN, Bond LC, Miller SL. (1990). Infant speech-sound discrimination in noise J Acoust Soc Am 87: 339–350 [DOI] [PubMed] [Google Scholar]
- Olsen WA. (1998). Average speech levels and spectra in various speaking/listening conditions: A summary of the Pearson, Bennett, and Fidell (1977) report. Am J Audiol 7: 1–5 [DOI] [PubMed] [Google Scholar]
- Parsons JO, Clark CR. (2002). Comparison of an ‘intutive’ NHS hearing aid prescription method with DSL 4.1 targets for amplification Int J Audiol. 41(6): 357–362 [DOI] [PubMed] [Google Scholar]
- Pavlovic CV. (1987). Derivation of primary parameters and procedures for use in speech intelligibility predictions J Acoust Soc Am 82: 413–422 [DOI] [PubMed] [Google Scholar]
- Pearsons K, Bennett R, Fidell S. (1977). Speech levels in various noise environments. Project report on contract 68 01-2466. Washington, DC: U.S. Environmental Protection Agency [Google Scholar]
- Pittman AL, Stelmachowicz PG. (2000). Perception of voiceless fricatives by normal-hearing and hearing-impaired children and adults J Speech Lang Hear Res 43: 1389–1401 [DOI] [PubMed] [Google Scholar]
- Pittman AL, Stelmachowicz PG. (2003). Hearing loss in children and adults: Audiometric configuration, asymmetry, and progression Ear Hear 24: 198–205 [DOI] [PMC free article] [PubMed] [Google Scholar]
- Scollie SD. (in review). Children's speech recognition scores: The SII and proficiency factors for age and hearing level. Ear Hear. [DOI] [PubMed]
- Scollie SD, Seewald R, Cole W, et al. (2001). Comparison of two methods to generate SII values from clinical measures of frequency response. Paper presented at the International Hearing Aid Research Conference, Lake Tahoe, CA.
- Scollie SD. (2005). Prescriptive procedures for infants and children. In: Seewald R, Bamford J. eds. A Sound Foundation Through Early Amplification 2004: Proceedings of the Third International Conference. Stäfa, Switzerland: Phonak AG, 91–104
- Scollie SD, Seewald RC. (2002). Predicting aided levels of speech from clinical test signals Ear Hear 23: 477–487 [DOI] [PubMed] [Google Scholar]
- Scollie SD, Seewald RC, Moodie KS, Dekok K. (2000). Preferred listening levels of children who use hearing aids: Comparison to prescriptive targets J Am Acad Audiol 11: 230–238 [PubMed] [Google Scholar]
- Seewald RC, Cornelisse LE, Ramji KV, et al. (1997). DSL v4.1 for Windows: A software implementation of the Desired Sensation Level (DSL[i/o]) Method for fitting linear gain and wide-dynamic-range compression hearing instruments. Users' manual. London, ON: University of Western Ontario; Hearing Health Care Research Unit. [Google Scholar]
- Seewald RC, Moodie ST, Scollie SD, et al. (2005). The DSL Method for pediatric hearing instrument fitting: Historical perspective and current issues. Trends Amplif. [DOI] [PMC free article] [PubMed]
- Seewald RC, Moodie KS, Sinclair ST, et al. (1999). Predictive validity of a procedure for pediatric hearing aid fitting Am J Audiol 8: 143–152 [DOI] [PubMed] [Google Scholar]
- Seewald RC, Ramji KV, Sinclair ST, et al. (1993). Computer-assisted implementation of the desired sensation level method for electroacoustic selection and fitting in children: Version 3.1, User's manual. London, ON: The University of Western Ontario. [Google Scholar]
- Serpanos YC, Gravel JS. (2000). Assessing growth of loudness in children by cross-modality matching (CMM) J Am Acad Audiol 11: 190–202 [PubMed] [Google Scholar]
- Skinner MW, Miller JD. (1983). Amplification bandwidth and intelligibility of speech in quiet and noise for listeners with sensorineural hearing loss Audiology 22(3): 253–279 [DOI] [PubMed] [Google Scholar]
- Smeds K. (2004). Is normal or less than normal overall loudness preferred by first-time hearing aid users? Ear Hear 25: 159–172 [DOI] [PubMed] [Google Scholar]
- Snik AF, Hombergen GC. (1993). Hearing aid fitting of preschool and primary school children An evaluation using the insertion gain measurement. Scand Audiol 22: 245–250 [DOI] [PubMed] [Google Scholar]
- Snik AF, Stollman MH. (1995). Measured and calculated insertion gains in young children Br J Audiol 29(1): 7–11 [DOI] [PubMed] [Google Scholar]
- Snik AF, van den Borne S, Brokx JP, et al. (1995). Hearing aid fitting in profoundly hearing-impaired children: Comparison of prescription rules Scand Audiol 24(4): 225–230 [DOI] [PubMed] [Google Scholar]
- Stapells DR. (2000). Frequency-specific evoked potential audiometry in infants. In: Seewald RC. ed. A Sound Foundation through Early Amplification: Proceedings of an International Conference. Stäfa, Switzerland: Phonak AG, 13–32
- Stapells DR, Picton TW, Durieux-Smith A, et al. (1990). Thresholds for short-latency auditory-evoked potentials to tones in notched noise in normal-hearing and hearing-impaired subjects Audiol 29: 262–274 [DOI] [PubMed] [Google Scholar]
- Stelmachowicz PG, Hoover BM, Lewis DE, et al. (2000). The relationship between stimulus context, speech audibility, and perception for normal- and hearing-impaired children J Speech Lang Hear Res 43: 902–914 [DOI] [PubMed] [Google Scholar]
- Stelmachowicz PG, Pittman AL, Hoover BM, et al. (2001). Effect of stimulus bandwidth on the perception of /s/ in normal- and hearing-impaired children and adults J Acoust Soc America 110: 2183–2190 [DOI] [PubMed] [Google Scholar]
- Stelmachowicz PG, Pittman AL, Hoover BM, et al. (2002). Aided perception of /s/ and /z/ by hearing-impaired children Ear Hear 23:324. [DOI] [PubMed] [Google Scholar]
- Stelmachowicz PG, Pittman AL, Hoover BM, et al. (2004). The importance of high-frequency audibility in the speech and language development of children with hearing loss Arch Otolaryngol Head Neck Surg 130: 556–562 [DOI] [PubMed] [Google Scholar]
- The Pediatric Working Group (1996). Amplification for infants and children with hearing loss: Am J Audiol 5: 53–68 [Google Scholar]
- Turner CW, Humes LE, Bentler RA, Cox RM. (1996). A review of past research on changes in hearing aid benefit over time. Ear Hear 17: 14S–25S [DOI] [PubMed] [Google Scholar]
- Villchur E. (1993). A different approach to the noise problem of the hearing impaired. Am J Audiol 2: 47–51 [DOI] [PubMed] [Google Scholar]
- Walker G. (1997a). Conductive hearing impairment: The relationship between hearing loss, MCLs and LDLs Australian J Audiol 19: 71–80 [Google Scholar]
- Walker G. (1997b). The preferred speech spectrum of people with normal hearing and its relevance to hearing aid fitting Australian J Audiol 19: 1–8 [Google Scholar]
- Walker G. (1998). Frequency response selection for people with mixed hearing loss: Preferred and predicted responses Australian J Audiol 20: 55–66 [Google Scholar]
- Wightman FL, Allen P. (1992). Individual differences in auditory capability among preschool children. In: Werner LA, Rubel EW. eds. Developmental Psychoacoustics. Washington DC: American Psychological Association, 113–133 [Google Scholar]


