Abstract
This investigation examined whether speech intelligibility in noise can be improved using a new, binaural broadband hearing instrument system. Participants were 36 adults with symmetrical, sensorineural hearing loss (18 experienced hearing instrument users and 18 without prior experience). Participants were fit binaurally in a planned comparison, randomized crossover design study with binaural broadband hearing instruments and advanced digital hearing instruments. Following an adjustment period with each device, participants underwent two speech-in-noise tests: the QuickSIN and the Hearing in Noise Test (HINT). Results suggested significantly better performance on the QuickSIN and the HINT measures with the binaural broadband hearing instruments, when compared with the advanced digital hearing instruments and unaided, across and within all noise conditions.
Keywords: hearing aid technology, speech perception, speech in noise, focused contrasts
Introduction
As a field, audiology has long focused on improving audibility as the primary method for correcting hearing loss. While hearing aids provide audibility to enable users to hear better, being able to understand speech is the main reason why hearing aids are used. Several studies have reported speech perception as the single most important aspect of hearing that attributes to hearing aid success (Meister, Lausberg, Kiessling, Walger, & von Wedel, 2002; Meister, Lausberg, Walger, & von Wedel, 2001; Walden & Walden, 2004). With this consideration in mind, hearing aid developers have directed much of their efforts on improving speech intelligibility in noise.
A noisy environment is invariably more challenging for most hearing aid users. In a survey of 3,000 hearing instrument owners by Kochkin (2005), it was found that only 59% of hearing aid users were satisfied with the overall performance of their instruments. Primary reasons for declines in use included difficulties communicating in noisy or difficult listening situations. Naturalness and clarity of sound were reported to be the strongest attributes for successful use of amplification. Walden and Walden (2004) investigated factors contributing to successful amplification use and concluded that variable signal-to-noise ratios (SNRs) within particular environments could determine an individual's successfulness with his or her amplification. Specifically, they found that individuals with hearing loss who could understand speech at lower SNRs are more likely to be successful with hearing aids than individuals that needed higher SNRs. Therefore, bilateral digital technology that promotes noise reduction and enhances the intended speech may encourage successful interactions in situations where communicating can be difficult for an individual with hearing loss.
With the advent of new technologies such as wireless communication between instruments and extended bandwidth, the focus on speech perception has been extended to understanding speech in complex listening environments. Day-to-day listening situations can include following conversation between multiple speakers and listening to a speaker in the presence of competing speakers. In these environments, the SNR is not the only key to speech understanding. Spatial characteristics of sound, such as time differences (sound reaching one ear prior to the other) and level differences (sound louder in the ear that is closer to the sound), also play an integral role in helping the listener navigate through the complex listening world against a backdrop of competing speakers. These characteristics influence how successful an individual will be with localizing speech information.
Hearing instruments in which compression parameters can be differentially adjusted between ears via the wireless link to maintain the interaural differences are available commercially today. With ear to ear synchronization of gain and directionality becoming more common in advanced digital technologies, it could be possible for psychoacoustic cues such as interaural level differences (ILDs) that are vital for source localization to be preserved. Schum and Bruun Hansen (2007) provided a demonstration of the effectiveness of coordinated compression (Spatial Sound) with recordings of white noise presented at 90° azimuth made in KEMAR ear canals. With no hearing aids on KEMAR, the ILD was 8 dB between the near ear and far ear. With Epoqs programmed to a flat 50 dB hearing loss (HL) and a closed microMold, the ILD was 6.5 dB with Spatial Sound on, but only 2.5 dB with Spatial Sound off (Schum & Bruun Hansen, 2007). However, the questions remain as to whether extended bandwidth and/or wirelessly linking the right and left instruments results in better speech intelligibility in the presence of competing speech or speech-spectrum noise.
The purpose of the present investigation was to examine the first of these two questions. Specifically, the present study compared the speech in noise performance of an extended bandwidth (10kHz) wireless binaural broadband instrument (Epoq XW) with an advanced nonwireless instrument with a lower bandwidth (8kHz; Syncro) in both experienced and first-time users of amplification.
Methods
Participants
A total of 36 individuals (22 men, 14 women), aged 39 to 79 years (mean 64.5 years), volunteered for the study. All participants (18 new and 18 experienced hearing instrument users) had symmetrical sensorineural hearing loss, were fluent speakers of English, had sufficient literacy to read and comprehend the language of the test instruments used in this study, and were motivated to try two digital behind the ear (BTE) hearing instruments from Oticon A/S, Denmark. Sensorineural hearing loss could not be worse than 75 dB HL at 250 Hz and 500 Hz, and no worse than 80 dB HL at any other frequency, up to 8 kHz. The hearing loss had to be symmetrical (average of 500Hz, 1kHz, 2kHz, and 4 kHz) and no greater than 10 dB at any frequency. Participants were excluded from the study if any cognitive deficits and/or auditory processing disorders were present, as well as chronic middle ear pathology.
Materials
QuickSIN. The QuickSIN (Etymotic Research, 2001) measures a listener's SNR loss when given six sentences to repeat in the presence of background babble. A list of six sentences with five key words per sentence, spoken by a female talker, is presented in four-talker babble noise. The sentences are presented at prerecorded SNRs that decrease in 5-dB steps from 25 dB SNR (very easy) to 0 dB SNR (extremely difficult). SNR loss is calculated as 25.5 – total correct key words (Etymotic Research, 2001). SNR loss reflects an individual's receptive speech understanding in noise. Participants completed two lists of the QuickSIN with speech presented at 65 dBA at 0° azimuth in two conditions of uncorrelated speech babble created from tracks extracted from the QuickSIN CD (Etymotic Research, 2001). The first condition was speech babble presented at ±135° azimuths, and the second condition was speech babble presented at “four corners,” that is, ±45° and ±135° azimuth.
Hearing in Noise Test. The Hearing in Noise Test (HINT; Nilsson, Soli, & Sullivan, 1994) was developed to provide a reliable and efficient measure of speech reception thresholds for sentences in quiet and in noise. HINT materials consist of 25 equivalent 10-sentence lists. Twenty HINT sentences, spoken by a male talker, were presented from the commercially available HINT CD, version 2.0 (Maico Diagnostics, 2004a), via an adaptive procedure for each condition. Specifically, the adaptive procedure increased the presentation level of the first sentence in 4-dB steps until the sentence was repeated correctly then used 4-dB adaptive steps for sentences 2 to 4 and 2-dB steps for sentences 5 to 20. The presentation levels of the last 16 sentences and the calculated presentation level that the next sentence would have been presented based on the participant's response to sentence 20, were averaged to calculate the receptive threshold for sentences (RTS; Maico Diagnostics, 2004b). A lower RTS indicates better performance. The speech stimuli were presented at 0° azimuth. Noise competition consisted of uncorrelated continuous HINT noise presented at 65 dBA. The noise was convolved in a similar method as that reported by Valente, Mispagel, Tchorz, and Fabry (2006). Specifically (a) List 1 from the HINT CD was imported into Adobe Audition 1.5, (b) the noise track was isolated by removing the speech track, (c) the quiet segments between the noise presentations were removed, and (d) the resulting noise was duplicated several times. Three noise conditions with continuous uncorrelated HINT noise were presented: ±135° azimuths; “four corners,” that is, ±45° and ±135° azimuths; and “eight speakers,” that is, 45° angles from 0° to 315° azimuths.
Procedure
Audiometric testing. Prior to participation in this investigation, participants underwent a complete audiological evaluation administered in a double-walled Industrial Acoustics Company, Inc. (IAC) sound-treated room using a GSI-61 clinical audiometer and E.A.R. 3-A earphones. Tympanometry, acoustic reflexes, and acoustic decay were screened using the Madsen Otoflex 100. Participants who qualified for the study had to sign an institutional review board–approved informed consent document. After the consent document was signed, earmold impressions were made for individuals that were to be fit with custom micromolds/earmolds based on audiometric thresholds.
Hearing instrument fittings. All patients were fit randomly with a set of Epoq XW RITEs (with ear to ear synchronization and 10-kHz bandwidth) or Syncro V2 BTEs (with no ear to ear synchronization and 8-kHz bandwidth). After a period of adaptation (2 weeks for experienced users and 4 weeks for new users) and testing with the first instruments, the participants were then switched to the other hearing instruments. For the participants whose pure tone average (PTA) at 250 Hz, 500 Hz, and 1 kHz was less than 30 dB HL, the appropriate sized open dome was used. For participants whose PTA was greater than 30 dB HL, custom micromolds were supplied by Oticon for the Epoq, and standard skeleton earmolds with a 3.0-mm vent for the Syncro, based on ear impressions. The hearing instruments were fit to prescribed settings, as per Genie, Oticon's proprietary software. New users were fit initially with Adaptation Manager Step 1 to allow for acclimatization and then gradually increased to Adaptation Manager Step 3 over the first 2 weeks of the 4-week adaptation period. Experienced users were fit with Adaptation Manager Step 3 and were allowed 2 weeks of use prior to testing. All environmentally adaptive circuitry was active, as per the default fitting. It should be noted that the fitting algorithm (voice aligned compression [VAC]) was also the same for both the Syncro and the Epoq, which enabled similar frequency responses for both models, except for bandwidth, once the hearing instruments were on Adaptation Manager Step 3. The time delay in the digital signal processing platform used in both products is set (approximately 5 ms). This time delay is not affected by any setting in the hearing instruments except whether the device is in directionality in the low frequencies. One reason that the wireless binaural broadband instruments (Epoq) coordinate the mode shifts in directionality is to try to have the devices in the same directional mode as much as possible. Microphone location was controlled for inasmuch as both the Syncro and Epoq are over-the-ear devices. Hearing instrument fittings were verified via real-ear measurements with an Audioscan Verifit.
Testing procedures. All stimuli were imported into and presented via Pro Tools LE v.7.3 software on an Apple Macbook laptop, with a firewire connection to a Digidesign Digi002 rack. The Digidesign Digi002 rack routed eight balanced-line cables through an opening in the IAC double-walled sound-treated booth to eight KRK Rokit 5 Powered loudspeakers. Within the sound-treated test booth, the eight loudspeakers were arranged symmetrically in the horizontal plane at 0°, 45°, 90°, 135°, 180°, 225°, 270°, and 315° azimuths. All loudspeakers were positioned at a height of 3.5-feet, approximating the ear level of an average seated participant. Prior to testing, the stimuli were calibrated using the IE35 system on a Dell Axim X51v personal digital assistant. An Ivie Model IE2P Type I microphone was mounted on a microphone stand in the center of the speaker array, at the level of the loudspeakers.
Participants were seated in the center of the sound-treated booth, with the center of the head 2.5-feet from each loudspeaker. Participant head movements were monitored to ensure that the participant was facing 0° azimuth by visual inspection. Tests, noise conditions, and hearing instruments were randomized and counterbalanced to reduce order effects. The hearing aid cases were unmarked and the aids were given pseudonyms to blind participants to the hearing aids. The participants were blinded to the noise conditions.
The course of the study lasted approximately 2 months for each participant, during which the participant had four to five sessions, each lasting between 1 and 2 hours. Breaks were given to the participants as needed per session. For each test, participants were tested with the Epoq, Syncro, and without hearing instruments (unaided).
Follow-up. After testing, the participants were allowed to keep their preferred set of hearing aids and instructed on care and use. Participants were informed that they may be asked to participate in further testing, but that their participation would be voluntary.
Results
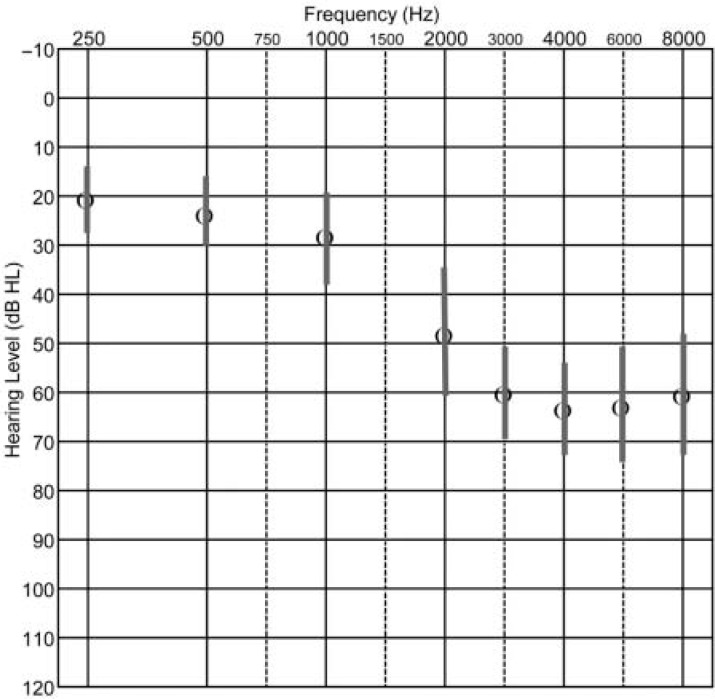
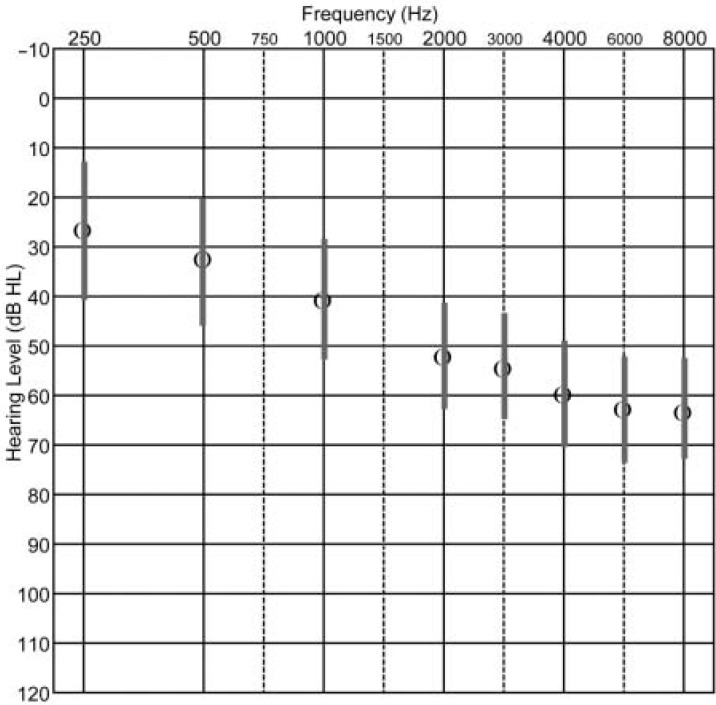
Means and standard deviations for new and experienced users' audiometric data are shown in Figures 1 and 2, respectively.
Figure 1.
Audiometric data for new hearing aid users Circles represent mean thresholds. Lines represent one standard deviation.
Figure 2.
Audiometric data for experienced hearing aid users Circles represent mean thresholds. Lines represent one standard deviation.
Verification of Hearing Aids
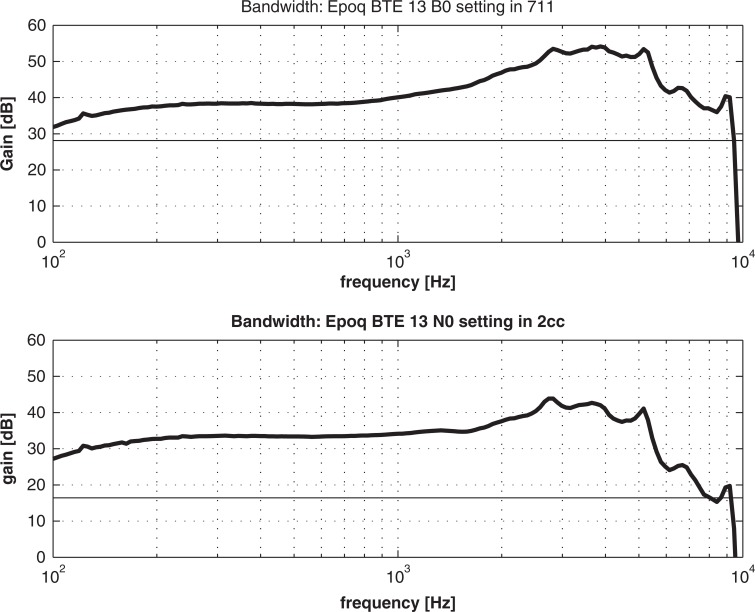
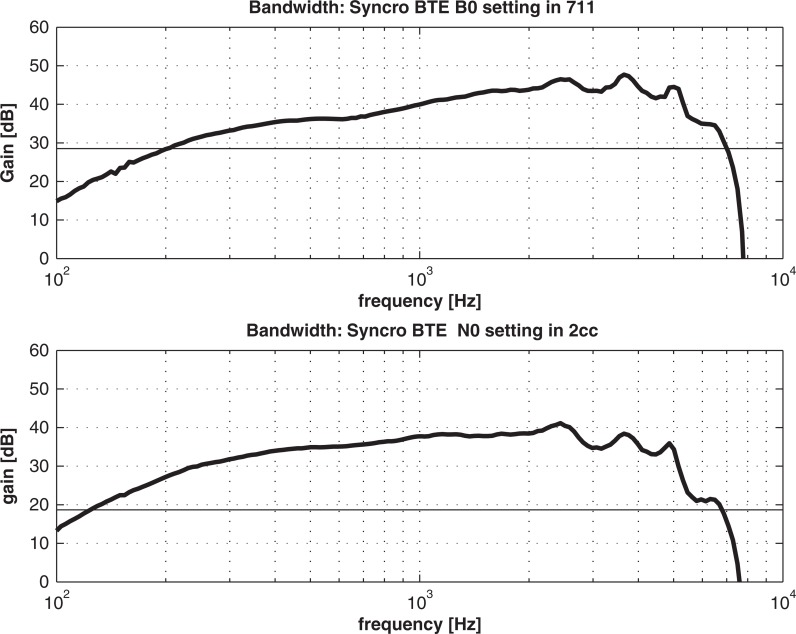
Coupler measures were completed by electro-acoustics of Oticon A/S for the Syncro and Epoq hearing aids to confirm the extended bandwidth of the Epoq devices. Both 2-cc coupler and 711-coupler recordings were made to compare the gain-frequency response of both hearing aids. It should be noted that the impedance of the 711-coupler more closely resembles the response of the average adult ear than the 2-cc coupler, which is commonly used clinically to assess the output of the hearing aid (Kuk & Baekgaard, 2009). Specifically, the 711-coupler recordings demonstrate a broader frequency range and greater amplitude in the high frequencies than the 2-cc coupler recordings. Results are shown in Figures 3 and 4.
Figure 3.
Coupler recordings for the Epoq XW
Figure 4.
Coupler recordings for the Syncro V2
The upper curve is the 711-coupler measurement, based on Deutsche Norm (DIN 45.605; German standard), based on IEC 60188.0. The lower curve is the 2-cc coupler measurement based on ANSI 3.22 and IEC 60188–7.
The upper curve is the 711-coupler measurement, based on Deutsche Norm (DIN 45.605; German standard), based on IEC 60188.0. The lower curve is the 2-cc coupler measurement based on ANSI 3.22 and IEC 60188–7. Note that by virtue of its larger volume, the 711-coupler recordings have less damping in the high frequencies and thus are better suited for demonstrating extended bandwidth.
Speech Perception Results
Comparisons for each test were made via repeated-measures analysis of variance (ANOVA). A focused contrast was then computed to test the specific prediction that the speech perception scores would improve from unaided, to Syncro, to Epoq. Focused contrasts are a more powerful technique to compare independent variables with no underlying continuity than the more traditional post hoc analyses, can be used in repeated-measures contexts, and have been used in other fields, such as psychology, for many years (Furr & Rosenthal, 2003). For a complete discussion on focused contrasts, the reader is referred to Rosenthal and Rosnow (1985).
QuickSIN
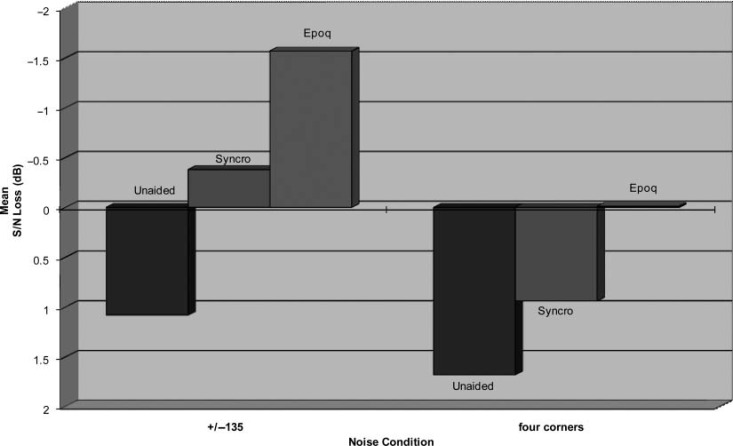
Comparisons of each noise condition between unaided, Syncro, and Epoq were made via 2 × 3 repeated-measures ANOVA. A significant main effect for aid was observed for the QuickSIN scores for both noise conditions, suggesting that at least one of the scores were different than the other scores, F(2, 70) = 15.10, p < .001. The focused contrast between aid conditions was significant, F = 41.82, p < .001, suggesting that the QuickSIN scores were progressively better between the unaided (M = 1.38), Syncro (M = 0.29), and Epoq (M = −0.79) conditions. There was an increase in SNR loss (i.e., worse performance) between the ±135° azimuth noise condition (M = −0.29) and the four corners noise condition, that is, ±45° and ±135° azimuths (M = 0.87) and this difference was significant, F(1, 35) = 26.26, p < .001. There were no significant trends in the aid x angle interaction. Repeated-measures ANOVAs compared results for each noise condition to further analyze these differences. For ±135° azimuth noise condition, results suggested a significant difference for at least one of the aid three conditions, F(2, 70) = 17.79, p < .001. The focused contrast between aid conditions was significant, F = 45.03, p < .001, suggesting that the QuickSIN scores were progressively better (i.e., less SNR loss) between the unaided (M = 1.08), Syncro (M = −0.38), and Epoq (M = −1.57) conditions. For the four corners noise condition, results suggested a significant difference for at least one of the three aid conditions, F(2, 70) = 5.26, p = .007. The focused contrast between aid conditions was significant, F = 14.12, p < .001, suggesting that the QuickSIN scores were progressively better between the unaided (M = 1.68), Syncro (M = 0.94), and Epoq (M = −0.01) conditions. Results are shown in Figure 5. Recall that a smaller SNR loss indicates better performance on the QuickSIN.
Figure 5.
QuickSIN results for unaided, Syncro, and Epoq XW
Recall that the smaller signal-to-noise ratio (SNR) loss indicates better performance.
Hearing in Noise Test
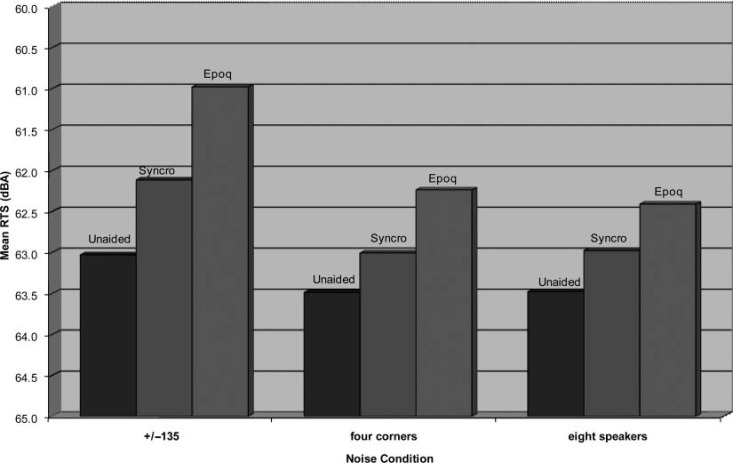
Comparisons of each noise condition between unaided, Syncro, and Epoq were made via 3 × 3 repeated-measures ANOVA. A significant main effect for aid was observed for the HINT scores across all noise conditions, suggesting that at least one of the scores were different than the other scores, F(2, 70) = 12.66, p < .001. The focused contrast between aid conditions was significant, F = 19.86, p < .001, suggesting that the HINT scores were progressively better (i.e., lower RTS) between the unaided (M = 63.33), Syncro (M = 62.70), and Epoq (M = 61.88) conditions. There was an increase in RTS (i.e., worse performance) between the three noise conditions: ±135° azimuths (M = 62.04), four corners (M = 62.91), and eight speakers (M = 62.96), and this difference was significant, F(2, 70) = 15.95, p < .001). There were no significant trends in the aid x angle interaction. Repeated-measures ANOVAs compared results for each noise condition to further analyze these differences. For ±135° azimuths noise condition, results suggested a significant difference for at least one of the three aid conditions, F(2, 70) = 13.29, p < .001. The focused contrast between aid conditions was significant, F = 30.66, p < .001, suggesting that the HINT scores were progressively better (i.e., lower RTS) between the unaided (M = 63.03), Syncro (M = 62.12), and Epoq (M = 60.98) conditions. For the four corners noise condition, results suggested a significant difference for at least one of the three conditions, F(2, 70) = 7.80, p = .001. The focused contrast between aid conditions was significant, F = 17.88, p < .001, suggesting that the HINT scores were progressively better between the unaided (M = 63.49), Syncro (M = 63.01), and Epoq (M = 62.24) conditions. For the eight speakers noise condition, results suggested a significant difference for at least one of the three conditions, F(2, 70) = 4.41, p = .016. The focused contrast between aid conditions was significant, F = 9.95, p = .003, suggesting that the HINT scores were progressively better between the unaided (M = 63.48), Syncro (M = 62.98), and Epoq (M = 62.41) conditions. Figure 6 displays results for each noise condition. Recall that a lower RTS indicates better performance on the HINT.
Figure 6.
Hearing in Noise Test (HINT) results for unaided, Syncro, and Epoq XW
Recall that a lower receptive threshold for sentences (RTS) indicates better performance.
Discussion
The major finding for this study is that speech perception in noise via the Epoq XW was better than either Syncro or unaided. Statistically significant differences were found for every noise condition for both the QuickSIN and HINT. These tests feature a female talker with a background of uncorrelated multitalker babble and a male talker with uncorrelated speech noise, respectively.
The HINT and QuickSIN data are consistent with previous research in terms of the relative differences between the two tests. For example, Wilson, McArdle, and Smith (2007) compared HINT to QuickSIN sentences in male adults with hearing loss by administering the tests as suggested by each test developer. Their results demonstrated a 3.1 to 3.5 difference between the HINT and QuickSIN scores, with the HINT scores having a lower SNR (i.e., better performance). In the present study, the differences in unaided SNR between the HINT and the QuickSIN are 3.03 dB and 3.19 dB for the ±135° azimuth and four corners noise conditions, respectively. The participants in the present study included both men and women, and had better hearing thresholds than the participants in the Wilson et al. (2007) study. In addition, the present study used different noise conditions than those prescribed by the test developers, and used by Wilson et al., including uncorrelated noise from multiple speakers. These differences may account for the better overall test performance of participants in the present investigation when compared with the participants in the Wilson et al. study.
Our understanding of the role of amplification in affecting speech understanding over the past two decades has been influenced heavily by the concepts of the Articulation Index (AI; Fletcher & Galt, 1950; Kryter, 1962), the Speech Transmission Index (STI; Houtgast & Steeneken, 1973; Steeneken & Houtgast, 1980), and the Speech Intelligibility Index (SII; ANSI S3.5 – 1997; American National Standards Institute, 1997). Although primarily designed to predict performance of speech communication systems and synthesized speech, these formulae are also applied in an attempt to predict or model the perception and recognition of speech sounds. It should be stated that none of these indexes were originally designed to predict binaural speech perception or speech perception for individuals with hearing loss. This has not prevented much attention to the idea of applying the AI (Allen, 2005; Killion, 2002; Rankovic, 2002; Souza, Yueh, Sarubbi, & Loovis, 2000; Vickers, Moore, & Baer, 2001) and the SII (Kates & Arehart, 2005; Kringlebotn, 1999; Rhebergen, Versfeld, & Dreschler, 2006) to predict speech understanding in individuals with hearing loss.
Speech understanding is assumed to be predicted by the amount of speech information that is above auditory threshold and the effective masking of the background noise. Although AI-based predictions do not account completely for patient-to-patient differences in absolute speech-in-noise performance, they have been accurate in accounting for relative differences between treatment conditions. In other words, the more speech that is made audible, the better the patient will typically perform.
The importance weightings from the AI and SII approaches indicate that speech information only extends up to 6 kHz. These weightings would suggest that speech understanding should not be affected by extending the bandwidth of a hearing aid beyond 6 kHz. However, more recent acoustical analyses have demonstrated that there is significant speech energy above 6 kHz and that extension of the bandwidth of amplification will result in improved speech understanding performance (Boothroyd & Medwetsky, 1992; Kortekaas & Stelmachowicz, 2000; Lindley, 2009; Stelmachowicz, Lewis, Choi, & Hoover, 2007). Furthermore, speech energy above 8 kHz has been demonstrated to improved localization (Best, Carlile, Craig, & van Schaik, 2005), which is the underlying skill necessary to organize the listening environment.
If the AI and SII approaches accounted for all aspects of speech understanding in noise, then there would not be an expected difference in performance between Syncro and Epoq XW. Although Syncro represented state-of-the-art technology when released in 2004, the continued improvements in hearing aid technology are reflected in the superior performance in noise by Epoq XW in this investigation. The improvements are likely some combination of the improved bandwidth, preservation of interaural intensity differences and a generalized improvement in the digital platform that underlies the Epoq XW product. It should be noted that although the coordinated compression is a major difference between the Syncro and the Epoq, the objective tests in this study were not designed to evaluate this difference.
Speech understanding in complex listening environments, especially in the presence of competing talkers, is more complicated than just a matter of audibility. The binaural auditory system will use subtle monaural high-frequency cues as well as ear-to-ear differences in intensity and time of arrival to organize the sources of sound in the environment. As hearing aid technology continues to evolve, protection or even enhancement of these “newer” sources of information will be more in focus. These are the sort of dimensions that may well allow for continued improvements in performance.
The results of this study clearly demonstrated an improvement of speech understanding in noise on both the QuickSIN and the HINT for the Epoq over the Syncro. However, it should be noted that the reasons for such improvement are less clear, in part due to the limitations in the study design. Based on the study design, it can be assumed that the coordinated processing features had minimal effect on speech perception. Recall that the participants were in a diffuse noise field during the four corners and eight speakers conditions, with the speech stimuli arriving from the front. The level and spectral characteristics of the noise, therefore, would be about the same for both ears. Furthermore, these results may be difficult to explain due to the difference in bandwidth of the devices, specifically because the validated, commercially available materials used as speech stimuli and noise competition do not exceed the bandwidth of speech. It is possible that the improvement in speech understanding was primarily because of the differences in the digital signal processing between the two products. Further research is needed to determine how the different technologies may contribute to the improvement in speech understanding with the Epoq. In addition, as hearing aid technology continues to improve, a need for validated materials has emerged as an area of future research.
Regardless of the actual reason(s) for the differences between the Epoq and the Syncro in this study, it should be noted that these are commercial products and the nature of the hearing aid market is that technologies are bundled. The basic clinical question is whether there is evidence that a new product is better on key performance measures (such as speech understanding in noise) than the older product. These results clearly demonstrated improved speech understanding in noise with the Epoq. Although this study is limited in determining the precise underlying technologies that contributed to this improvement, it does reflect the decision-making approach in the clinic.
Acknowledgments
The authors thank Melanie King and John Govern, PhD, of Towson University for assistance in data collection and statistical analysis, respectively. The authors also thank Yang Liu of Oticon A/S for providing the coupler measures displayed in Figures 3 and 4. In addition, the authors thank the anonymous reviewers for their valuable comments and suggestions on earlier versions of this manuscript.
Authors' Note
Portions of this article were presented orally at AudiologyNOW! 2009, Dallas, TX, in April 2009.
Declaration of Conflicting Interests
The authors declared no conflicts of interest with respect to the research and/or publication of this article. The data were collected and analyzed by the first and second authors, who have no affiliation with the sponsoring agency.
Funding
The authors disclosed receipt of the following financial support for the research and/or authorship of this article:
Oticon A/S
References
- Allen J. B. (2005). Consonant recognition and the articulation index. Journal of the Acoustical Society of America, 117, 2212–2223 [DOI] [PubMed] [Google Scholar]
- American National Standards Institute. (1997). ANSI S3.5–1997, American national standard methods for calculation of the speech intelligibility index. New York: Author [Google Scholar]
- Best V., Carlile S., Craig J., van Schaik A. (2005). The role of high frequencies in speech localization. Journal of the Acoustical Society of America, 118, 353–363 [DOI] [PubMed] [Google Scholar]
- Boothroyd A., Medwetsky L. (1992). Spectral distribution of /s/ and the frequency response of hearing aids. Ear and Hearing, 13, 150–157 [DOI] [PubMed] [Google Scholar]
- Etymotic Research. (2001). QuickSIN: Speech-in-Noise Test (Version 1.3) [Audio CD]. Elk Grove Village, IL: Author [Google Scholar]
- Fletcher H., Galt R. H. (1950). The perception of speech and its relation to telephony. Journal of the Acoustical Society of America, 22, 89–151 [Google Scholar]
- Furr R. M., Rosenthal R. (2003). Repeated-measures contrasts for “multiple-pattern” hypotheses. Psychological Methods, 8, 275–293 [DOI] [PubMed] [Google Scholar]
- Houtgast T., Steeneken H.J.M. (1973). The modulation transfer function in room acoustics as a predictor of speech intelligibility. Acustica, 28, 66–73 [Google Scholar]
- Kates J. M., Arehart K. H. (2005). Coherence and the speech intelligibility index. Journal of the Acoustical Society of America, 117, 2224–2237 [DOI] [PubMed] [Google Scholar]
- Killion M. C. (2002). New thinking on hearing in noise: A generalized articulation index. Seminars in Hearing, 23, 57–75 [Google Scholar]
- Kortekaas R., Stelmachowicz P. (2000). Bandwidth effects on children's perception of the inflectional morpheme /s/: Acoustical measurements, auditory detection, and clarity rating. Journal of Speech, Language, and Hearing Research, 43, 645–660 [DOI] [PubMed] [Google Scholar]
- Kochkin S. (2005). Customer satisfaction with hearing aids in the digital age. Hearing Journal, 58(9), 30–37 [Google Scholar]
- Kringlebotn M. (1999). A graphical method for calculating the speech intelligibility index and measuring hearing disability from audiograms. Scandanavian Audiology, 28, 151–160 [DOI] [PubMed] [Google Scholar]
- Kryter K. D. (1962). Methods for the calculation and use of the articulation index. Journal of the Acoustical Society of America, 34, 1689–1697 [Google Scholar]
- Kuk F., Baekgaard L. (2009). Considerations in fitting hearing aids with extended bandwidths. Hearing Review, 16(11), 32–38 [Google Scholar]
- Meister H., Lausberg I., Kiessling J., Walger M., von Wedel H. (2002). Determining the importance of fundamental hearing aid attributes. Otology & Neurotology, 23, 457–462 [DOI] [PubMed] [Google Scholar]
- Meister H., Lausberg I., Walger M., von Wedel H. (2001). Using conjoint analysis to examine the importance of hearing aid attributes. Ear and Hearing, 22, 142–150 [DOI] [PubMed] [Google Scholar]
- Lindley G. (2009). The impact of an extended bandwidth and binaural compression in pediatric fittings. The Hearing Journal, in press.
- Maico Diagnostics. (2004a). Hearing in Noise Test (Version 2.0) [Audio CD]. Eden Prairie, MN: Author [Google Scholar]
- Maico Diagnostics. (2004b). Operating Instructions HINT Audio CD 2.0. Eden Prairie, MN: Author [Google Scholar]
- Nilsson M., Soli S. D., Sullivan J. (1994). Development of the Hearing in Noise Test for the measurement of speech reception thresholds in quiet and in noise. Journal of the Acoustical Society of America, 95, 1085–1099 [DOI] [PubMed] [Google Scholar]
- Rankovic C. M. (2002). Articulation index predictions for hearing-impaired listeners with and without cochlear dead regions. Journal of the Acoustical Society of America, 111, 2545–2548 [DOI] [PubMed] [Google Scholar]
- Rhebergen K. S., Versfeld N. J., Dreschler W. A. (2006). Extended speech intelligibility index for the prediction of the speech reception threshold in fluctuating noise. Journal of the Acoustical Society of America, 120, 3988–3997 [DOI] [PubMed] [Google Scholar]
- Rosenthal R., Rosnow R. L. (1985). Contrast analysis: Focused comparisons in the analysis of variance. Cambridge, UK: Cambridge University Press [Google Scholar]
- Schum D. J., Bruun Hansen L. (2007). New technology and spatial resolution. Audiology Online. Retrieved February 9, 2010, from http://www.audiologyonline.com/articles/article_detail.asp?wc=1&article_id=1854
- Souza P. E., Yueh B., Sarubbi M., Loovis C. F. (2000). Fitting hearing aids with the articulation index: Impact on hearing aid effectiveness. Journal of Rehabilitation Research and Development, 37, 473–481 [PubMed] [Google Scholar]
- Stelmachowicz P. G., Lewis D. E., Choi S., Hoover B. (2007). Effect of stimulus bandwidth on auditory skills in normal-hearing and hearing-impaired children. Ear and Hearing, 28, 483–494 [DOI] [PMC free article] [PubMed] [Google Scholar]
- Steeneken H.J.M., Houtgast T. (1980). A physical method for measuring speech transmission quality. Journal of the Acoustical Society of America, 67, 318–326 [DOI] [PubMed] [Google Scholar]
- Valente M., Mispagel K. M., Tchorz J., Fabry D. (2006). Effect of type of noise and loudspeaker array on the performance of omnidirectional and directional microphones. Journal of the American Academy of Audiology, 17, 398–412 [DOI] [PubMed] [Google Scholar]
- Vickers D. A., Moore B. C. J., Baer T. (2001). Effects of low-pass filtering on the intelligibility of speech in quiet for people with and without dead regions at high frequencies. Journal of the Acoustical Society of America, 110, 1164–1175 [DOI] [PubMed] [Google Scholar]
- Walden T. C., Walden B. E. (2004). Predicting success with hearing aids in everyday living. Journal of the American Academy of Audiology, 15, 342–352 [DOI] [PubMed] [Google Scholar]
- Wilson R. H., McArdle R. A., Smith S. L. (2007). An evaluation of the BKB-SIN, HINT, QuickSIN, and WIN materials on listeners with normal hearing and listeners with hearing loss. Journal of Speech, Language, and Hearing Research, 50, 844–856 [DOI] [PubMed] [Google Scholar]


