

Abstract
Adaptation is a hallmark of hair cell mechanotransduction, extending the sensory hair bundle dynamic range while providing mechanical filtering of incoming sound. In hair cells responsive to low frequencies, two distinct adaptation mechanisms exist, a fast component of debatable origin and a slow myosin-based component. It is generally believed that Ca2+ entry through mechano-electric transducer channels is required for both forms of adaptation. This study investigates the calcium dependence of adaptation in the mammalian auditory system. Recordings from rat cochlear hair cells, demonstrate that altering Ca2+ entry or internal Ca2+ buffering has little effect on either adaptation kinetics or steady state adaptation responses. Two additional findings include a voltage dependent process and an extracellular Ca2+ binding site both modulating the resting open probability independent of adaptation. These data suggest that slow motor adaptation is negligible in mammalian auditory cells and that the remaining adaptation process is independent of calcium entry.
Introduction
Hair cells are mechanoreceptors of the inner ear, named for the bundle of actin-filled stereocilia on their apical surface (Hudspeth, 2005; Peng et al., 2011). The stereocilia are arranged in a staircase pattern, with thin, filamentous tip-links spanning the distance between adjacent rows, such that deflection of the hair bundle toward its tall edge increases tip-link tension and opens mechanically-gated ion channels (Pickles et al., 1989; Pickles et al., 1984). Mechano-electrical transduction (MET) adaptation presents as a decrease in current during a constant stimulus, where further stimulation recovers the current (Crawford et al., 1989; Eatock et al., 1987). Adaptation is implicated in setting the hair bundle’s dynamic range, providing mechanical tuning, setting the hair cell’s resting potential, providing amplification to an incoming mechanical signal, and providing protection from overstimulation (Eatock et al., 1987; Farris et al., 2006; Fettiplace and Ricci, 2003; Hudspeth, 2008; Johnson et al., 2011; Ricci and Fettiplace, 1997; Ricci et al., 2005).
Fundamental hypotheses regarding hair cell adaptation originated from work in low frequency hair cells contained in the frog saccule, turtle auditory papilla, and mammalian utricle (Assad et al., 1989; Corey and Hudspeth, 1983a; Crawford et al., 1989, 1991; Eatock et al., 1987; Hacohen et al., 1989; Howard and Hudspeth, 1987). Two components of adaptation, termed fast and slow (motor), are distinct in their operating range, kinetics and underlying mechanisms (Wu et al., 1999), but Ca2+ entry via the MET channel drives both processes. To generate fast adaptation, Ca2+ is postulated to interact directly with the channel or through an accessory protein (Cheung and Corey, 2005; Choe et al., 1998; Crawford et al., 1989, 1991; Gillespie and Muller, 2009); however myosin motors Ic, VIIa and XVa have also been implicated in regulating fast adaptation (Kros et al., 2002; Stauffer et al., 2005; Stepanyan and Frolenkov, 2009). A long-standing slow adaptation model posits that movement of myosin isozymes up and down the stereocilia controls the tension sensed by the MET channels in a Ca2+-dependent manner (Assad and Corey, 1992; Assad et al., 1989; Holt et al., 2002; Howard and Hudspeth, 1987).
Recent data questions whether motor adaptation is relevant to mammalian auditory hair cells. Myosin Ic, the presumptive adaptation motor, does not specifically localize to the upper tip link insertion site in mammalian auditory hair cells, and its expression during development does not match the onset of slow adaptation (Schneider et al., 2006; Waguespack et al., 2007). Further, the kinetics of myosin Ic do not fit the requirements of the model in terms of climbing and slipping rates (Pyrpassopoulos et al., 2012). Additionally, MET channels are localized to the tops of stereocilia (Beurg et al., 2009) and not at the upper insertion site where myosin motors are thought to reside; therefore, it is unlikely that Ca2+entering through MET channels is directly responsible for regulating these motors. Finally, with only three rows of stereocilia, as compared to up to ten rows in low frequency hair cells, the ability for Ca2+ to influence adaptation via the upper tip link insertion site even indirectly by diffusion to the upper insertion site of the shorter stereocilia is limited to channels in the third row (Peng et al., 2011). In this study, we directly investigate Ca2+’s role in regulating adaptation in mammalian auditory hair cells.
Results
Diminished slow adaptation in mammalian auditory hair cells
In voltage-clamped hair cells, adaptation manifests itself in two ways, as a time-dependent decrease in current amplitude during mechanical stimulation and as a shift in the peak current-displacement (I-X) plot. We developed piezo-coupled devices that allow stimulation rates up to 30 kHz producing rise times as fast as 11 μs, resulting in very fast adaptation time constants. Clamp speeds averaging 28 μs and output filtering up to 100 kHz also allow for better resolution of adaptation kinetics than previously possible. Here, we used 50 ms step stimulations from -170 nm to 600 nm to measure both fast and slow adaptation processes in rat cochlear outer hair cells (OHCs) (Figure 1A). Current-displacement plots for the peak and steady state responses illustrate the adaptation shift (Figure 1B). Double exponential fits to each MET current response produced time constants ranging between 0.1 and 5 ms for bundle deflections eliciting up to ~75% of the maximal current (Figure 1C,E). Larger stimulations required three time constants (Figure 1C,D) with the third time constant ranging between 8 and 50 ms (Figure 1E). The two faster time constants likely underlie fast adaptation, as the sensitivity, operating range and kinetics are most consistent with previous reports (Kennedy et al., 2003; Ricci et al., 2005; Waguespack et al., 2007). The two time constants likely reflect the faster stimulus rise time rather than the existence of multiple mechanisms, given that the absolute values of these time constants do not change, but rather, the proportion of each varies with stimulus intensity.
Figure 1. A slow adaptation component is not observed in responses to long pulse stimulations.
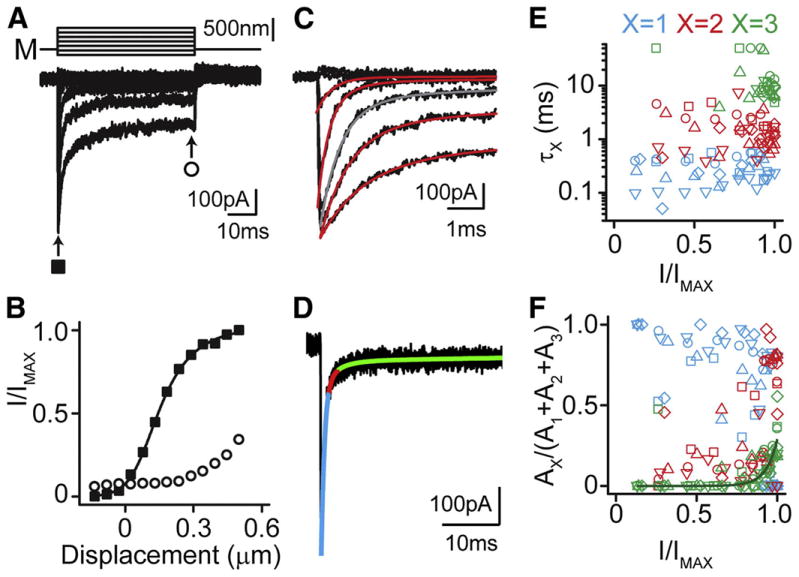
(A) OHC responses to step displacements (M) of 50 ms duration with 1 mM BAPTA in the internal solution. (B) Normalized current displacement plots for peak (solid squares) and steady state (open circles) responses in A. (C) Onset currents from A fit with double and triple exponential decay fits to the currents (red). Gray line indicates the trace shown in D. (D) Triple exponential fit of the response to a large step displacement; coloring indicates the first (blue), second (red), and third (green) temporal components. Note the small magnitude of the third component. (E) First (blue), second (red), and third (green) decay time constants (τx) for individual cells (n=5; each cell has a unique symbol, upright triangles represent data shown in A-D). (F) Relative contributions of each time constant to total adaptation (coloring same as in E). Note that the third time constant (green) appears only at large stimulation magnitudes.
The slowest time constant may represent saturation of fast adaptation or recruitment of a distinct slower process. This mechanism contributes at most 30% of the total adaptation observed at maximal stimulations, with no contribution at stimulation levels eliciting less than 75% of the maximal current (Figure 1F), in agreement with other reports in mammals (Kennedy et al., 2003; Ricci et al., 2005; Waguespack et al., 2007). In contrast, low frequency cells show near 100% motor adaptation contribution for maximal stimulations and 50% motor adaptation with 50% maximum stimulations (Wu et al., 1999). Thus, mammalian data are consistent with the hypothesis that fast adaptation is the predominant mode of adaptation in mammalian auditory hair cells.
Voltage-dependence of adaptation
Depolarization reverses the MET current and eliminates Ca2+ entry into stereocilia, and thus, provides a means to assess whether Ca2+ is driving adaptation (Assad et al., 1989; Crawford et al., 1989). If Ca2+ is required for adaptation, the time dependent adaptation component will be eliminated at positive potentials and the current-displacement plot will shift leftward, so that most channels are activated at rest. These behaviors, observed in low frequency hair cells, are the basis for existing models of adaptation (Assad et al., 1989; Crawford et al., 1989; Pan et al., 2012; Ricci et al., 2000). Here, we performed similar experiments in mammalian auditory hair cells to determine if Ca2+ was required for adaptation.
Figure 2A depicts activation curves generated in both rat OHC and inner hair cells (IHC) at -84 or +76 mV. The currents recorded at depolarized potentials mirror those at hyperpolarized potentials, in stark contrast to observations in low frequency hair cell systems. The current-displacement relationships, fit with the equation for a double Boltzmann function, also changed little upon depolarization (Figure 2B). As discussed below, adaptation kinetics were minimally effected and the change in resting open probability was small. Together, these data suggest that the major component of adaptation in mammalian auditory hair cells does not require Ca2+ entry through MET channels and are consistent with the hypothesis that motor adaptation is absent or limited in mammalian auditory hair cells.
Figure 2. Robust adaptation in the absence of calcium entry.
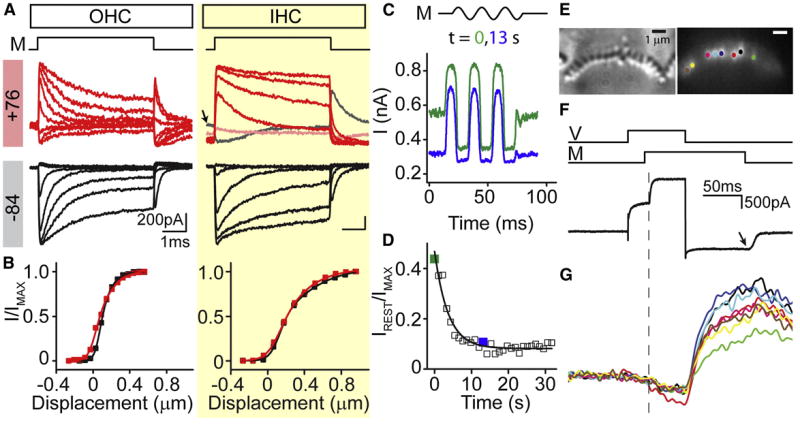
(A) MET activation curves at -84 (black) and +76 mV (red) for an OHC and IHC with 1 mM BAPTA in the internal solution. M illustrates the onset and offset of the bundle displacements. Traces presented at +76 mV are not zeroed to illustrate the shift in the baseline observed IHCs. For the IHC at +76 mV, the initial resting current is high (first step is in gray and highlighted with an arrow) and then decreases (second step is light red and subsequent steps are in dark red). (B) current displacement plots generated from the non-zeroed traces from A (black -84 mV, red +76 mV). (C) A sinusoidal fluid jet stimulus (M) was used to measure the open probability at different time points following depolarization in OHCs with 1 mM BAPTA in the internal solution. Traces are filtered at 2.5 kHz. The green trace depicts a response recorded immediately after depolarization (due to protocol implementation, the first trace may be up to 1-2 s after depolarization) and the blue trace depicts one taken 13 seconds later. (D) Plot of the open probability as a function of time at depolarized potentials. Points corresponding to the traces in C are highlighted. Black line is a single exponential fit to the data with τ = 3.6 s. (E) Swept field confocal Ca2+ imaging. Left panel: IHC stereocilia rows shown in bright-field. Right panel: fluorescent intensity of fluo 4. Colored dots mark active stereocilia at the time point indicated by the arrow in F. (F) Current reponse to depolarization from -84 mV to +76 mV and a fluid jet mechanical stimulus. V and M indicate the onset and offset of the voltage and mechanical stimuli, respectively. (G) Ca2+ fluorescence changes over the stimulus time. Stimuli are depicted in panel F; traces are color-coded to the markings in E. Dashed line in F and G represents time of MET channel opening.
One confounding issue with the depolarization experiments was a slowly shifting resting open probability at positive potentials; as evident in the IHC response depicted in Figure 2A. The IHC resting open probability increased during depolarization, peaking about 500 ms into the stimulus and subsequently decreasing to a baseline over tens of seconds. There was no change in resting open probability at negative potentials. This shift was not as apparent in OHCs, likely because differences in the stimulus protocols. During the OHC recordings, the membrane potential was returned to -84 mV between each mechanical deflection, while IHCs were depolarized for the entire protocol. One possibility for the shift in baseline at positive potentials is that depolarization causes hair bundle movement, and introduces a bias resulting from the position of the stimulating probe to bias the hair bundle. To address this potential artifact, we maximally stimulated freestanding OHC hair bundles with a sinusoidal fluid jet (Figure 2C). The relative difference in resting open probability between a trace taken immediately after depolarization (green) and one taken 13 seconds later (blue) suggests that the shift is biologically driven and not an artifact of coupling to the stimulus probe. The shift recovers while at positive potentials and is unique to mammalian auditory hair cells (Figure 2D), as it does not occur in low frequency hair cells (Ricci et al., 2000).
Potential artifacts
We next sought to rule out any artifacts due to differences in hair bundle shape, electrical properties, or movements of the tissue. In Figure S1, we demonstrate that probe shape and positioning are not responsible for fast adaptation. To remove adaptation at positive potentials required the hair bundle be biased toward the tall edge of the bundle resetting the baseline position such that little adaptation is evident at either positive or negative potentials (see supplemental text and Figure S1).
We next assessed whether Ca2+ still increases in stereocilia even in the face of a reduced driving force. We used confocal Ca2+imaging with Fluo-4 or Fluo-4FF to monitor intra-stereocilia Ca2+ and determine how Ca2+ levels change with depolarization. Depolarization reduced stereociliary Ca2+ (Figure 2E-G) (Beurg et al., 2009), and opening MET channels further reduced the Ca2+ signal (Figure 2G) demonstrating that Ca2+ exited stereocilia. In 11 IHCs cells from rat and mouse, Ca2+ never increased during depolarization. Adaptation remained robust at depolarizations well beyond the Ca2+ reversal potential, further supporting the idea that Ca2+ is not required for adaptation. (Figure S2).
Several mechanical artifacts could potentially lead to an apparent Ca2+-independent adaptation. First, fluid coupling might be responsible for stimulation of the stereocilia prior to the physical contact between probe and hair bundle such that the hair bundle is stimulated by fluid during probe movement but relaxes back onto the probe when the probe stops moving. To test this possibility, we used a stimulus protocol with two displacements, the first step produces an adaptation response that is not complete to ensure that the probe and hair bundle are directly coupled (Figure 3A, red trace). The second stimulus occurs in tandem so that adaptation must be a result of probe hair bundle coupling. If fluid coupling were an issue, adaptation would be seen with the first displacement but not the second. In four OHCs, the stimulus paradigm elicited robust adaptation at +76 mV for both steps, supporting the conclusion that the observed adaptation was not an artifact.
Figure 3. Mechanical artifacts cannot account for time-dependent adaptation.
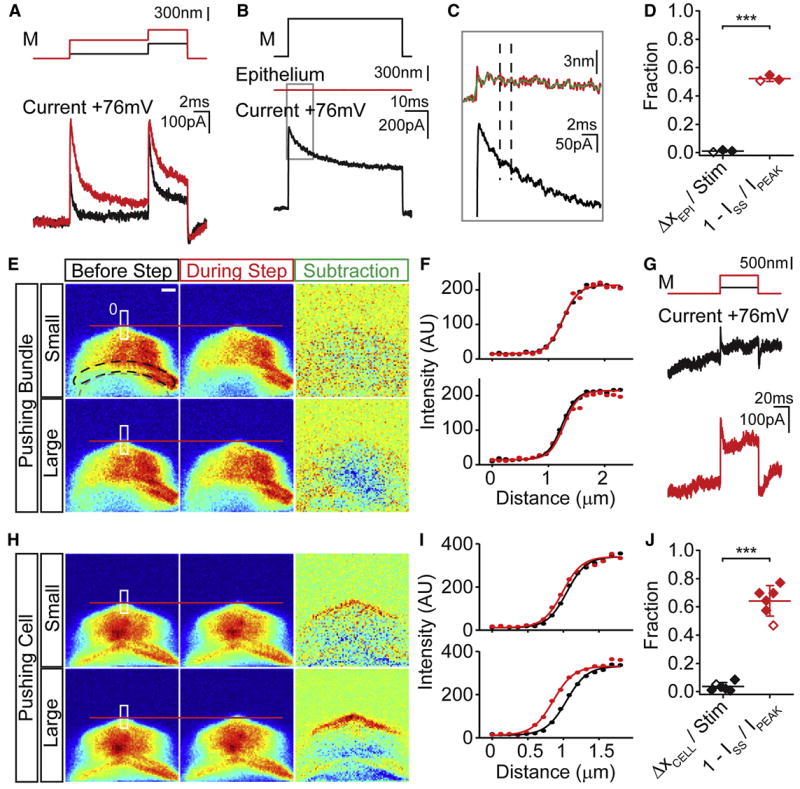
(A) Currents from an OHC in response to a tandem stimulation protocol (M). Time-dependent adaptation at +76 mV was seen for both steps, indicating that fluid coupling was not responsible for the current reduction during the step. (B) Epithelial movement was assessed by monitoring movement of an adjacent IHC bundle (red line) during hair bundle stimulation (M). Response of the stimulated IHC to the stimulation protocol. (C) Enlargement of the boxed region in B. Stimulus-dependent epithelial movement is less than 3 nm. Filtering the movement signal at 1 kHz (green trace) reveals smaller movements correlating with changes in the current trace, demonstrating that detector sensitivity is not an issue. The black dashed lines help to visualize the correlation of the oscillations in both traces. (D) Results summary from 3 IHCs cells showing that the fraction of epithelial movement as compared to the stimulus size (black) cannot account for the observed adaptation (red). (E) High-speed confocal imaging with Alexa 594 filled IHCs was used to visualize hair cell movements. Average images (10 frames) of the apical hair cell surface before and during small and large hair bundle stimulations. Subtraction of before and during step images visualizes the cell movement, the red line references the cell edge. The white box denotes region of intensity profile plots in F with the 0 side marked. All images are pseudo-colored by fluorescence intensity. A schematic of the hair bundle location (black dashed line) and stimulating probe (gray dashed line) are shown. Scale bar = 1.2 μm. (F) Fluorescence intensity plots before (black) and during (red) the hair bundle stimulus are plotted vs their vertical distance for a small (top) and large step (bottom). Boltzmann fits (solid lines) of these profiles determined the sub-pixel movements of the cell. Fit parameters: (top) A = 214, Imax = -198, Z = 7.2, x0Before = 1.26, x0During = 1.26; (bottom) A = 215, Imax = -200, Z = 7.6, x0Before = 1.24, x0During = 1.28 (G) MET current elicited at +76 mV for a small (black) and large (red) hair bundle stimulus presented in E. (H) Positioning the probe to touch the tissue allowed for assessment of detection system. (I) Similar plots as in F for data from H. Fit parameters: (top) A = 340, Imax = -329, Z =7.3, x0Before = 1.05, x0During = 0.99; (bottom) A = 332, Imax = -320, Z = 6.9, x0Before = 1.04, x0During = 0.86 (J) Summary of 6 IHCs showing hair cell movement detected in E and F for the large steps (black) cannot account for the amount of adaptation (red). Graphed lines are the mean ± SD. Example data indicated by open symbols. Mechanical stimuli are above traces (M).
A second potential artifact is indirect reduction of force at the channel due to epithelial movement during the stimulus. To assess epithelial movements, the image of an adjacent hair bundle was projected onto a photodiode motion detector during hair bundle stimulation. In three IHCs tested, movements of less than 3 nm were observed (Figure 3B-D). An enlarged view shows a strong correlation between MET current fluctuations and the filtered diode signal, demonstrating sufficient diode sensitivity for the measurement (Figure 3C). The small movements observed accounted for an adaptive response of less than 2%, while the percent of current adaptation was >50%, therefore epithelial movement cannot account for adaptation at positive potentials (Figure 3D).
A third potential mechanical artifact was movement of the recorded hair cell apical surface within the epithelium during hair bundle deflection. As the photodiode cannot separate probe movement from hair bundle movement in the stimulated hair cell, we used high-speed confocal imaging of dye-filled (Alexa 594) hair cells to identify any movements at the apical surface. Figure 3E-J summarizes these data. Examples of images obtained prior to and during stimulation for large and small movements are presented in Figure 3E,H. In Figure 3E, the probe was placed on the hair bundle and displaced with two step sizes (250 nm and 730 nm), both of which produced adaptation at positive potentials (Figure 3G). Subtraction of the stimulated from the non-stimulated images revealed no movement at the cell body level. To ensure our method is able to detect motion, the probe was placed in contact with the apical surface (Figure 3H). Plotting the fluorescent intensity (demarcated by the boxes in Figure 3E,H) against position (starting at the top of the box) provides a profile where the cell edge is described by the transition from dark to bright. Despite robust MET current adaptation, normal probe positioning elicited only minor apical surface movements. The fraction of adaptation accounted for by cell body movement was 3.4 ± 2.9% while the percent adaptation was 64 ± 11% (n=6). Forcing the probe onto the cell apical surface demonstrated that the system could detect small movements. Both the subtracted data and the intensity profiles detected this motion. Together, these control data support the conclusion that Ca2+ entry or mechanical artifacts do not account for the adaptation responses at positive potentials.
Internal Ca2+ buffering and adaptation kinetics
In low frequency hair cells, elevating Ca2+ buffers slowed adaptation and increased the MET channel resting open probability, supporting the theory that Ca2+ drives adaptation (Crawford et al., 1991; Fettiplace, 1992; Ricci and Fettiplace, 1997; Ricci et al., 1998). Here, we assess how fast and slow buffers (BAPTA vs. EGTA), different buffering capacities (1 or 10 mM BAPTA), and high internal free Ca2+ (1.4 mM) to saturate Ca2+-binding sites impact adaptation in the mammalian cochlea. In Figure 4, we present activation curves obtained at -84 and +76 mV for internal solutions containing 1.4 mM Ca2+ or 10 mM BAPTA (see Figure 2A,B for data with1 mM BAPTA). Adaptation was robust under all conditions tested in both OHCs and IHCs (Figure 4 A-D). Current adaptation models predict that in 1.4 mM Ca2+, where all Ca2+-binding sites are presumably occupied, current-displacement plots would shift rightward with reduced slopes, and activation curves would display no time dependent adaptation (Ricci et al., 1998). With 1.4 mM internal Ca2+, adaptation was robust in both OHCs and IHCs (Figure 4A,C). Time-dependent components of adaptation for both OHCs and IHCs showed no major changes either between internal Ca2+ buffering or with voltage (Figure 4E,F). Only the elevated Ca2+ internal in IHCs showed a slight difference from the EGTA-buffered condition, but not from the BAPTA condition. Together, these data support the contention that Ca2+ is not required for adaptation. These results are in contrast to turtle auditory hair cells, where adaptation time constants varied by about a factor of four when Ca2+ buffering was changed from 1 mM EGTA to 10 mM BAPTA and adaptation was not measurable at positive potentials (Farris et al., 2004; Ricci et al., 1998); the largest variation observed here was about 0.5x. Although we observed no changes in the time constants, we did see a consistent increase in the relative proportion of the slower time constant with Ca2+ buffering and with depolarization (Figure 4G). Likely, this is consistent with previous work suggesting adaptation accelerates in mammalian auditory hair cells with hyper-polarization; the difference here is that using faster rise-times unmasks two phases of adaptation (Kennedy et al., 2003).
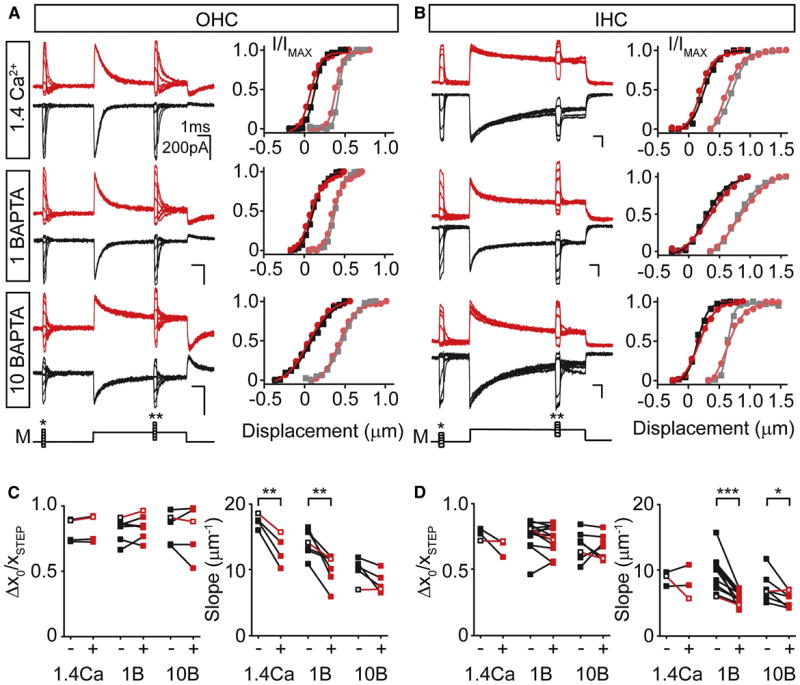
Figure 4. Manipulating intracellular calcium levels has little impact on MET adaptation.
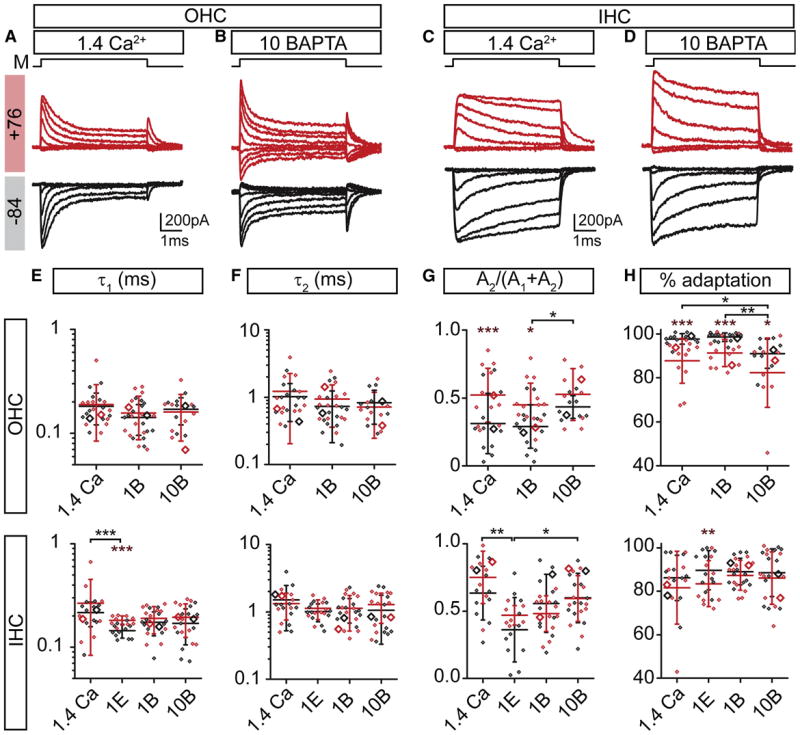
Responses of OHCs (A,B) and IHCs (C,D) to mechanical stimuli (M) with 1.4 mM Ca2+ (A,C) and 10 mM BAPTA (B,D) in the intracellular solution. Throughout the figure, red depicts depolarized (+76 mV) and black depicts hyperpolarized (-84 mV) holding potentials. (E-H) Summary box plots for double exponential decay fit τ1 (E) and τ2 (F), fraction of the 2nd time constant (G), and the percent of adaptation. OHCs (top row) and IHCs (bottom row); data presented as mean values ± SD. Symbols are individual data points; examples from A-D and Figure 2A are highlighted as larger open symbols. Brown asterisks indicate paired comparisons across voltages for a given internal, black asterisks are comparisons across -84 mV. 1.4 Ca, 1E, 1B, and 10B are the 1.4 mM Ca2+, 1 mM EGTA, 1 mM BAPTA, and 10 mM BAPTA internals, respectively.
Depolarization abolishes adaptation in low frequency hair cells, as expected with Ca2+ driving adaptation (Assad et al., 1989; Crawford et al., 1989). In mammalian auditory hair cells, we find that Ca2+ buffering has comparatively small effects on the extent of adaptation at negative potentials (Figure 4H). Depolarization slightly reduced the extent of adaptation independently of Ca2+ buffering. These data suggest a novel voltage dependence of adaptation.
Internal Ca2+ buffering and steady-state adaptation
Adaptation theories and data from low frequency hair cells suggest that, like depolarization, changes in Ca2+ buffering shift the MET set point (x0). In mammalian auditory hair cells, current-displacement plots derived from the mean data to Boltzmann fits showed that internal Ca2+ had limited effect on MET steady-state properties at either positive or negative potentials (Figure 5A). For OHCs, as internal Ca2+ buffering increased, the set point shifted leftward <50 nm, about 1/3 the shift seen in turtle (Ricci and Fettiplace, 1997), and the steepest slope decreased (Figure 5B). Depolarization consistently shifted the set point leftward and reduced the slope for OHCs, but again, these changes were minor compared to turtle data (Ricci and Fettiplace, 1997; Ricci et al., 1998). Effects measured in IHCs were even smaller than in OHCs (Figure 5A,B). Thus, these data further support the conclusion that Ca2+ entry via MET channels is not required for adaptation.
Figure 5. Steady state parameters are largely unchanged with different internal Ca2+ levels.
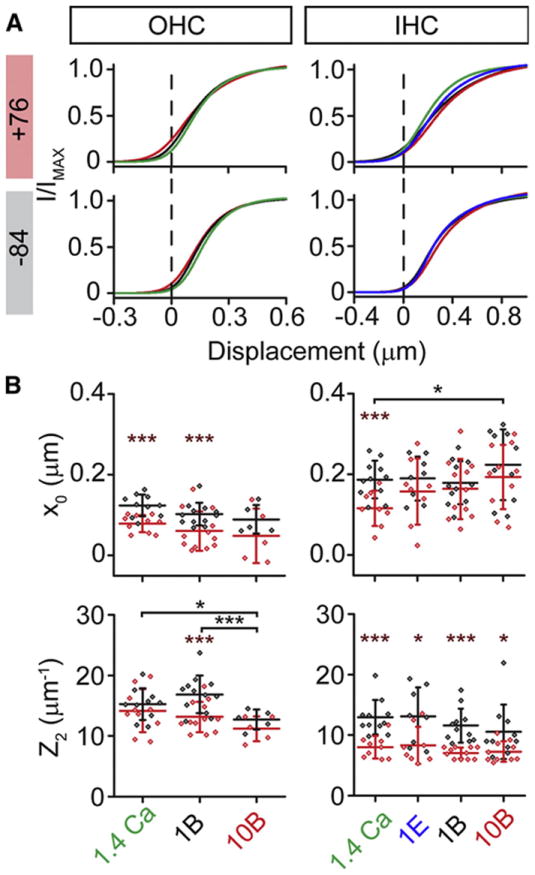
(A) Simulated current displacement plots at +76 mV (top) and -84 mV (bottom) for OHCs and IHCs using average fit parameter values for the double Boltzmann for the different internal buffers. Internal solutions containing 1.4 mM Ca2+, 1 mM EGTA, 1 mM BAPTA, and 10 mM BAPTA are colored green, blue, black, and red, respectively. Differences observed between buffers are minimal. (B) Summary data for the MET set point (x0) and the steepest slope (Z2). Brown asterisks indicate paired comparisons across voltages for a given internal, black asterisks are comparisons across -84 mV. Data is presented as mean ± SD.
The effects of depolarization were comparable across internal Ca2+ conditions, suggesting the effects on both set point and slope were voltage- and not Ca2+-driven. The reduced slope likely accounts for the apparent reduction in percent adaptation observed at positive potentials (Figure 4H), where the same shift in displacement results in a smaller change in open probability. The change in resting open probability during depolarization was more variable and complex (Figure S3). The slow transient change in resting open probability (Figure 2C,D) made quantifying an adaptation driven component more tenuous. In all cases, depolarization increased resting open probability (Figure S3C); for OHCs, the increase appeared greater in highly buffered conditions, while there was no trend for IHCs. Regardless of condition or measurement time, in mammalian auditory hair cells the magnitude of the change in resting open probability was much less than low frequency hair cells in response to depolarization, once again suggesting limited Ca2+ dependence.
We considered the possibility that sequestration or extrusion prevented the 1.4 mM Ca2+ introduced through the patch pipette from reaching the stereocilia. This is unlikely, given the enormous volume difference between the pipette and the cell, as well as the ease with which dyes reach the tips of the stereocilia (Pan et al., 2012; Ricci and Fettiplace, 1998). Additionally, rectification of the MET current-voltage response relationship has been observed when block of the MET channel by Ca2+ is relieved, (Pan et al., 2012). Here, we compared peak MET currents at -84 or +76 mV in different internal solutions and found statistically lower values in 1.4 mM Ca2+, supporting the argument that Ca2+ is indeed elevated in stereocilia and blocks channel permeation from the inside (Figure S4).
Shifts in the MET current-displacement relationship
Steady-state shifts in MET current-displacement relationships in response to a submaximal prepulse define adaptation. In rat cochlear hair cells, paired stimulations reveal shifts in the current displacement plot following an adaptive pre-step (Figure 6A,B) (Crawford et al., 1989; Eatock et al., 1987; Vollrath and Eatock, 2003). If Ca2+ drives adaptation, then shifts will be absent upon depolarization to +76 mV. Comparisons across Ca2+ buffers and membrane potentials (Figure 6A, B) demonstrate that neither manipulation prevents shifts in the current-displacement relationship. Shifts, quantified as the fraction of the adapting step size, were comparable for all internal Ca2+ buffers regardless of membrane potentials (Figure 6C,D)., and there was no statistically significant difference between the shifts at -84 mV and those at +76 mV. There was a slight decrease in slope with voltage, similar to results from previous experiments (Figure 6C,D; see Figure 5B). Internal Ca2+ levels and depolarization had no effect on the relative adaptive shift, supporting both the kinetic and steady state results above. Thus, we again conclude adaptation has little Ca2+ dependence, and these data further support the idea that slow adaptation relying on myosin motors, as described in low frequency hair cells, has little, if any, role in the adaptation process in mammalian auditory hair cells.
Figure 6. Adaptive shifts during paired pulse protocols persist in the absence of calcium.
MET currents from OHCs (A) and IHCs (B) in response to paired pulse stimulation (M) elicited an adaptive shift in the current displacement relationship at both -84 (black traces) and +76 mV (red traces). The dark and light symbols represent the current displacement plots generated before (* in M trace) and after (** in M trace) the adaptive step, respectively. Solid lines are single Boltzmann fits to the data. In OHCs (C) and IHCs (D), adaptive shifts elicited at -84 (black symbols) or +76 mV (red symbols) were calculated by taking the change in the x0 of the Boltzmann fits (Δx0) and normalizing to the adapting step size (xSTEP). No significant difference in shift was observed for either IHCs or OHCs. The slopes for I-X plot Boltzmann fits before the adapting step are plotted for each internal at -84 (black symbols) and +76 mV (red symbols). Open symbols with red connecting line highlight example traces in A,B.
External Ca2+ Effects
In low frequency hair cells, lowering external Ca2+ slows or eliminates adaptation (Crawford et al., 1991; Eatock et al., 1987; Hacohen et al., 1989; Ricci and Fettiplace, 1997, 1998) and produces a leftward shift in the current displacement plot, resulting in a large resting open probability (Crawford et al., 1991; Farris et al., 2006; Johnson et al., 2011; Ricci et al., 1998). Increasing internal Ca2+ buffering amplifies these effects, consistent with Ca2+ entry driving adaptation in these systems (Crawford et al., 1989, 1991; Hacohen et al., 1989; Hudspeth and Gillespie, 1994; Ricci and Fettiplace, 1997; Ricci et al., 1998). Here, we used either apical perfusion or a local pipette to apply a 20 μM Ca2+ solution onto the hair bundle of rat OHCs and observed an increase in the peak current amplitude due to removal of a Ca2+ block of the channel (Figure 7A) (Pan et al., 2012; Ricci and Fettiplace, 1998). We consistently found a large change in the resting open probability, as previously described (Fig 7A,B) (Beurg et al., 2010; Beurg et al., 2008). In contrast to previous data from low frequency hair cells (Ricci and Fettiplace, 1997; Ricci et al., 1998), the shift observed in resting open probability was unaffected by intracellular Ca2+ buffering. With no correction for baseline changes, our current-displacement plots underestimate the actual baseline shift, but nonetheless, reveal a large leftward shift (Fig 7B). Additionally, unlike in low frequency cells, lowering external Ca2+ did not slow the adaptation time constants in OHCs; rather, the proportion of the slower time constant was increased (Fig 7C). Due to the difficulty of pulling the hair bundle with our stiff probe, we used the permeable blocker dihydrostreptomycin (DHS) to provide a better estimate of resting open probability by blocking the MET current in lowered external Ca2+ (Figure 7D,E). These results confirmed that large shifts in the resting open probability were independent of internal Ca2+ buffering. Taken together, these data suggest that external Ca2+ regulation of MET resting open probability is independent of adaptation and intracellular Ca2+ levels and is mediated by an external Ca2+ site.
Figure 7. External Ca2+ effects on adaptation are independent of internal buffering conditions.
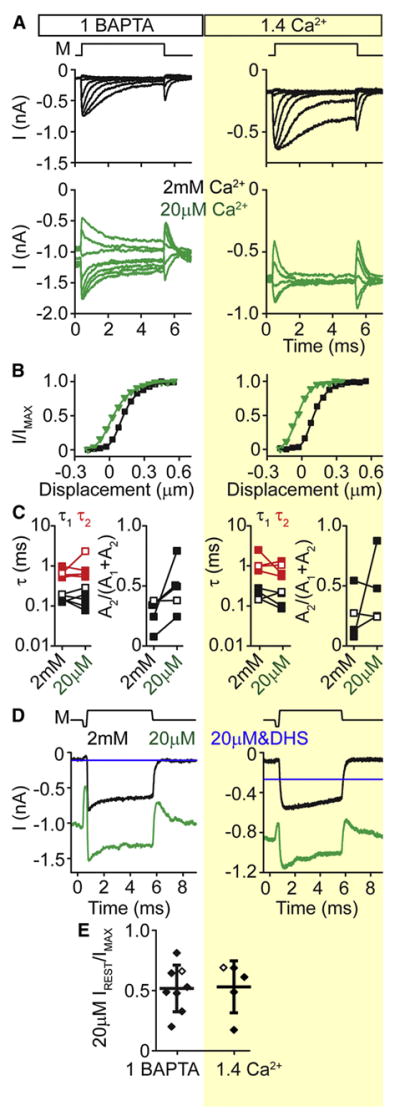
(A) Activation curves for OHCs with 1 mM BAPTA or 1.4 mM Ca2+ internal solution and 2 mM (black traces) or 20 μM (green traces) external Ca2+. 20 μM external Ca2+ was perfused using a Picospritzer III near the hair bundle. Holding potential is -84 mV; M represents the stimulus onset and offset. (B) I-X plots for the mechanically sensitive portion of the currents in A. (C) Double exponential decay time constants τ1 (black) and τ2 (red) and fraction of the second decay constant for cells in 1 mM BAPTA (n = 5) and 1.4 mM Ca2+ (n = 4) exposed to either 2 mM or 20 μM external Ca2+. (D) In OHCs, maximal currents were elicited with a stiff probe while apical solutions were varied: 2 mM Ca2+ (black), 20 μM Ca2+ (green), 20 μM Ca2+ with 200 μM DHS (blue). DHS was used to reveal the baseline current in this solution, which is presumed to be the non-MET current present in low Ca2+. (E) Summary from experiments in D showing that both internal buffer conditions significantly shift the MET open probability. Examples from D are highlighted with open symbols. Mechanical stimulus (M) shown above A,D.
Discussion
Long-standing theories, largely based on data obtained from turtle, frog and mammalian vestibular hair cells, posit that Ca2+ entry through MET channels is required for adaptation (Corey and Hudspeth, 1983b; Crawford et al., 1991; Eatock et al., 1987; Peng et al., 2011; Ricci et al., 1998). Subsequent experiments identified two components of adaptation (Vollrath and Eatock, 2003; Wu et al., 1999), each driven by Ca2+ entry, a fast component, where multiple mechanisms have been proposed (Bozovic and Hudspeth, 2003; Cheung and Corey, 2005; Choe et al., 1998; Crawford et al., 1991; Stauffer et al., 2005) and a slower (motor) component, controlled by myosin isozymes (Gillespie and Cyr, 2004). Initial work from mammalian auditory hair cells suggested adaptation was faster but largely similar to that reported in other hair cell types, and mechanisms of mammalian auditory adaptation have remained largely unexplored (Kennedy et al., 2003). Our data challenge these views of adaptation by demonstrating that Ca2+ entry does not drive adaptation in mammalian auditory hair cells and that motor adaptation as described in other hair cell types has at best a limited role. We also reveal a voltage-dependent effect on resting MET channel open probability and an extracellular Ca2+ binding site that modulates the resting MET channel open probability, neither of which involve adaptation.
Adaptation is not calcium dependent
After perturbing intracellular Ca2+ levels in three distinct ways, we found no evidence to support the hypothesis that Ca2+ entry was required to trigger adaptation. First, we depolarized the cells to reverse the Ca2+ driving force and prevent its entry into the hair cell. Second, internal Ca2+ homeostasis was altered by increasing the Ca2+ buffering capacity with BAPTA (up to 10 mM) or by saturating Ca2+ binding sites with 1.4 mM free internal Ca2+. Third, we lowered external Ca2+ concentrations to reduce Ca2+ entry via MET channels. None of these manipulations altered adaptation in a way that is consistent with the idea that Ca2+ drives this process, leading us to conclude that Ca2+ entry via MET channels does not drive adaptation in mammalian auditory hair cells.
Comparisons to mammalian data
Previous data from mammalian auditory hair cells support our claim that time constants are invariant with different intracellular Ca2+ buffers (Beurg et al., 2010). We report two time constants for fast adaptation, where the contribution of each varied with depolarization and with external Ca2+. This finding is consistent with previous studies that showed single time constant fits slowing with lowered external Ca2+ (Beurg et al., 2010; Johnson et al., 2011). However, the change in resting open probability with lowered external Ca2+, varied depending on intracellular Ca2+ buffering (Beurg et al., 2010; Johnson et al., 2011). We similarly observed a change in resting open probability with lowered external Ca2+; however, our data suggest this change is independent of intracellular Ca2+ load, likely due to an extracellular site being sensitive to Ca2+.
Comparisons to low frequency hair cells
Are these data different from those of low frequency hair cells? Due to many of the technical advances over the past years, comparisons are difficult. Formative data were obtained from enzymatically dissociated hair cells that had 10-20% of the maximal currents recently reported (Assad et al., 1989; Crawford et al., 1989, 1991). Changes induced by altering Ca2+ buffering or external Ca2+ concentrations are diminished by larger MET currents; therefore, differences in current magnitude confound quantitative comparisons (Kennedy et al., 2003; Ricci and Fettiplace, 1997; Ricci et al., 1998). Furthermore, probes are much faster and adaptation varies with stimulus rise times (Wu et al., 1999). Additionally, much of the original data came from epithelial preparations that were not voltage clamped, nor were hair bundles directly stimulated so there is no way to quantitatively compare results (Corey and Hudspeth, 1983a, b). Finally, many experiments reported here have not been performed in low frequency hair cells, so direct comparisons are not possible.
Despite these limitations, there are clear differences between mammalian auditory hair cells and low frequency cells. Adaptation is faster, and the slowest (potentially motor) component is either nonexistent or shifted in dynamic range to where stimuli greater than 75% of the maximum are required for induction (Figure 8A). Depolarization does not shift the current displacement plot in mammalian auditory hair cells as it does in low frequency hair cells (Figure 8B), and Ca2+ does not drive the major component of adaptation in mammalian auditory hair cells.
Figure 8. Schematic comparing low frequency hair cells and mammalian auditory hair cells.
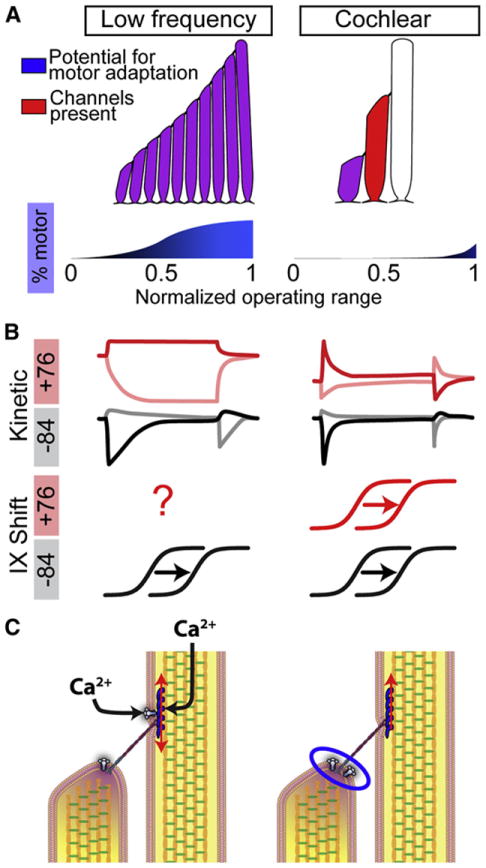
(A) A mammalian auditory hair bundle and low frequency hair cell bundle are illustrated, depicting the potential functional rows of stereocilia (red) and the stereocilia rows that are potentially able to adapt by motor adaptation (blue). The limited potential for motor adaptation in mammalian auditory hair bundles corresponds with the much smaller percentage of motor adaptation in mammalian auditory hair bundles, which appears only at a the high extreme of the operating range (see blue plot below hair bundles). Note that this depiction assumes that previous data in low frequency hair cells is correct for low frequency cells, and it is possible that the contribution of motor adaptation in these cells has been overestimated. (B) Schematic of the kinetic differences between MET currents in low frequency hair cells and mammalian auditory hair cells. Light traces are deflection away from the tallest row of stereocilia and dark traces are deflection toward the tallest row. Two pulse I-X plot shifts occur at both positive and negative potentials for mammalian auditory hair cells, but remain to be tested at positive potentials for low frequency hair cells. (C) Summary of potential differences in adaptation mechanisms between low frequency and mammalian auditory hair cells. Low frequency hair cells are thought to have channels present at both ends of the tip-link and a Ca2+-dependent tension-release mechanism. Mammalian auditory hair cells have only a constant tensioning mechanism at the upper-insertion point and the adaptation mechanism likely occurring at the lower-insertion point (blue oval).
Reconciling data between species, a new hypothesis
Our data can be reconciled with low frequency hair cell data simply by diminishing or removing motor adaptation, which would unmask the true properties of fast adaptation. We hypothesize that fast adaptation is not Ca2+ dependent and that previous interpretations, confounded by effects of the slow motor process, were misinterpreted. We further hypothesize that by reducing or removing the slow component of adaptation, mechanotransduction operates at higher frequencies. Rather than a situation where tip links in various states of climbing and slipping would lead to slow activation and adaptation rates, as proposed for motor-based adaptation, maintaining tip links under a standing tension by having them less responsive to Ca2+ entry will maximize the frequency response of the system (Figure 8C). Data from low frequency hair cells suggest that all stereocilia rows have functional MET channels (Denk et al., 1995), and thus the potential for motor adaptation, Figure 8A. However, mammalian auditory hair cells have only 3 rows of stereocilia with functional channels in the shorter two rows (Beurg et al., 2009), leaving only a single row with the potential for motor adaptation (Figure 8A)(Peng et al., 2011). It has been proposed that substitution of myosin VIIa for myosin Ic could alter the Ca2+ sensitivity of the upper insertion site (Grati et al., 2012). The lack of concentrated myosin Ic localization to the upper insertion site, coupled with the developmental mismatch between adaptation maturation and the appearance of myosin Ic in the cochlea, support this possibility (Schneider et al., 2006; Waguespack et al., 2007). Finally, removal of Ca2+ dependence also removes the likely rate-limiting step of Ca2+ clearance, again ensuring high-frequency fidelity. We posit that a standing tension is required, however, this tension is not Ca2+-dependent, either because Ca2+ is not changing at this site or because the molecular components differ in mammalian auditory hair cells (Figure 8C). This tensioning mechanism is separate from adaptation in these cells.
Control of resting probability of opening, not just adaptation
Another finding from this work is that the resting open probability is not simply a function of adaptation. Previous theories suggested that a feedback existed between the channel passing Ca2+ and the tension regulation by adaptation of the tip link such that the channel resting open probability was a direct result of adaptation (Assad and Corey, 1992; Howard and Hudspeth, 1987). Here, we find that extracellular Ca2+ has dramatic effects on the resting open probability in an adaptation-independent manner. Two obvious sources of this effect are the tip-link protein, where Ca2+ binding sites exist, and the lipid bilayer, where a charge-screening type of effect might alter the translation of mechanical force. Whatever this mechanism turns out to be, it is important physiologically, as it conveys sensitivity to external Ca2+ levels found in the mammalian auditory system (Johnson et al., 2011). Additionally, we found that upon depolarization, a transient change in MET open probability occurs that is independent of adaptation. Assuming that this reflects a change in force sensed by the MET channel, we suggest some possible mechanisms: charged proteins in series with force generation, hydrodynamic changes altering lipid tension, or intrinsic channel properties. Each possibility warrants further investigation. Additionally, whether these phenomena exist in low frequency hair cells warrants further investigation.
Potential mechanisms of adaptation
What might be responsible for adaptation? Assuming the channel simply responds to force exerted upon it, then adaptation is the result of a reduced force during the stimulation. Much as originally described, it is possible that a viscoelastic element in series with the MET channel can account for adaptation (Howard and Hudspeth, 1987). The viscoelastic element may be part of the lipid membrane, the tip link, some cytoskeleton to membrane network, or even intrinsic to the channel (Figure 8C). Data presented herein cannot delineate between these possibilities, but each is viable and has precedence. For example, hair cell lipid effects are known and modeled (Breneman et al., 2009; Hirono et al., 2004; Powers et al., 2012). Other mechanosensitive channels such as TREK channels, bacterial mechanosensitive channels, osmotically activated channels, and C. elegans mechanosensory channels sense the lipid environment (Chemin et al., 2005; Cueva et al., 2007; Martinac et al., 1990; Patel et al., 2001; Sachs, 2010; Sachs and Morris, 1998; Sukharev and Sachs, 2012; Sukharev et al., 1997; Yoshimura et al., 2001). The recently described Piezo class of mechanoreceptors has intrinsically driven adaptive properties (Coste et al., 2010). If the hair cell MET channel responds simply to membrane stretch, than mechanisms similar to those described in these other mechanosensitive systems may be relevant.
In summary, we demonstrate that mammalian auditory hair cell MET adaptation does not depend on Ca2+ entry, forcing a reconsideration of current views on hair cell adaptation, at least in terms of the mammalian auditory system. Additionally, we have uncovered an extracellular Ca2+ effect and a voltage-dependent effect on MET channel open probability, adding to our knowledge of the precise control of the hair cell mechanotransduction apparatus.
Methods
Preparation and recordings
Animals were euthanized by decapitation using methods approved by the Stanford University Administrative Panel on Laboratory Animal Care. Organs of Corti were dissected from postnatal day (P) 6-10 Sprague-Dawley rats and placed in recording chambers as previously described (Beurg et al., 2009). Tissue was viewed using a 60x (1.0 NA, Olympus) water-immersion objective through a 1-4x magnifier onto a digital Rolera XR (Qimaging) or analog OLY-150 (Olympus) camera on a BX51 microscope (Olympus). Tissue was dissected and perfused at rates of 0.35-0.5 ml/min with external solution containing (in mM): 140 NaCl, 2 KCl, 2 CaCl2, 2 MgCl2, 10 HEPES, pH=7.4, 300-310mOsm. In addition, an apical perfusion protected the hair bundles from internal solution with rates of 0.07-0.1 ml/min using pipettes with tip sizes 40-200 μm. In all preparations, the tectorial membrane was peeled off the tissue.
Electrophysiological recordings
Experiments occurred on multiple recording stations with comparable capabilities but often-different specific equipment, attesting to the robustness of the data. Whole-cell patch-clamp was achieved on IHCs or first or second row OHCs from middle to apical cochlea turns using an Axon 200A or 200B amplifier (Molecular Devices) with thick-walled borosilicate patch pipettes (< 4 MΩ) filled with an intracellular solution containing (in mM): 125 CsCl, 3.5 MgCl2, 5 ATP, 5 Creatine Phosphate, 10 HEPES, 1 Cesium BAPTA, 3 ascorbate, pH=7.2, 280-290 mOsm. For the 10 mM BAPTA solution, removal of an equivalent osmolality of CsCl offset the increased BAPTA concentration. For the EGTA internal (in mM), 1 EGTA replaced cesium BAPTA and ascorbate increased to 4 mM. For Ca2+ imaging, 1 mM Fluo-4 or Fluo-4FF (Invitrogen) and 0.05 mM Alexa 594 hydrazide (Invitrogen) were added to the EGTA internal. 1.4 Ca2+ internal contained (in mM): 121 CsCl, 3.5 MgCl2, 3.5 CaCl2, 3.5 ATP, 5 Creatine Phosphate, 10 HEPES, 2 ascorbate, pH=7.2, 280-290 mOsm. For the 1.4 mM Ca2+ internal, free Ca2+ concentration was measured using a MI-600 Ca2+ electrode (Microelectrodes Inc.) calibrated using Ca2+ buffer standards (CALBUF-2, WPI) and found to be 1.4 mM free Ca2+. Experiments were performed at 18-22°C. Whole cell currents were filtered at 50-100 kHz and sampled at 1 MHz using USB-6356 (National Instruments) or Personal DAQ3000 (Iotech) controlled by jClamp (SciSoft Company). Traces were filtered offline at 30 kHz using Origin 8.6 (OriginLab). Voltages were corrected offline for liquid junction potentials. For inclusion, initial MET currents greater than 600 pA in 2 mM external Ca2+ and Mg2+ were required. For a sample of 80 cells recorded, the clamp speed was 28 ± 6 μs with series resistance compensation, whole cell capacitance was 11 ± 1 pF and leak currents at -84 mV holding potential was -65 ± 40 pA.
Hair bundle stimulation
Borosilicate pipettes were fire polished to shapes that matched the hair bundle structures for IHCs and OHCs. Probes were driven by a piezoelectric stack (AE0505D08F-Thorlabs or PSt 150/7×7/7-APC International Ltd.) whose input was filtered using an 8-pole Bessel filter (L8L 90PF, Frequency Devices Inc.) at 15-30 kHz or using an 8-pole Bessel filter (FLA-01 Cygnus Technology, Inc.) at 10 kHz and variably attenuated (PA5, Tucker Davis; software based with jClamp) before being sent to a high voltage/high current amplifier to drive the piezoelectric stack. In some experiments a fluid jet was used for the stimulus (HSPC-1, ALA Scientific Instruments) driven with a 50 Hz sine wave. Silicon probes, manufactured to fit the shape of the hair bundle, had a cantilever thickness of 1-2 μm. The silicon devices were mounted to a macro-scale piezoelectric stack (AE0505D08F-Thorlabs) via an aluminum holder.
Low Ca2+ and DHS
N-(hydroxyethyl)-ethylenediaminetriacetic acid (HEDTA) buffered, solution contained (in mM): 150 NaCl, 2 KCl, 3.3 CaCl2, 4 HEDTA, 10 HEPES, pH = 7.4, 310 mOsm. Free Ca2+ concentrations were measured at 20 μM as described above. DHS (Sigma) was prepared from a 50 mM stock in external solution. Solutions were applied at the apical side of the hair cell using variably positioned glass pipettes with ~7 μm tip pressure controlled with a Picospritzer III (Parker Hannafin Corp). In some experiments an apical perfusion pipette was used for low Ca2+ application with or without 0.2 mM DHS via a 6-inlet manifold (Warner Instruments) as described previously (Ricci and Fettiplace, 1997).
Ca2+ imaging
Organs of Corti from Sprague-Dawley rats and C57/BL6 mice, ages P7-P10 were harvested. High-speed swept field confocal Ca2+ imaging (Prairie Technologies) (Beurg et al, 2009) used a 35 μm slit at 500 frames/second where the Ca2+ indicator was excited using 488 nm laser and Alexa 594 was excited using 594 nm laser. Hair bundles were stimulated using a Picospritzer III. Data were collected and analyzed using Neuroplex (Redshirt imaging). For imaging cell movement, IHCs recordings using a Cs BAPTA internal with 0.2 mM Alexa 594 were imaged, while hair bundles and cells were stimulated with a stiff glass stylus. Data were analyzed in MATLAB (MathWorks) by averaging ten frames before and after the stimulus; then 3 or 5 horizontal pixels were averaged together in the selected region of interest. These averages plotted against the vertical position were fit with a single Boltzmann equation:
| (1) |
where A is an offset, Z is the slope and x0 is the operating point. Fits for each imaging trial were constrained to have the same A, Imax, and Z values. The operating points were used to calculate the movement of the cell.
Photodiode motion recording
A dual photodiode detector (SPOT-3D, OSI Optoelectronics) with a custom differential amplifier circuit monitored the hair bundle motion at 600x magnification. Hair bundle motions were calibrated by moving the detector across the hair bundle with a precision motor actuator (LTA-HS, Newport Corp) driving a linear stage (436, Newport Corp). Photodiode signal was filtered offline at 5 kHz using Origin 8.6.
Data analysis
IX plots, generated by subtracting leak current and normalizing to the peak current, were fit with single Boltzmann functions (equation 1) obtained from paired pulse experiments and relative shifts calculated from the change in x0 normalized to the adapting step size. Single Boltzmanns were used here so that x0 corresponded to the half activation.
IX plots at -84 mV and +76 mV for different internal and external Ca2+ conditions were generated as above, but fit to a double Boltzmann equation as:
| (2) |
where Z1 and Z2 are the slope factors and x0 represents the operating point. Throughout the manuscript Z2 is presented as the slope. IX plots were generated for +76 mV potentials by zeroing the MET traces prior to mechanical stimulus onset except when noted. For steps, adaptation time constant fits were obtained at ~50% peak current using a double exponential decay:
| (3) |
where τ1 and τ2 are the reported decay constants and A1 and A2 are the amplitudes of respective decay components. Where needed adaptation time constants were fit with a triple exponential decay:
| (4) |
where τ1, τ2, and τ3 are the reported decay constants and A1, A2, and A3 are the amplitudes of respective decay components. τ3 values were limited to a maximum of 50 ms. Percent adaptation was calculated as (1- Isteady state / Ipeak) * 100.
Data were analyzed using jClamp and graphs created using Origin 8.6 and Adobe Illustrator. Statistical analysis used student two-tailed t-tests with Excel (Microsoft). All p values presented used paired t-tests with comparisons within a cell, and unpaired unequal variance tests across cell conditions. Significance (p-values) are as follows, * p<0.05, ** p<0.01, *** p<0.005. Data are presented as mean ± standard deviation.
Supplementary Material
Highlights.
Mechanotransduction adaptation does not require calcium
Calcium alters mechanotransduction via an external site
Voltage alters mechanotransduction channel resting open probability
Acknowledgments
Work was supported by NRSA F32 DC109752 and K99 DC013299 to AWP, by DAAD (German academic exchange service) to TE, and by RO1 DC003896 from NIDCD to AJR as well as core grant P30-44992. The authors are grateful to Benjamin Chui, who helped with the design and fabrication of silicon devices. Thanks to Gregory Frolenkov for use of his pressure clamp system.
References
- Assad JA, Corey DP. An active motor model for adaptation by vertebrate hair cells. The Journal of neuroscience : the official journal of the Society for Neuroscience. 1992;12:3291–3309. doi: 10.1523/JNEUROSCI.12-09-03291.1992. [DOI] [PMC free article] [PubMed] [Google Scholar]
- Assad JA, Hacohen N, Corey DP. Voltage dependence of adaptation and active bundle movement in bullfrog saccular hair cells. Proceedings of the National Academy of Sciences of the United States of America. 1989;86:2918–2922. doi: 10.1073/pnas.86.8.2918. [DOI] [PMC free article] [PubMed] [Google Scholar]
- Beurg M, Fettiplace R, Nam JH, Ricci AJ. Localization of inner hair cell mechanotransducer channels using high-speed calcium imaging. Nat Neurosci. 2009;12:553–558. doi: 10.1038/nn.2295. [DOI] [PMC free article] [PubMed] [Google Scholar]
- Beurg M, Nam JH, Chen Q, Fettiplace R. Calcium balance and mechanotransduction in rat cochlear hair cells. J Neurophysiol. 2010;104:18–34. doi: 10.1152/jn.00019.2010. [DOI] [PMC free article] [PubMed] [Google Scholar]
- Beurg M, Nam JH, Crawford A, Fettiplace R. The actions of calcium on hair bundle mechanics in mammalian cochlear hair cells. Biophysical journal. 2008;94:2639–2653. doi: 10.1529/biophysj.107.123257. [DOI] [PMC free article] [PubMed] [Google Scholar]
- Bozovic D, Hudspeth AJ. Hair-bundle movements elicited by transepithelial electrical stimulation of hair cells in the sacculus of the bullfrog. Proceedings of the National Academy of Sciences of the United States of America. 2003;100:958–963. doi: 10.1073/pnas.0337433100. [DOI] [PMC free article] [PubMed] [Google Scholar]
- Breneman KD, Brownell WE, Rabbitt RD. Hair cell bundles: flexoelectric motors of the inner ear. PLoS One. 2009;4:e5201. doi: 10.1371/journal.pone.0005201. [DOI] [PMC free article] [PubMed] [Google Scholar]
- Chemin J, Patel AJ, Duprat F, Lauritzen I, Lazdunski M, Honore E. A phospholipid sensor controls mechanogating of the K+ channel TREK-1. Embo J. 2005;24:44–53. doi: 10.1038/sj.emboj.7600494. [DOI] [PMC free article] [PubMed] [Google Scholar]
- Cheung EL, Corey DP. Ca2+ Changes the Force Sensitivity of the Hair-Cell Transduction Channel. Biophysical journal. 2005;90:124–139. doi: 10.1529/biophysj.105.061226. [DOI] [PMC free article] [PubMed] [Google Scholar]
- Choe Y, Magnasco MO, Hudspeth AJ. A model for amplification of hair-bundle motion by cyclical binding of Ca2+ to mechanoelectrical-transduction channels. Proceedings of the National Academy of Sciences of the United States of America. 1998;95:15321–15326. doi: 10.1073/pnas.95.26.15321. [DOI] [PMC free article] [PubMed] [Google Scholar]
- Corey DP, Hudspeth AJ. Analysis of the microphonic potential of the bullfrog’s sacculus. The Journal of neuroscience : the official journal of the Society for Neuroscience. 1983a;3:942–961. doi: 10.1523/JNEUROSCI.03-05-00942.1983. [DOI] [PMC free article] [PubMed] [Google Scholar]
- Corey DP, Hudspeth AJ. Kinetics of the receptor current in bullfrog saccular hair cells. The Journal of neuroscience : the official journal of the Society for Neuroscience. 1983b;3:962–976. doi: 10.1523/JNEUROSCI.03-05-00962.1983. [DOI] [PMC free article] [PubMed] [Google Scholar]
- Coste B, Mathur J, Schmidt M, Earley TJ, Ranade S, Petrus MJ, Dubin AE, Patapoutian A. Piezo1 and Piezo2 are essential components of distinct mechanically activated cation channels. Science. 2010;330:55–60. doi: 10.1126/science.1193270. [DOI] [PMC free article] [PubMed] [Google Scholar]
- Crawford AC, Evans MG, Fettiplace R. Activation and adaptation of transducer currents in turtle hair cells. J Physiol (Lond) 1989;419:405–434. doi: 10.1113/jphysiol.1989.sp017878. [DOI] [PMC free article] [PubMed] [Google Scholar]
- Crawford AC, Evans MG, Fettiplace R. The actions of calcium on the mechano-electrical transducer current of turtle hair cells. J Physiol (Lond) 1991;434:369–398. doi: 10.1113/jphysiol.1991.sp018475. [DOI] [PMC free article] [PubMed] [Google Scholar]
- Cueva JG, Mulholland A, Goodman MB. Nanoscale organization of the MEC-4 DEG/ENaC sensory mechanotransduction channel in Caenorhabditis elegans touch receptor neurons. The Journal of neuroscience : the official journal of the Society for Neuroscience. 2007;27:14089–14098. doi: 10.1523/JNEUROSCI.4179-07.2007. [DOI] [PMC free article] [PubMed] [Google Scholar]
- Denk W, Holt JR, Shepherd GM, Corey DP. Calcium imaging of single stereocilia in hair cells: localization of transduction channels at both ends of tip links. Neuron. 1995;15:1311–1321. doi: 10.1016/0896-6273(95)90010-1. [DOI] [PubMed] [Google Scholar]
- Eatock RA, Corey DP, Hudspeth AJ. Adaptation of mechanoelectrical transduction in hair cells of the bullfrog’s sacculus. The Journal of neuroscience : the official journal of the Society for Neuroscience. 1987;7:2821–2836. doi: 10.1523/JNEUROSCI.07-09-02821.1987. [DOI] [PMC free article] [PubMed] [Google Scholar]
- Farris HE, LeBlanc CL, Goswami J, Ricci AJ. Probing the pore of the auditory hair cell mechanotransducer channel in turtle. J Physiol. 2004;558:769–792. doi: 10.1113/jphysiol.2004.061267. [DOI] [PMC free article] [PubMed] [Google Scholar]
- Farris HE, Wells GB, Ricci AJ. Steady-state adaptation of mechanotransduction modulates the resting potential of auditory hair cells, providing an assay for endolymph [Ca2+] The Journal of neuroscience : the official journal of the Society for Neuroscience. 2006;26:12526–12536. doi: 10.1523/JNEUROSCI.3569-06.2006. [DOI] [PMC free article] [PubMed] [Google Scholar]
- Fettiplace R. The role of calcium in hair cell transduction. Soc Gen Physiol Ser. 1992;47:343–356. [PubMed] [Google Scholar]
- Fettiplace R, Ricci AJ. Adaptation in auditory hair cells. Curr Opin Neurobiol. 2003;13:446–451. doi: 10.1016/s0959-4388(03)00094-1. [DOI] [PubMed] [Google Scholar]
- Gillespie PG, Cyr JL. Myosin-1c, the hair cell’s adaptation motor. Annu Rev Physiol. 2004;66:521–545. doi: 10.1146/annurev.physiol.66.032102.112842. [DOI] [PubMed] [Google Scholar]
- Gillespie PG, Muller U. Mechanotransduction by hair cells: models, molecules, and mechanisms. Cell. 2009;139:33–44. doi: 10.1016/j.cell.2009.09.010. [DOI] [PMC free article] [PubMed] [Google Scholar]
- Grati M, Shin JB, Weston MD, Green J, Bhat MA, Gillespie PG, Kachar B. Localization of PDZD7 to the Stereocilia Ankle-Link Associates this Scaffolding Protein with the Usher Syndrome Protein Network. The Journal of neuroscience : the official journal of the Society for Neuroscience. 2012;32:14288–14293. doi: 10.1523/JNEUROSCI.3071-12.2012. [DOI] [PMC free article] [PubMed] [Google Scholar]
- Hacohen N, Assad JA, Smith WJ, Corey DP. Regulation of tension on hair-cell transduction channels: displacement and calcium dependence. The Journal of neuroscience : the official journal of the Society for Neuroscience. 1989;9:3988–3997. doi: 10.1523/JNEUROSCI.09-11-03988.1989. [DOI] [PMC free article] [PubMed] [Google Scholar]
- Hirono M, Denis CS, Richardson GP, Gillespie PG. Hair cells require phosphatidylinositol 4,5-bisphosphate for mechanical transduction and adaptation. Neuron. 2004;44:309–320. doi: 10.1016/j.neuron.2004.09.020. [DOI] [PubMed] [Google Scholar]
- Holt JR, Gillespie SK, Provance DW, Shah K, Shokat KM, Corey DP, Mercer JA, Gillespie PG. A chemical-genetic strategy implicates myosin-1c in adaptation by hair cells. Cell. 2002;108:371–381. doi: 10.1016/s0092-8674(02)00629-3. [DOI] [PubMed] [Google Scholar]
- Howard J, Hudspeth AJ. Mechanical relaxation of the hair bundle mediates adaptation in mechanoelectrical transduction by the bullfrog’s saccular hair cell. Proceedings of the National Academy of Sciences of the United States of America. 1987;84:3064–3068. doi: 10.1073/pnas.84.9.3064. [DOI] [PMC free article] [PubMed] [Google Scholar]
- Hudspeth AJ. How the ear’s works work: mechanoelectrical transduction and amplification by hair cells. C R Biol. 2005;328:155–162. doi: 10.1016/j.crvi.2004.12.003. [DOI] [PubMed] [Google Scholar]
- Hudspeth AJ. Making an effort to listen: mechanical amplification in the ear. Neuron. 2008;59:530–545. doi: 10.1016/j.neuron.2008.07.012. [DOI] [PMC free article] [PubMed] [Google Scholar]
- Hudspeth AJ, Gillespie PG. Pulling springs to tune transduction: adaptation by hair cells. Neuron. 1994;12:1–9. doi: 10.1016/0896-6273(94)90147-3. [DOI] [PubMed] [Google Scholar]
- Johnson SL, Beurg M, Marcotti W, Fettiplace R. Prestin-driven cochlear amplification is not limited by the outer hair cell membrane time constant. Neuron. 2011;70:1143–1154. doi: 10.1016/j.neuron.2011.04.024. [DOI] [PMC free article] [PubMed] [Google Scholar]
- Kennedy HJ, Evans MG, Crawford AC, Fettiplace R. Fast adaptation of mechanoelectrical transducer channels in mammalian cochlear hair cells. Nat Neurosci. 2003;6:832–836. doi: 10.1038/nn1089. [DOI] [PubMed] [Google Scholar]
- Kros CJ, Marcotti W, van Netten SM, Self TJ, Libby RT, Brown SD, Richardson GP, Steel KP. Reduced climbing and increased slipping adaptation in cochlear hair cells of mice with Myo7a mutations. Nat Neurosci. 2002;5:41–47. doi: 10.1038/nn784. [DOI] [PubMed] [Google Scholar]
- Martinac B, Adler J, Kung C. Mechanosensitive ion channels of E. coli activated by amphipaths. Nature. 1990;348:261–263. doi: 10.1038/348261a0. [DOI] [PubMed] [Google Scholar]
- Pan B, Waguespack J, Schnee ME, LeBlanc C, Ricci AJ. Permeation properties of the hair cell mechanotransducer channel provide insight into its molecular structure. J Neurophysiol. 2012;107:2408–2420. doi: 10.1152/jn.01178.2011. [DOI] [PMC free article] [PubMed] [Google Scholar]
- Patel AJ, Lazdunski M, Honore E. Lipid and mechano-gated 2P domain K(+) channels. Curr Opin Cell Biol. 2001;13:422–428. doi: 10.1016/s0955-0674(00)00231-3. [DOI] [PubMed] [Google Scholar]
- Peng AW, Salles FT, Pan B, Ricci AJ. Integrating the biophysical and molecular mechanisms of auditory hair cell mechanotransduction. Nat Commun. 2011;2:523. doi: 10.1038/ncomms1533. [DOI] [PMC free article] [PubMed] [Google Scholar]
- Pickles JO, Brix J, Comis SD, Gleich O, Koppl C, Manley GA, Osborne MP. The organization of tip links and stereocilia on hair cells of bird and lizard basilar papillae. Hearing research. 1989;41:31–41. doi: 10.1016/0378-5955(89)90176-7. [DOI] [PubMed] [Google Scholar]
- Pickles JO, Comis SD, Osborne MP. Cross-links between stereocilia in the guinea pig organ of Corti, and their possible relation to sensory transduction. Hearing research. 1984;15:103–112. doi: 10.1016/0378-5955(84)90041-8. [DOI] [PubMed] [Google Scholar]
- Powers RJ, Roy S, Atilgan E, Brownell WE, Sun SX, Gillespie PG, Spector AA. Stereocilia membrane deformation: implications for the gating spring and mechanotransduction channel. Biophysical journal. 2012;102:201–210. doi: 10.1016/j.bpj.2011.12.022. [DOI] [PMC free article] [PubMed] [Google Scholar]
- Pyrpassopoulos S, Feeser EA, Mazerik JN, Tyska MJ, Ostap EM. Membrane-Bound Myo1c Powers Asymmetric Motility of Actin Filaments. Current biology : CB. 2012 doi: 10.1016/j.cub.2012.06.069. [DOI] [PMC free article] [PubMed] [Google Scholar]
- Ricci AJ, Crawford AC, Fettiplace R. Active hair bundle motion linked to fast transducer adaptation in auditory hair cells. The Journal of neuroscience : the official journal of the Society for Neuroscience. 2000;20:7131–7142. doi: 10.1523/JNEUROSCI.20-19-07131.2000. [DOI] [PMC free article] [PubMed] [Google Scholar]
- Ricci AJ, Fettiplace R. The effects of calcium buffering and cyclic AMP on mechano-electrical transduction in turtle auditory hair cells. J Physiol (Lond) 1997;501:111–124. doi: 10.1111/j.1469-7793.1997.111bo.x. [DOI] [PMC free article] [PubMed] [Google Scholar]
- Ricci AJ, Fettiplace R. Calcium permeation of the turtle hair cell mechanotransducer channel and its relation to the composition of endolymph. J Physiol (Lond) 1998;506:159–173. doi: 10.1111/j.1469-7793.1998.159bx.x. [DOI] [PMC free article] [PubMed] [Google Scholar]
- Ricci AJ, Kennedy HJ, Crawford AC, Fettiplace R. The transduction channel filter in auditory hair cells. The Journal of neuroscience : the official journal of the Society for Neuroscience. 2005;25:7831–7839. doi: 10.1523/JNEUROSCI.1127-05.2005. [DOI] [PMC free article] [PubMed] [Google Scholar]
- Ricci AJ, Wu YC, Fettiplace R. The endogenous calcium buffer and the time course of transducer adaptation in auditory hair cells. The Journal of neuroscience : the official journal of the Society for Neuroscience. 1998;18:8261–8277. doi: 10.1523/JNEUROSCI.18-20-08261.1998. [DOI] [PMC free article] [PubMed] [Google Scholar]
- Sachs F. Stretch-activated ion channels: what are they? Physiology (Bethesda) 2010;25:50–56. doi: 10.1152/physiol.00042.2009. [DOI] [PMC free article] [PubMed] [Google Scholar]
- Sachs F, Morris CE. Mechanosensitive ion channels in nonspecialized cells. Rev Physiol Biochem Pharmacol. 1998;132:1–77. doi: 10.1007/BFb0004985. [DOI] [PubMed] [Google Scholar]
- Schneider ME, Dose AC, Salles FT, Chang W, Erickson FL, Burnside B, Kachar B. A new compartment at stereocilia tips defined by spatial and temporal patterns of myosin IIIa expression. The Journal of neuroscience : the official journal of the Society for Neuroscience. 2006;26:10243–10252. doi: 10.1523/JNEUROSCI.2812-06.2006. [DOI] [PMC free article] [PubMed] [Google Scholar]
- Stauffer EA, Scarborough JD, Hirono M, Miller ED, Shah K, Mercer JA, Holt JR, Gillespie PG. Fast adaptation in vestibular hair cells requires Myosin-1c activity. Neuron. 2005;47:541–553. doi: 10.1016/j.neuron.2005.07.024. [DOI] [PMC free article] [PubMed] [Google Scholar]
- Stepanyan R, Frolenkov GI. Fast adaptation and Ca2+ sensitivity of the mechanotransducer require myosin-XVa in inner but not outer cochlear hair cells. The Journal of neuroscience : the official journal of the Society for Neuroscience. 2009;29:4023–4034. doi: 10.1523/JNEUROSCI.4566-08.2009. [DOI] [PMC free article] [PubMed] [Google Scholar]
- Sukharev S, Sachs F. Molecular force transduction by ion channels: diversity and unifying principles. J Cell Sci. 2012;125:3075–3083. doi: 10.1242/jcs.092353. [DOI] [PMC free article] [PubMed] [Google Scholar]
- Sukharev SI, Blount P, Martinac B, Kung C. Mechanosensitive channels of Escherichia coli: the MscL gene, protein, and activities. Annu Rev Physiol. 1997;59:633–657. doi: 10.1146/annurev.physiol.59.1.633. [DOI] [PubMed] [Google Scholar]
- Vollrath MA, Eatock RA. Time course and extent of mechanotransducer adaptation in mouse utricular hair cells: Comparison with frog saccular hair cells. J Neurophysiol. 2003 doi: 10.1152/jn.00893.2002. 00893.02002. [DOI] [PubMed] [Google Scholar]
- Waguespack J, Salles FT, Kachar B, Ricci AJ. Stepwise morphological and functional maturation of mechanotransduction in rat outer hair cells. The Journal of neuroscience : the official journal of the Society for Neuroscience. 2007;27:13890–13902. doi: 10.1523/JNEUROSCI.2159-07.2007. [DOI] [PMC free article] [PubMed] [Google Scholar]
- Wu Y-C, Ricci AJ, Fettiplace R. Two Components of Transducer Adaptation in Auditory Hair Cells. J Neurophysiol. 1999;82:2171–2181. doi: 10.1152/jn.1999.82.5.2171. [DOI] [PubMed] [Google Scholar]
- Yoshimura K, Batiza A, Kung C. Chemically Charging the Pore Constriction Opens the Mechanosensitive Channel MscL. Biophys J. 2001;80:99017. doi: 10.1016/S0006-3495(01)76192-9. [DOI] [PMC free article] [PubMed] [Google Scholar]
Associated Data
This section collects any data citations, data availability statements, or supplementary materials included in this article.