

Abstract
The purpose of this study was to observe exercise training–induced effects on adiponectin, leptin, and ghrelin. Twenty-nine older, healthy participants were classified as physically active (comparison group: N = 15, 70.9±1.2 years) or physically inactive (exercise group: N = 14, 70.5±1.4 years). Exercise group participants completed 12 weeks of combined aerobic and resistance exercise training, whereas comparison group participants maintained their current level of exercise and served as a physically active comparison group. Monocyte phenotype, as well as serum ghrelin, leptin, adiponectin, and soluble tumor necrosis factor receptor II were analyzed prior to and following the 12-week period. Ghrelin and adiponectin increased 47% and 55%, respectively, in exercise group participants following exercise training. Percent change in ghrelin (post and pre) was negatively correlated with the percent change in CD14+CD16+ monocytes (post and pre) in exercise group participants. Despite no changes in body mass, these data contribute to evidence for the anti-inflammatory effects of exercise.
Key Words: Adipokine, Inflammation, Anti-inflammatory.
As people age, there is an increased risk for chronic diseases such as type 2 diabetes, cardiovascular disease, and Alzheimer’s disease. These conditions are frequently linked to chronic low-grade inflammation (1–4). Exercise reduces the risk of these diseases, but a direct link between exercise’s anti-inflammatory effects and reduced disease risk is tenuous (5–7). Lower chronic inflammation is associated with exercise in both cross-sectional (8–11) and longitudinal (5,7,12,13) studies; however, it remains unknown how exercise exerts its anti-inflammatory effect. Some researchers point to a change in monocyte phenotype (13) or muscle physiology (12,14), which may be partially related to exercise-induced changes in gut and adipocyte secretions—specifically, ghrelin, leptin, and adiponectin. We previously reported that inactive older adults had a significantly lower circulating “inflammatory” CD14+CD16+ monocyte percentage following 12 weeks of resistance exercise (13). The present work will explore additional potential contributors to the anti-inflammatory effect of exercise, specifically if hormones with pro- and anti-inflammatory properties are modulated by resistance training in older adults.
In addition to higher levels of inflammatory markers, older adults experience a concomitant reduction in circulating ghrelin and increased leptin (15). However, exercise training may attenuate the age-associated reduction in ghrelin, with changes more pronounced among individuals who experience greater weight loss (16). In contrast, studies in which exercise training–induced changes in circulating leptin were examined reveal equivocal results (17,18). Soluble tumor necrosis factor receptor II (sTNF-RII) can indicate inflammation and TNFα activity, and similar to leptin, some researchers have reported lower amounts of sTNF-RII in more active individuals (11), whereas others have reported no association between activity and sTNF-RII (19). However, there are few studies in older adults who exercise but do not change their body composition, and it is currently unknown if a significant body composition change must precede changes in leptin, adiponectin, and ghrelin.
The appetite-stimulating hormone ghrelin is predominantly synthesized and secreted from the stomach and small intestine and exhibits anti-inflammatory prop- erties (20,21). Its receptor, growth hormone secretagogue receptor, is expressed on the surface of human monocytes (21), suggesting ghrelin’s functions extend beyond growth hormone, food intake, and body weight regulation (22). Leptin, derived from adipocytes, is elevated in obese and older individuals due to increased amounts of leptin-secreting adipose tissue (23). In contrast to ghrelin, elevated leptin concentrations stimulate proinflammatory cytokine production via interaction with the leptin receptor (Ob-R)—expressed on approximately 25% of monocytes (24). Adiponectin, also derived from adipocytes, is known to exhibit anti-inflammatory properties (25) and is decreased in individuals with a high body mass index (BMI) (1,26).
Ghrelin, leptin, and adiponectin may regulate cytokine production from monocytes (22,24,27). Moreover, exercise training interventions blunt inflammation (6,7) and appear to be linked to changes in monocyte phenotype (13). Given the possible immunoregulatory influences of ghrelin, leptin, and adiponectin, it is reasonable to speculate that these hormones contribute to the phenotypic shift in monocytes and subsequent reduction in circulating inflammatory cytokines following exercise training. To our knowledge, no researchers have examined the potential relationships existing between ghrelin, leptin, adiponectin, and changes in monocyte phenotype following exercise training. Thus, the purpose of the present investigation was to examine the effects of 12 weeks of combined endurance and resistance exercise training without weight loss in physically inactive participants aged 65–80 years, specifically examining the changes in serum ghrelin, leptin, and adiponectin, and to investigate relationships with monocyte phenotype. We hypothesized that exercise training would increase serum ghrelin and adiponectin and would decrease leptin and that changes in hormone concentrations would be linked to changes in monocyte phenotype and inflammatory biomarkers.
Methods
Participants
This study was conducted with approval from the Committee on the Use of Human Research Subjects at Purdue University and is a secondary analysis of an exercise training study in older adults. Twenty-nine older, apparently healthy participants (males: n = 12; females: n = 17; age: 71.2 ± 5.0 years) participated in this longitudinal exercise training study. Inclusion criteria included being between the ages of 65–85 years and in relative good health. Individuals were excluded from participation if they were currently taking hormone replacements, prescription medication affecting leukocyte function or any known influence on immune function, estrogen receptor modulators, statins, bisphosphonates, or other over-the-counter “bone active” medications or supplements within the previous 2 months. Additional exclusion criteria included BMI greater than 35 kg/m2, signs of acute illness and/or infection, medical conditions (chronic or acute) that would prevent participation in regular exercise, and smokers and/or smokeless tobacco users.
Preliminary Screening
Participants were asked to visit the laboratory approximately 2 weeks prior to baseline testing for preliminary screening. Participants were asked to complete a medical history questionnaire to determine eligibility based on the aforementioned exclusion criteria. Thereafter, based on the results from the Paffenbarger questionnaire and the modified Balke submaximal  test, each participant was assigned to either the physically active comparison (CON: males = 8; females = 7) or physically inactive (EX: males = 4; females = 10) group. Specifically, participants reporting high levels of physical activity with
  in the “good” to “excellent” category (males: >35 mL/kg · min; females: >28 mL/kg · min) were assigned to the physically active comparison (CON) group. Participants reporting low physical activity participation with a
  in the “fair” to “very poor”
  (males: <26 mL/kg · min; females: <23 mL/kg · min) were assigned to the EX group. Physically active participants were selected as a “control” group because we wanted to compare our intervention to a group of people of the same age who are at optimum health (28–30). Comparison with a group healthier than the treatment group is a common practice in medical interventions (31,32) and has also been used in exercise research (7,33).
Each participants’ height, weight, BMI, and relative body fat (BF; three-site skinfold method) measurements were collected during preliminary screening and again postexercise training. CON participants completed a baseline 1 repetition maximum (RM) for leg press, chest press, and leg curl, whereas in the EX participants, 1RM was measured as a component of acclimation to exercise. The EX participants completed a 12-week combined endurance and resistance exercise training program, whereas the CON participants served as a physically active comparison group and maintained their habitual physical activity levels for 12 weeks.
Acclimation and Exercise Training
The detailed exercise protocol has been published elsewhere (13). We have included sufficient detail to help the reader understand out exercise methodology, but the reader should refer to the original article for further details. Each participant attended a three-session exercise acclimation prior to the 12-week exercise training program. During the acclimation period, participants were familiarized with the treadmill (LifeFitness Treadmills, Schiller Park, IL) and instructed in proper weight lifting technique on the eight resistance exercises: leg press, chest press, seated row, leg extension, leg curl, leg abduction, leg adduction, and “lat” pulldown (Keiser Equipment, Fresno, CA). One RM was assessed for three resistance exercises (leg press, leg curl, and chest press) were completed for comparison with the CON group.
Each EX participant completed 12 weeks (3 d/wk) of combined endurance and resistance exercise training. All participants met the attendance requirement of a minimum of 90% of training sessions. Each exercise session included 20 minutes of treadmill walking at 60%–70% of heart rate reserve, followed by two sets at approximately 80% 1RM of the eight aforementioned resistance exercises. When the participant was able to complete 15 repetitions on their second set, resistance was increased 5%–10% for the following week. During each exercise session, an investigator was present to monitor participant safety and to ensure proper technique and appropriate intensity during training.
Posttraining Measurements
Following completion of the 12-week exercise training program, EX participants were reassessed for 8RMs, submaximal  , BMI, and BF. In addition, 1RMs were completed in both the CON and EX groups for chest press, leg press, and leg curl.
Blood Sampling
Participants were asked to refrain from exercise 72 hours prior to blood sampling, as well as to follow an exchange diet (50% carbohydrates, 35% fat, and 15% protein) and record foods consumed. Participants were asked to eat similar foods prior to the postintervention sample. On the day of blood sampling, participants reported to the laboratory between 06:30 am and 08:00 am following an overnight fast. After a 15-minute rest, a phlebotomist collected blood into serum separator and sodium heparin tubes from a vein in the antecubital space.
Flow Cytometry
Fresh (<4 hours) sodium heparinized blood was incubated for 30 minutes in the dark (~25°C) with fluorochrome-conjugated antibodies for CD14 and CD16. Gating parameters were set with appropriate three-color isotype controls. Prior to analysis (Beckman Coulter Cytomics FC500 Flow Cytometry system), immunoprep (Beckman Coulter) was used to lyse red blood cells and fix leukocytes.
Serum Measurements
Following collection into serum tubes, blood was allowed to clot and subsequently centrifuged at 1,300g for 10 minutes at 4°C, then aliquotted and kept at −80°C until time of analysis. Commercialized ELISA kits were used to determine serum ghrelin (Phoenix Pharmaceuticals, Burlingame, CA), leptin (RayBiotech, Norcross, GA), adiponectin (RayBiotech), and sTNF-RII (RayBiotech). All samples were run in duplicate.
Statistical Analysis
All analyses were conducted in SAS version 9.1 (Cary, NC). Sample size for all variables except ghrelin and leptin was determined based on previous studies of inflammatory markers from our laboratory (7,9). Ghrelin and leptin concentrations were obtained from a convenience sample of 10 randomly selected participants from each group. Other researchers have successfully used small sample size to detected group differences in ghrelin and leptin (34). PROC CORR was used to calculate Pearson product moment correlations. A p value of less than .05 was considered significant, and a p value of less than or equal to .10 was considered a trend. PROC GLM was used to examine possible baseline differences, whereas PROC MIXED was used to examine possible differences between and within groups. Prior to analysis, variables were examined for homogeneity of variance, assumptions of normality, and independence of observations. A Box–Cox transformation was used, as needed, to determine the best transformation; adiponectin, leptin, ghrelin, and sTNF-RII were log transformed prior to analysis but are presented untransformed. BF was considered a covariate of leptin and the model accounted for this. Participants were treated as blocks, and the Tukey method was used to determine the location of significant pairwise comparisons. Results are reported as mean ± SE.
Results
Demographic and anthropometric data have been previously reported (13). Briefly, the EX participants had higher BF than the CON participants (43.9% vs 36.7%), and a lower  (20.1 vs 35.7 mL/kg · min) and leg press 1RM (155.17 vs 177.9 kg). Despite no changes in body composition, as previously reported (13), EX participants did have a significant increase in both
  (20.1 pre vs 38.8 mL/kg · min post) and leg press 1RM (187.7 post). Furthermore, postexercise training measurements of body weight, BMI, and BF percentage were significantly different between the CON and EX groups.
Ghrelin
Mean serum ghrelin concentrations increased 47% (p < .01) in the EX group following exercise training (32.9 ± 4.0pre vs 48.2 ± 6.0 ng/mL post; Figure 1).
Figure 1.

Ghrelin concentrations for the comparison (CON) and exercise (EX) groups at pre- and postexercise training. *Postexercise EX higher (p < .05) than baseline EX.
Leptin
Leptin was lower in CON (14.2 ± 6.1ng/mL) compared with EX (23.6 ± 6.1ng/mL) at baseline (p < .05), but no differences were detected between groups postexercise training (CON: 12.9 ± 4.9ng/mL and EX: 16.5 ± 3.9; p > .05). Mean serum leptin concentration was lower in the EX group following exercise training (30%; Figure 2); however, this reduction was not significant (p > .05). Further analysis of leptin including weight, BMI, or BF percentage added as a covariate did not change this finding.
Figure 2.

Leptin concentrations for the comparison (CON) and exercise (EX) groups at pre- and postexercise training. *Baseline EX higher (p < .05) than baseline CON (p < .05).
Adiponectin
Adiponectin in EX participants increased 55% following exercise training (pre: 13.9 ± 2.5 μg/mL; post: 21.6 ± 4.6 μg/mL; Figure 3). Postexercise adiponectin was higher (p < .05) in EX compared with baseline CON (19.3 ± 5.9 μg/mL) and postexercise CON (13.8 ± 3.5 μg/mL). There was no between-group difference in adiponectin concentration at baseline (p > .05). Additionally, no differences were detected in pre- to postexercise adiponectin in the CON group.
Figure 3.
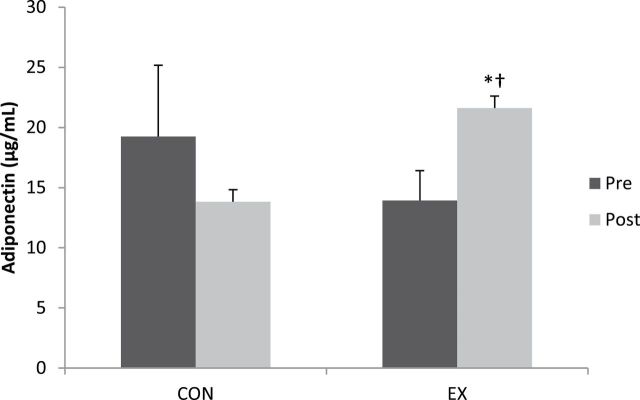
Adiponectin concentrations for the comparison (CON) and exercise (EX) groups at pre- and postexercise training. *Postexercise EX higher (p < .05) than baseline EX; †postexercise EX higher (p < .05) than baseline and postexercise CON.
Soluble TNF Receptor II
No differences were detected at baseline between CON (4.5 ± 0.2ng/mL) and EX (4.6 ± 0.3ng/mL) in sTNF-RII concentration (Figure 4). sTNF-RII did not change in either group following exercise training (p > .05) and no differences were found postexercise between CON (4.4 ± 0.2ng/mL) and EX (4.7 ± 0.2ng/mL) in sTNF-RII.
Figure 4.
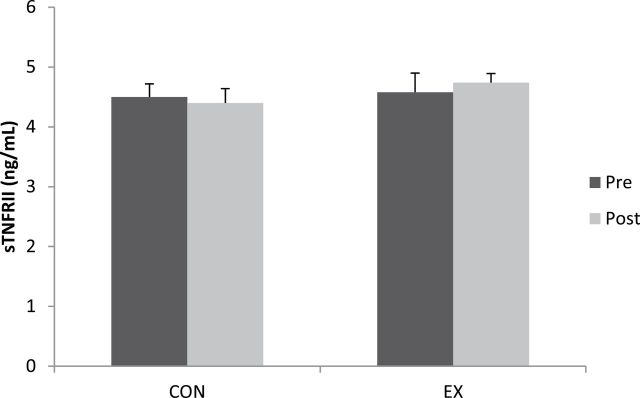
Soluble tumor necrosis factor receptor II (sTNF-RII) for the comparison (CON) and exercise (EX) groups at pre- and postexercise training.
Correlations
Somewhat unexpected, adiponectin was positively associated to BF percentage in EX pre (Figure 5A). Additionally, the percent change of CD14+CD16+ monocytes is correlated with ghrelin percent change (Figure 5B) and a trend with leptin percent change (R 2 = .66, p = .05).
Figure 5.
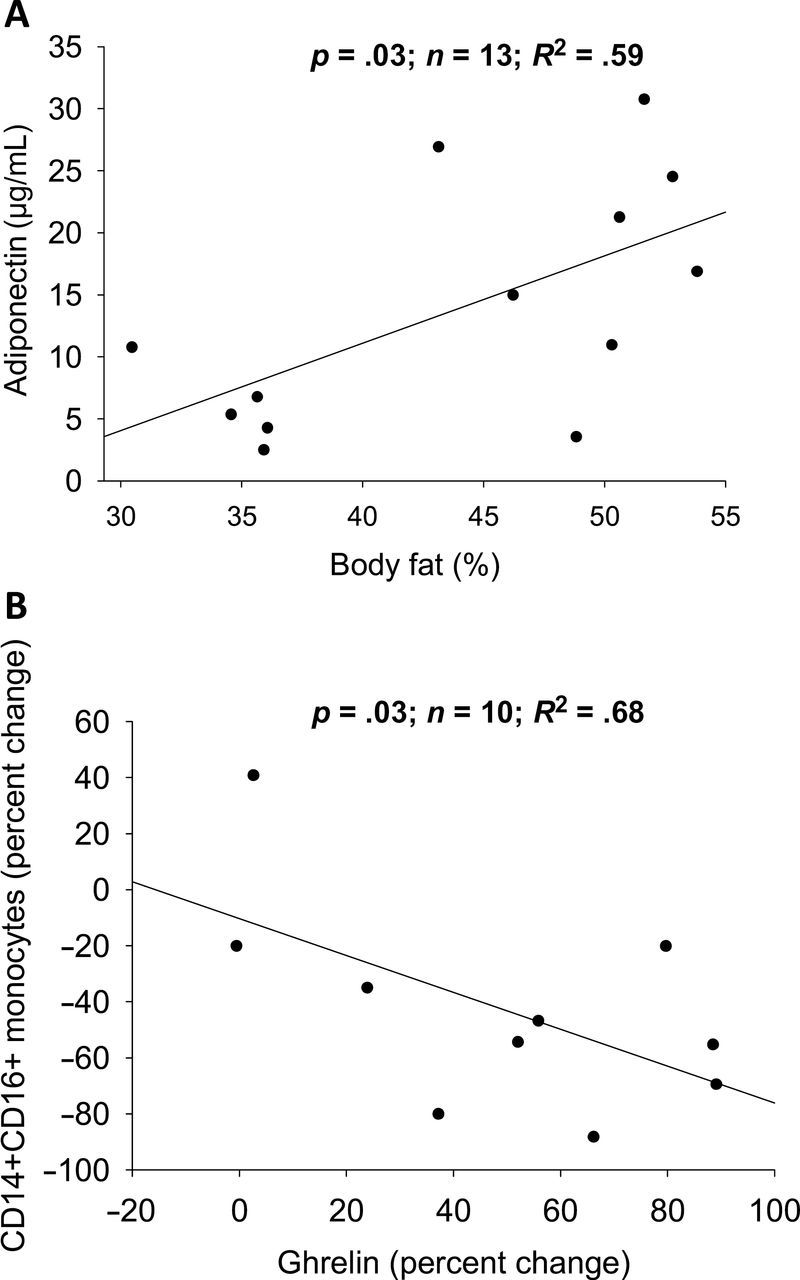
Correlation between adiponectin and body fat (A) and CD14+CD16+ percent change monocytes and ghrelin percent change (B).
Discussion
This longitudinal study investigated changes in adi- ponectin, leptin, ghrelin, and sTNF-RII following 12 weeks of exercise training and examined potential relationships with inflammatory markers. Despite no significant changes in body composition, there were significant increases in circulating ghrelin and adiponectin and a trend for reduced leptin (35% decrease) following exercise training. To our knowledge, we are the first to report weight loss–independent changes in ghrelin following participation in combined high intensity resistance and aerobic training in older adults.
This study is among the first to report the potential anti-inflammatory effects of exercise and ghrelin. The increases in circulating ghrelin and adiponectin after 12 weeks of exercise training occurred without any significant alterations in weight or BF percentage. In the absence of weight loss, the majority of researchers report no influence of exercise training on serum ghrelin. Specifically, Leidy and colleagues (16) reported minimal changes in circulating ghrelin following 3 months of aerobic exercise training in women who remained weight stable. In contrast, a significant increase in ghrelin was reported among the participants who lost weight due to a combined treatment of diet and exercise. Similarly, participation in a 1-year exercise training program did lead to higher levels of ghrelin, with greater increases among participants who lost more weight (35). Twelve weeks of exercise training without weight loss also increased adiponectin, such that the previously inactive participants (EX) had significantly higher adiponectin than the active comparison participants (CON). It was somewhat surprising that there was no baseline adiponectin group difference, as other researchers have related physical activity level to adiponectin concentration (36). Nevertheless, the intensity of our exercise training protocol may explain why we observed only an exercise training effect. The physically active participants were exercising at a self-selected intensity, and unsupervised exercise may not always confer the same benefits as supervised exercise (37).
An alternative explanation for weight loss–independent changes in ghrelin and adiponectin may be related to insignificant changes in fat-free mass. It is possible that our participants had small increases in fat-free mass following 12 weeks of training. Changes in fat-free mass influence metabolic activity and overall energy balance (17), and it is possible that a statistically insignificant increase in fat-free mass has metabolic consequences. Recent research has linked exercise and muscle gains in elderly people to a decrease in muscle inflammatory gene expression (38). Our use of skinfold measurements to assess body composition may have limited our ability to detect small body composition changes. Nevertheless, these positive changes associated with exercise, despite no change in body weight, underscore the importance of including exercise for a healthy lifestyle.
In addition to an increase in ghrelin, as previously reported (13), we observed a concomitant reduction in CD14+CD16+ monocytes. Futhermore, the percent increase in ghrelin following training was significantly correlated with the percent decrease in CD14+CD16+ monocytes in the EX group. Dixit and colleagues (22) established the anti-inflammatory effects of ghrelin; our data are the first to provide support for the possible role of exercise training–induced monocyte phenotype changes. In addition, percent decrease in leptin was positively correlated with percent decrease of circulating CD14+CD16+ monocytes. These correlations, however, do not establish a cause and effect relationship. Further in vitro work may be useful in outlining the potential causative effects of ghrelin in reducing CD14+CD16+ monocytes after exercise training, possibly via interactions with the growth hormone secretagogue receptor. It is unknown whether Ob-R is differentially expressed on CD14+CD16+ inflammatory monocytes or on classical monocytes. Subsequently, research investigating Ob-R expression on monocytes would be beneficial as differential expression of this receptor on monocyte subclasses may underlie the exercise training–induced reduction in CD14+CD16+ monocytes. Regardless, it appears that the antagonistic relationship existing between ghrelin and leptin extends beyond maintaining energy balance and may interact to regulate inflammatory processes following exercise training.
Additionally, adiponectin was positively correlated to baseline body weight in the EX participants. This was surprising because previous studies have shown an inverse relationship between adiponectin and BMI (39). In the present study, the relationship between adiponectin and BF persisted after 12 weeks of exercise training. That is, there was not a significant change in participants’ body weight, yet adiponectin increased. Therefore, exercise may provide a sufficient stimulus to drive an increase in adiponectin, and this could account for the anti-inflammatory effect of exercise that is observed in “fit yet fat” individuals.
Previous research on leptin and a possible exercise training effect offer conflicting findings. Leptin has been shown to decrease (17) or remain unaltered (40) following cardiovascular or resistance training. We observed a 35% decrease, but it was not statistically significant; however, it is possible that more than 12 weeks of exercise training is needed to significantly decrease leptin. Given the high intensity exercise protocol implemented in our study, it is logical to suggest that the ability of exercise training to alter leptin relies on exercise training intensity, volume, and duration. This is supported by Fatouras and colleagues (17), who established that exercise intensity modifies changes in adipokine levels. Other researchers (40,41) highlight the importance of weight loss and/or BF reduction as a mechanism responsible for changes in leptin following exercise training. However, Fatouras and colleagues (17) observed a significantly greater reduction in leptin in the high intensity group compared with the low and moderate intensity groups, even after adjusting for BMI and skinfold sum. Despite a lack of significance, the dramatic decrease in leptin lends support to the contention that resistance exercise may induce a reduction in circulating leptin, independent of changes in weight loss and/or BF.
Because it is also known that exercise is associated with lower TNFα (6,12), we had hypothesized that TNFα activity would be lower in physically active participants and would be reduced after 12 weeks of exercise training. Serum sTNF-RII concentration was measured as an indicator of TNFα activity. However, there were no group or treatment effects.
In conclusion, 12 weeks of exercise training without weight loss significantly modulated changes in ghrelin and adiponectin. These changes may contribute to the anti-inflammatory properties of exercise and could partially explain the reduced chronic disease rate observed in physically active individuals.
Funding
This work was funded by an American Association of Retired Persons (AARP) Scholars Program Award granted by AARP’s Office of Academic Affairs and internal support from the Department of Health and Kinesiology at Purdue University.
Conflict of Interest
The authors have no conflicts of interest.
Acknowledgments
This project was conducted in the Department of Health and Kinesiology at Purdue University, West Lafayette, Indiana. M.M.M. conceived this substudy, collected and analyzed data, performed the statistical analysis, and wrote the paper. A.E.C. conceived this substudy, collected and analyzed data, and wrote the paper. K.L.T. conceived the parent study, collected data, and revised the paper. K.J. performed the statistical analysis and revised the paper. P.M.C. collected data, revised the paper, and contributed technical expertise. B.D.P. collected data and revised the paper. M.G.F. conceived the substudy and parent study design, supervised the research, and revised the paper.
References
- 1. Engeli S, Feldpausch M, Gorzelniak K, et al. Association between adiponectin and mediators of inflammation in obese women. Diabetes. 2003;52:942–947 [DOI] [PubMed] [Google Scholar]
- 2. Schieffer B, Schieffer E, Hilfiker-Kleiner D, et al. Expression of angiotensin II and interleukin 6 in human coronary atherosclerotic plaques: potential implications for inflammation and plaque instability. Circulation. 2000;101:1372–1378 [DOI] [PubMed] [Google Scholar]
- 3. Shi H, Kokoeva MV, Inouye K, Tzameli I, Yin H, Flier JS. TLR4 links innate immunity and fatty acid-induced insulin resistance. J Clin Invest. 2006;116:3015–3025 [DOI] [PMC free article] [PubMed] [Google Scholar]
- 4. Gómez JM, Maravall FJ, Gómez N, Navarro MA, Casamitjana R, Soler J. Interactions between serum leptin, the insulin-like growth factor-I system, and sex, age, anthropometric and body composition variables in a healthy population randomly selected. Clin Endocrinol (Oxf). 2003;58:213–219 [DOI] [PubMed] [Google Scholar]
- 5. Adamopoulos S, Parissis J, Kroupis C, et al. Physical training reduces peripheral markers of inflammation in patients with chronic heart failure. Eur Heart J. 2001;22:791–797 [DOI] [PubMed] [Google Scholar]
- 6. Bruun JM, Helge JW, Richelsen B, Stallknecht B. Diet and exercise reduce low-grade inflammation and macrophage infiltration in adipose tissue but not in skeletal muscle in severely obese subjects. Am J Physiol Endocrinol Metab. 2006;290:E961–E967 [DOI] [PubMed] [Google Scholar]
- 7. Stewart LK, Flynn MG, Campbell WW, et al. The influence of exercise training on inflammatory cytokines and C-reactive protein. Med Sci Sports Exerc. 2007;39:1714–1719 [DOI] [PubMed] [Google Scholar]
- 8. Flynn MG, McFarlin BK, Phillips MD, Stewart LK, Timmerman KL. Toll-like receptor 4 and CD14 mRNA expression are lower in resistive exercise-trained elderly women. J Appl Physiol. 2003;95:1833–1842 [DOI] [PubMed] [Google Scholar]
- 9. McFarlin BK, Flynn MG, Campbell WW, et al. Physical activity status, but not age, influences inflammatory biomarkers and toll-like receptor 4. J Gerontol A Biol Sci Med Sci. 2006;61:388–393 [DOI] [PubMed] [Google Scholar]
- 10. Jankord R, Jemiolo B. Influence of physical activity on serum IL-6 and IL-10 levels in healthy older men. Med Sci Sports Exerc. 2004;36:960–964 [DOI] [PubMed] [Google Scholar]
- 11. Pischon T, Hankinson SE, Hotamisligil GS, Rifai N, Rimm EB. Leisure-time physical activity and reduced plasma levels of obesity-related inflammatory markers. Obes Res. 2003;11:1055–1064 [DOI] [PubMed] [Google Scholar]
- 12. Gielen S, Adams V, Möbius-Winkler S, et al. Anti-inflammatory effects of exercise training in the skeletal muscle of patients with chronic heart failure. J Am Coll Cardiol. 2003;42:861–868 [DOI] [PubMed] [Google Scholar]
- 13. Timmerman KL, Flynn MG, Coen PM, Markofski MM, Pence BD. Exercise training-induced lowering of inflammatory (CD14+CD16+) monocytes: a role in the anti-inflammatory influence of exercise? J Leukoc Biol. 2008;84:1271–1278 [DOI] [PubMed] [Google Scholar]
- 14. Greiwe JS, Cheng B, Rubin DC, Yarasheski KE, Semenkovich CF. Resistance exercise decreases skeletal muscle tumor necrosis factor alpha in frail elderly humans. FASEB J. 2001;15:475–482 [DOI] [PubMed] [Google Scholar]
- 15. Rigamonti AE, Pincelli AI, Corrà B, et al. Plasma ghrelin concentrations in elderly subjects: comparison with anorexic and obese patients. J Endocrinol. 2002;175:R1–R5 [DOI] [PubMed] [Google Scholar]
- 16. Leidy HJ, Gardner JK, Frye BR, et al. Circulating ghrelin is sensitive to changes in body weight during a diet and exercise program in normal-weight young women. J Clin Endocrinol Metab. 2004;89:2659–2664 [DOI] [PubMed] [Google Scholar]
- 17. Fatouros IG, Tournis S, Leontsini D, et al. Leptin and adiponectin responses in overweight inactive elderly following resistance training and detraining are intensity related. J Clin Endocrinol Metab. 2005;90:5970–5977 [DOI] [PubMed] [Google Scholar]
- 18. Lambert CP, Sullivan DH, Evans WJ. Effects of testosterone replacement and/or resistance training on interleukin-6, tumor necrosis factor alpha, and leptin in elderly men ingesting megestrol acetate: a randomized controlled trial. J Gerontol A Biol Sci Med Sci. 2003;58:165–170 [DOI] [PubMed] [Google Scholar]
- 19. Fischer CP, Berntsen A, Perstrup LB, Eskildsen P, Pedersen BK. Plasma levels of interleukin-6 and C-reactive protein are associated with physical inactivity independent of obesity. Scand J Med Sci Sports. 2007;17:580–587 [DOI] [PubMed] [Google Scholar]
- 20. Date Y, Kojima M, Hosoda H, et al. Ghrelin, a novel growth hormone-releasing acylated peptide, is synthesized in a distinct endocrine cell type in the gastrointestinal tracts of rats and humans. Endocrinology. 2000;141:4255–4261 [DOI] [PubMed] [Google Scholar]
- 21. Kojima M, Hosoda H, Date Y, Nakazato M, Matsuo H, Kangawa K. Ghrelin is a growth-hormone-releasing acylated peptide from stomach. Nature. 1999;402:656–660 [DOI] [PubMed] [Google Scholar]
- 22. Dixit VD, Schaffer EM, Pyle RS, et al. Ghrelin inhibits leptin- and activation-induced proinflammatory cytokine expression by human monocytes and T cells. J Clin Invest. 2004;114:57–66 [DOI] [PMC free article] [PubMed] [Google Scholar]
- 23. Wolden-Hanson T, Marck BT, Smith L, Matsumoto AM. Cross-sectional and longitudinal analysis of age-associated changes in body composition of male Brown Norway rats: association of serum leptin levels with peripheral adiposity. J Gerontol A Biol Sci Med Sci. 1999;54:B99–B107 [DOI] [PubMed] [Google Scholar]
- 24. Zarkesh-Esfahani H, Pockley G, Metcalfe RA, et al. High-dose leptin activates human leukocytes via receptor expression on monocytes. J Immunol. 2001;167:4593–4599 [DOI] [PubMed] [Google Scholar]
- 25. Ajuwon KM, Spurlock ME. Adiponectin inhibits LPS-induced NF-kappaB activation and IL-6 production and increases PPARgamma2 expression in adipocytes. Am J Physiol Regul Integr Comp Physiol. 2005;288:R1220–R1225 [DOI] [PubMed] [Google Scholar]
- 26. Arita Y, Kihara S, Ouchi N, et al. Paradoxical decrease of an adipose-specific protein, adiponectin, in obesity. Biochem Biophys Res Commun. 1999;257:79–83 [DOI] [PubMed] [Google Scholar]
- 27. Pang TT, Narendran P. The distribution of adiponectin receptors on human peripheral blood mononuclear cells. Ann N Y Acad Sci. 2008;1150:143–145 [DOI] [PubMed] [Google Scholar]
- 28. Booth FW, Lees SJ. Physically active subjects should be the control group. Med Sci Sports Exerc. 2006;38:405–406 [DOI] [PubMed] [Google Scholar]
- 29. Buford TW, Manini TM. Sedentary individuals as “controls” in human studies: the correct approach? Proc Natl Acad Sci U S A. 2010;107:E134. [DOI] [PMC free article] [PubMed] [Google Scholar]
- 30. Norton LH, Norton KI, Lewis N, Dollman J. A comparison of two short-term intensive physical activity interventions: methodological considerations. Int J Behav Nutr Phys Act. 2011;8:133. [DOI] [PMC free article] [PubMed] [Google Scholar]
- 31. Haykowsky MJ, Brubaker PH, Morgan TM, Kritchevsky S, Eggebeen J, Kitzman DW. Impaired aerobic capacity and physical functional performance in older heart failure patients with preserved ejection fraction: role of lean body mass. J Gerontol A Biol Sci Med Sci. 2013;68:968–975 [DOI] [PMC free article] [PubMed] [Google Scholar]
- 32. Behrens MI, Silva M, Salech F, et al. Inverse susceptibility to oxidative death of lymphocytes obtained from Alzheimer’s patients and skin cancer survivors: increased apoptosis in Alzheimer’s and reduced necrosis in cancer. J Gerontol A Biol Sci Med Sci. 2012;67:1036–1040 [DOI] [PMC free article] [PubMed] [Google Scholar]
- 33. Stewart LK, Flynn MG, Campbell WW, et al. Influence of exercise training and age on CD14+ cell-surface expression of toll-like receptor 2 and 4. Brain Behav Immun. 2005;19:389–397 [DOI] [PubMed] [Google Scholar]
- 34. Morris CJ, Fullick S, Gregson W, et al. Paradoxical post-exercise responses of acylated ghrelin and leptin during a simulated night shift. Chronobiol Int. 2010;27:590–605 [DOI] [PMC free article] [PubMed] [Google Scholar]
- 35. Foster-Schubert KE, McTiernan A, Frayo RS, et al. Human plasma ghrelin levels increase during a one-year exercise program. J Clin Endocrinol Metab. 2005;90:820–825 [DOI] [PubMed] [Google Scholar]
- 36. Jürimäe J, Kums T, Jürimäe T. Plasma adiponectin concentration is associated with the average accelerometer daily steps counts in healthy elderly females. Eur J Appl Physiol. 2010;109:823–828 [DOI] [PubMed] [Google Scholar]
- 37. Timonen L, Rantanen T, Ryynänen OP, Taimela S, Timonen TE, Sulkava R. A randomized controlled trial of rehabilitation after hospitalization in frail older women: effects on strength, balance and mobility. Scand J Med Sci Sports. 2002;12:186–192 [DOI] [PubMed] [Google Scholar]
- 38. Lambert CP, Wright NR, Finck BN, Villareal DT. Exercise but not diet-induced weight loss decreases skeletal muscle inflammatory gene expression in frail obese elderly persons. J Appl Physiol. 2008;105:473–478 [DOI] [PMC free article] [PubMed] [Google Scholar]
- 39. Matsubara M, Maruoka S, Katayose S. Inverse relationship between plasma adiponectin and leptin concentrations in normal-weight and obese women. Eur J Endocrinol. 2002;147:173–180 [DOI] [PubMed] [Google Scholar]
- 40. Lowndes J, Zoeller RF, Caplan JD, et al. Leptin responses to long-term cardiorespiratory exercise training without concomitant weight loss: a prospective study. J Sports Med Phys Fitness. 2008;48:391–397 [PubMed] [Google Scholar]
- 41. Polak J, Klimcakova E, Moro C, et al. Effect of aerobic training on plasma levels and subcutaneous abdominal adipose tissue gene expression of adiponectin, leptin, interleukin 6, and tumor necrosis factor alpha in obese women. Metabolism. 2006;55:1375–1381 [DOI] [PubMed] [Google Scholar]