

Abstract
Most brain mapping techniques require immobilization of the subject, which extinguishes all but the simplest behaviors. We applied in freely moving rats an implantable microbolus infusion pump (MIP) which can be triggered by remote activation for the injection of the cerebral blood flow tracer [14C]iodoantipyrine during behavioral activation. Consistent with previous electrophysiological, metabolic and brain anatomic studies, CBF-related tissue radioactivity (CBF-TR) increased in acoustic cortex during a 1000 Hz/8000 Hz alternating tone. In response to an acute foot-shock, CBF-TR increased in visual cortex, parietal association cortex, and extended into primary motor cortex, and primary somatosensory cortex mapping the trunk. These results support the utility of implantable pumps as adjunct tools for studying cerebral activation during behavioral challenges in nontethered, nonrestrained animals.
Keywords: Brain mapping, Cerebral blood flow, Infusion pump, Autoradiography, Auditory cortex, Electroshock, Stress
Most methods for functional neuroimaging in animals require immobilization or tethering of the subject, which themselves represent a significant stressor or potential confound to the interpretation of brain function [12]. We recently reported the design of a self-contained, implantable microbolus infusion pump (MIP) which can be used to administer an intravenous bolus of the cerebral blood flow tracer [14C]iodoantipyrine by remote activation [7]. We now explore the ability of the MIP as a tool for mapping cortical activation in nonrestrained, nontethered rats in response to an acoustic challenge, or to the stress of acute electric foot-shocks.
Male Sprague–Dawley rats (350–375 g, Harlan Sprague–Dawley Labs, Indianapolis, IN) were used under an institutionally approved protocol. The design and surgical implantation of the MIP have been previously described [7]. In brief, the MIP consists of four components in series: (1) an intravenous catheter, (2) a silicone embedded solenoid valve powered by lithium batteries and gated by a phototransistor, (3) an ejection chamber containing the radiotracer, and (4) a silastic reservoir containing a euthanasia solution. The phototransistor with peak sensitivity in the near infrared (NIR) spectrum allows for transcutaneous triggering of the pump with an external NIR light because the skin is semitransparent to NIR light, and NIR light is behaviorally noninvasive in rodents who are largely insensitive to these wavelengths [11]. Upon triggering, the microvalve opens, allowing the hydraulic pressure from the reservoir to release first the radiotracer into the animal’s circulation, followed a few seconds thereafter by a euthanasia agent (1.0 ml pentobarbital 50 mg/kg, 3 M potassium chloride). Injection of the euthanasia solution results within ~12 s in cardiac arrest and termination of brain perfusion [7]. Regional cerebral blood flow tissue radioactivity is determined thereafter in brain slices using autoradiography.
To implant the MIP, rats were maintained under halothane anesthesia (1.3%). The right external jugular vein was cannulated with a 3.5-F silastic catheter, tunneled to the dorsum of the animal and connected subcutaneously to the MIP. On postoperative day 5, each animal was immobilized for 5 min in a rodent restrainer. The MIP was loaded through a percutaneous port with [14C]iodoantipyrine (100 μCi/kg in 300 μl of 0.9% saline, Amersham Biosciences, Piscataway, NJ). Thereafter, the euthanasia solution was loaded into the reservoir.
Acoustic challenge experiments were performed in a sound-attenuating chamber, containing a behavioral cage (30 × 30 × 50 cm), whose floor consisted of stainless steel rods 8 mm apart. Four panels of infrared light emitting diodes were situated to illuminate the cage interior from above. Background noise inside the cage was measured at 52 dB, and loudspeakers were placed above the cage for use during the acoustic challenge. Rats were randomly assigned to one of two groups: (i) Tone (n = 9), and (ii) No tone (unstimulated controls, n = 12). The acoustic challenge consisted of a 1000 Hz/8000 Hz continuous, alternating sequence of 250-ms pulses with an intensity of 75 dB (recorded 10 cm above the cage floor) [3]. Animals were habituated to the chamber in darkness and silence over 40 min. Thereafter, for rats exposed to the auditory stimulation, the tone sequence was played for 20 s, after which the infrared lights turned on to trigger the pump, while the tone continued during infusion of the radiotracer and euthanasia. Monitoring inside the cage by an infrared-sensitive CCD camera confirmed that animals were at rest during the period preceding the radiotracer infusion.
Electric foot-shock experiments were conducted in the above-mentioned behavioral cage, under indirect low-level fluorescent lighting and 62 dB of background noise. Rats were randomly assigned to: (i) animals (n = 9) exposed to six electric pulses (1 mA, 0.5 s duration, 8 s between shocks) administered as a scrambled shock through the stainless steel floor; (ii) controls (n = 7) exposed to the behavioral cage without the shock. Animals were habituated to the chamber over 40 min, after which they were exposed to the electric shock or the control condition. Foot-shock typically would elicit a startle response, with accompanying jump and vocalization. Immediately following the final shock or control condition, the infrared lights turned on to trigger the pump.
Cerebral blood flow related tissue radioactivity (CBF-TR) was measured by rapid injection of an intravenous bolus of [14C]iodoantipyrine [9,13]. In this method there is a strict linear proportionality between tissue radioactivity and cerebral blood flow when measurements are made within a brief interval (~10 s) following injection of the radiotracer. Following injection of the tracer and subsequent euthanasia, brains were rapidly removed, flash frozen in methylbutane at −70 °C, and cut in a cryostat at −20 °C in 20-μm-thick coronal sections. Positions relative to bregma of sections selected for autoradiographic analysis are described in Tables 1 and 2, respectively, for the acoustic and foot-shock paradigms. Sections were exposed on glass slides for 2 weeks at room temperature to Kodak Ektascan films along with radioactive 14C standards (Amersham Biosciences). Optical density in the cortical mantle was measured with Image Pro-Plus software (Media Cybernetics, Silver Spring, MD). Cortical regions were identified using an anatomic atlas of the rat brain [14], and transcribed to a visual template. Six to ten optical density measures, spaced in 15 angular degree intervals from midline along the cortical rim, were taken per hemisphere for each slice.
Table 1.
Statistical parametric maps of group differences between Z scores of regional cortical blood flow related tissue radioactivity (CBF-TR) of the rats exposed to the acoustic challenge and controls
| Bregma (mm) | Locations within a slice → | ||||||||||
|---|---|---|---|---|---|---|---|---|---|---|---|
| #1 | #2 | #3 | #4 | #5 | #6 | #7 | #8 | #9 | #10 | ||
| +2.7 | M2 | M1 | M1 | M1 | S1Je | I | I | Pir | Pir | O |
|
| +1.7 | M2 | M1 | M1 | S1Je | S1Je | S1Je | I | Pir | Pir | O | |
| −0.3 | M1 | S1HL | S1FL | S1BF | S1BF | S2 | I | Pir | Pir | O | |
| −0.8 | M1 | S1HL | S1BF | S1BF | S1BF | S2 | I | Pir | Pir | O | |
| −1.3 | M1 | S1HL | S1BF | S1BF | S1BF | S2 | I | Pir | A | ||
| −1.8 | M1 | S1HL | S1BF | S1BF | S1BF | S2 | I | Pir | A | ||
| −3.3 | M1 | S1Tr | S1Tr | S1BF | S2 | Au | PRh | Pir | A | ||
| −4.3 | RSA | PtA | PtA | S1BF | Au | Au | PRh | Pir | A | ||
| −5.3 | RSA | V2 | V2 | V2 | Au | Au | PRh | Pir | A | ||
| −5.8 | RSA | V2 | V1 | V2 | Au | Au | PRh | Pir | |||
| −6.3 | RSA | V1 | V1 | V2 | Au | Au | PRh | Ent | |||
| −7.3 | RSA | V1 | V1 | V2 | TeA | PRh | Ent | ||||
| −8.3 | RSA | V1 | V1 | TeA | PRh | Ent | |||||
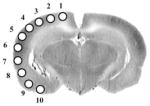
Rows represent coronal slices from rostral to caudal, with distances to bregma in millimeters. Within each slice cortical locations #1–10 are depicted from medial to lateral, as shown in a representative slice (AP −5.8 mm). Shaded cells represent group differences significant at the P < 0.01 level. Cells depicted as white text on a black background represent increases in CBF-TR compared to controls (Z scoreTone minus Z scoreControl < 0). Cells depicted black text on a gray background represent decreases in CBF-TR (Z scoreTone minus Z scoreControl < 0). Abbreviations of the anatomic regions are as defined in Fig. 1.
Table 2.
Statistical parametric maps of group differences between Z scores of regional cortical blood flow related tissue radioactivity (CBF-TR) of the rats exposed to the foot-shock and controls
| Bregma (mm) | Locations within a slice → | |||||||||
|---|---|---|---|---|---|---|---|---|---|---|
| #1 | #2 | #3 | #4 | #5 | #6 | #7 | #8 | #9 | #10 | |
| + 5.2 | FrA | FrA | FrA | FrA | FrA | O | O | O | O | O |
| + 4.9 | FrA | FrA | FrA | FrA | FrA | OF | O | O | O | O |
| + 4.6 | FrA | FrA | FrA | FrA | FrA | OF | O | O | O | O |
| + 4.3 | M2 | M2 | M2 | M2 | M2 | OF | OF | O | O | O |
| + 4.0 | M2 | M2 | M2 | M2 | M2 | OF | OF | O | O | O |
| + 3.7 | M2 | M2 | M1 | M1 | M1 | I | I | Pir | Pir | O |
| + 3.4 | M2 | M1 | M1 | M1 | M1 | M1 | I | Pir | Pir | O |
| + 3.1 | M2 | M1 | M1 | M1 | M1 | M1 | I | Pir | Pir | O |
| + 2.8 | M2 | M1 | M1 | M1 | S1Je | I | I | Pir | Pir | O |
| + 2.5 | M2 | M1 | M1 | M1 | S1Je | I | I | Pir | Pir | O |
| + 2.2 | M2 | M1 | M1 | S1Je | S1Je | S1Je | I | Pir | Pir | O |
| + 1.9 | M2 | M1 | M1 | S1Je | S1Je | S1Je | I | Pir | Pir | O |
| + 1.6 | M2 | M1 | M1 | S1Je | S1Je | S1Je | I | Pir | Pir | O |
| + 1.3 | M2 | M1 | S1FL | S1Je | S1Je | S1Je | I | Pir | Pir | O |
| + 1.0 | M2 | M1 | S1FL | S1Je | S1Je | S1Je | I | Pir | Pir | O |
| + 0.7 | M2 | M1 | S1FL | S1Je | S1Je | S1Je | I | Pir | Pir | O |
| + 0.4 | M2 | M1 | S1FL | S1Je | S1Je | S2 | I | Pir | Pir | O |
| + 0.1 | M2 | M1 | S1FL | S1Je | S1Je | S2 | I | Pir | Pir | O |
| −0.2 | M1 | S1HL | S1FL | S1BF | S1BF | S2 | I | Pir | Pir | O |
| −0.5 | M1 | S1HL | S1FL | S1BF | S1BF | S2 | I | Pir | Pir | O |
| −0.8 | M1 | S1HL | S1BF | S1BF | S1BF | S2 | I | Pir | Pir | O |
| −1.1 | M1 | S1HL | S1BF | S1BF | S1BF | S2 | I | Pir | A | |
| −1.4 | M1 | S1HL | S1BF | S1BF | S1BF | S2 | I | Pir | A | |
| −1.7 | M1 | S1HL | S1BF | S1BF | S1BF | S2 | I | Pir | A | |
| −2.0 | M1 | S1HL | S1BF | S1BF | S1BF | S2 | I | Pir | A | |
| −2.3 | M1 | S1Tr | S1Tr | S1BF | S1BF | S2 | I | Pir | A | |
| −2.6 | M1 | S1Tr | S1Tr | S1BF | S1BF | S2 | I | Pir | A | |
| −2.9 | M1 | S1Tr | S1Tr | S1BF | S1BF | S2 | PRh | Pir | A | |
| −3.2 | M1 | S1Tr | S1Tr | S1BF | S2 | Au | PRh | Pir | A | |
| −3.5 | M1 | S1Tr | S1BF | S1BF | Au | Au | PRh | Pir | A | |
| −3.8 | PtA | PtA | PtA | S1BF | Au | Au | PRh | Pir | A | |
| −4.1 | RSA | PtA | PtA | S1BF | Au | Au | PRh | Pir | A | |
| −4.4 | RSA | PtA | PtA | S1BF | Au | Au | PRh | Pir | A | |
| −4.7 | RSA | V2 | V2 | PtA | Au | Au | PRh | Pir | A | |
| −5.0 | RSA | V2 | V2 | V2 | Au | Au | PRh | Pir | A | |
| −5.3 | RSA | V2 | V2 | V2 | Au | Au | PRh | Pir | A | |
| −5.6 | RSA | V2 | V1 | V2 | Au | Au | PRh | Pir | A | |
| −5.9 | RSA | V2 | V1 | V2 | Au | Au | PRh | Pir | ||
| −6.2 | RSA | V1 | V1 | V2 | Au | Au | PRh | Ent | ||
| −6.5 | RSA | V1 | V1 | V2 | Au | Au | PRh | Ent | ||
| −6.8 | RSA | V1 | V1 | V2 | V2 | TeA | PRh | Ent | ||
| −7.1 | RSA | V1 | V1 | V2 | V2 | TeA | PRh | Ent | ||
| −7.4 | RSA | V1 | V1 | V2 | TeA | PRh | Ent | |||
| −7.7 | RSA | V1 | V1 | V2 | TeA | PRh | Ent | |||
| −8.0 | RSA | V1 | V1 | V2 | TeA | PRh | Ent | |||
| −8.3 | RSA | V1 | V1 | TeA | PRh | Ent | ||||
Rows represent coronal slices from rostral to caudal, with distances to bregma in millimeters. Within each slice (rows) cortical locations #1–10 are depicted from medial to lateral, as shown in the figure inset of Table 1. Shaded cells represent group differences significant at the P < 0.05 level by italics or at the P < 0.005 level by bold and underlined. Cells depicted as white text on a black background represent significant increases in CBF-TR compared to controls (Z scoreShock minus Z scoreControl < 0). Cells depicted as black text on a gray background represent significant decreases in CBF-TR (Z scoreShock minus Z scoreControl < 0). Abbreviations of the anatomic regions are as defined in Fig. 1.
As lateralization was not seen in the autoradiographs, tissue radioactivity values were averaged at each location across the hemispheres. Group means and standard deviations were calculated for each location, each slice (all locations in a given slice), and globally (all locations in all slices). Tissue radioactivity group differences in slice and global averages were assessed by t-tests (two-tailed, P < 0.05). In addition, a Z-score transformation was performed on the tissue radioactivity data to produce patterns of regional tracer concentrations for each animal [2]. Regional CBF Z scores of animals exposed to the acoustic challenge or to the foot-shocks were compared to their respective controls using t-tests (two-tailed, P < 0.05).
Animals exposed to the auditory challenge compared to controls showed a redistribution of CBF-TR, with significant increases in Z scores in auditory and perirhinal cortex, and a significant decrease in barrel field cortex (P < 0.01, Fig. 1A and Table 1). There were no significant changes in frontal, occipital or allocortex (olfactory, piriform, entorhinal), or the cortical amygdaloid nucleus.
Fig. 1.

Maps of the color-coded average Z-score differences for (A) rats exposed to an acoustic challenge and control animals exposed to no tone, i.e. Z scoreTone minus Z scoreControl; and (B) rats exposed to electric shock and control animals, i.e. Z scoreShock minus Z scoreControl. In these two-dimensional maps of the flattened cortex, the x- and y-coordinates are obtained from measures of the anatomical distances within the autoradiographs. The x-axis (locations) represents lateral distance from the midline (in mm) along the cortical rim within a slice. The y-axis (slices) represents coronal slices, numbered from rostral to caudal, with distance relative to bregma in millimeters (positive values being rostral to this landmark). Coronal sections used to generate the figures are described in Tables 1 and 2. To avoid discontinuities in the graphic representation, the space between each coronal slice and the 12–20 locations within each slice, where there were no measurements, was filled with values calculated by linear interpolation (IMaximum interpolation distance 1000 μm). Superimposed on the maps are the borders of the main cortical areas [14]: A, cortical amygdaloid nucleus; Au, auditory; Ent, entorhinal; FrA, frontal association; I, insular; M1, primary motor; M2, secondary motor; O, olfactory; OF, orbital frontal; PtA, parietal association; Pir, piriform; PRh, perirhinal; RSA, retrosplenial. Primary somatosensory mapping: S1FL, the forelimbs; S1HL, the hindlimbs; S1TR, the trunk; S1BF, the barrel fields; S1J, the jaw, lip, and oral region. S2, secondary somatosensory; TeA, temporal association; V1, primary visual; V2, secondary visual.
Animals exposed to the foot-shock also showed a redistribution of CBF-TR compared to controls (Fig. 1B and Table 2). Significant increases in Z scores (range P < 0.005 to P < 0.05) were seen in lateral primary visual cortex, as well as all of secondary visual cortex, medial primary motor cortex, parietal association cortex, and primary somatosensory areas mapping the trunk. Significant decreases in Z scores (range P < 0.005 to P < 0.05) were seen in lateral primary motor cortex, anterior-lateral aspects of secondary motor cortex, prefrontal association cortex, primary somatosensory cortex mapping the jaw/oral region, the forelimbs, and posterior areas of the barrel fields, as well as secondary somatosensory cortex and lateral auditory cortex. There were no statistical differences between the shock and control group (or the acoustic group and its control group) in non-transformed CBF-TR.
Our results during the auditory challenge confirm classical electrophysiological and metabolic studies [3,6, 15] of functional activation of auditory cortex during tone exposure, as well as work by LeDoux et al., who in immobilized rats using [14C]iodoantipyrine, demonstrated increases in cerebral blood flow in the auditory area of the cortex [10]. Responses in rat auditory cortex are typically narrowly tuned to sound frequency and are organized in a precisely tonotopic fashion. The largest increase in CBF-TR in our study was noted in the caudal portions of auditory cortex. This area has been shown by others using microelectrode mapping techniques to represent sound frequencies in the lower four octaves (from ~0.5 to 8 kHz), consistent with the frequencies used in the current auditory challenge [3].
Changes in functional activation of the cerebral cortex during acute stress have previously not been examined extensively. Generalized increases in brain [14C]2-deoxyglucose utilization have been previously reported in tethered rats exposed to 10 min [1] or 45 min [5] of intermittent foot-shock. In our study, delivery of six foot-shocks in less than 1 min to freely moving animals resulted in a distinct pattern of cortical activation. Increases in CBF-TR centered about visual cortex and parietal association cortex, and extended into primary motor cortex (posterior medial), and primary somatosensory cortex mapping the trunk. The dominant activation of visual cortex suggests extensive visual scanning of the animal of the cage, possibly for purposes of locating an escape route. The pattern of activation of motor cortex is consistent with the motor jumping response elicited in the animal in response to the shock. This pattern appeared most robustly in posterior primary motor cortex, and differed from that reported by us in an additional independent validation of our methods in rats walking on a treadmill [8]. During treadmill walking, CBF-TR increases most significantly in anterior primary motor cortex, with additional increases in primary somatosensory cortex mapping the forelimbs, hindlimbs and trunk, as well as in secondary visual cortex [8]. In the foot-shock paradigm, decreases in CBF-TR were also noted in primary somatosensory cortex mapping the jaw, secondary somatosensory cortex, as well as the lateral barrel fields, suggesting a possible redistribution of blood flow away from these areas.
There were no significant changes in CBF-TR in the cortical amygdaloid nucleus in response to shock. A large body of literature has documented the importance of the amygdala in the formation of conditioned fear memory, as elicited by footshock. This discrepancy may be understood in light of the fact that conditioned fear memory, usually tested at 24 h after shock delivery, appears mediated by actions in the basolateral complex and central nucleus, rather than in the cortical nucleus of the amygdala [4].
Our study shows that remote activation of an implantable infusion pump allows administration of a radiotracer without the need for tethering or immobilization. Results from our earlier studies suggest that use of the MIP can achieve a temporal resolution of ~12 s [7,8], and autoradiography typically offers a spatial resolution of 0.1 mm. For behaviors in small animals that can be sustained on the order of 10 or more seconds, the MIP opens the possibility for exploration of functional brain activation of complex behaviors involving animal locomotion, which have remained largely inaccessible to other brain mapping techniques.
Acknowledgments
Supported by the NIBIB (RO1 EB-00300-03), the Whitaker Foundation (RG-99-0331), and the Veterans Administration.
References
- 1.Bryan RM, Page RB. The effect of stress on regional cerebral glucose utilization in rats [abstract] Stroke. 1984;15:193. [Google Scholar]
- 2.Clark C, Carson R, Kessler R, Margolin R, Buchsbaum M, DeLisi L, King C, Cohen R. Alternative statistical models for the examination of clinical positron emission tomography/fluorodeoxyglucose data. J Cereb Blood Flow Metab. 1985;5:142–150. doi: 10.1038/jcbfm.1985.18. [DOI] [PubMed] [Google Scholar]
- 3.Doron NN, Ledoux JE, Semple MN. Redefining the tonotopic core of rat auditory cortex: physiological evidence for a posterior field. J Comp Neurol. 2002;453:345–360. doi: 10.1002/cne.10412. [DOI] [PubMed] [Google Scholar]
- 4.Fendt M, Fanselow MS. The neuroanatomical and neurochemical basis of conditioned fear. Neurosci Biobehav Rev. 1999;23:743–760. doi: 10.1016/s0149-7634(99)00016-0. [DOI] [PubMed] [Google Scholar]
- 5.Gescuk B, Lang S, Porrino LJ, Kornetsky C. The local cerebral metabolic effects of morphine in rats exposed to escapable footshock. Brain Res. 1994;663:303–311. doi: 10.1016/0006-8993(94)91277-7. [DOI] [PubMed] [Google Scholar]
- 6.Gonzalez-Lima F, Scheich H. Functional activation in the auditory system of the rat produced by arousing reticular stimulation: a 2-deoxyglucose study. Brain Res. 1984;299:201–214. doi: 10.1016/0006-8993(84)90702-9. [DOI] [PubMed] [Google Scholar]
- 7.Holschneider DP, Maarek JM, Harimoto J, Yang J, Scremin OU. An implantable bolus infusion pump for use in freely moving, nontethered rats. Am J Physiol Heart Circ Physiol. 2002;283:H1713–H1719. doi: 10.1152/ajpheart.00362.2002. [DOI] [PMC free article] [PubMed] [Google Scholar]
- 8.Holschneider DP, Maarek JM, Yang J, Harimoto J, Scremin OU. Functional brain mapping in freely moving rats during treadmill walking. J Cereb Blood Flow Metab. 2003;23:925–932. doi: 10.1097/01.WCB.0000072797.66873.6A. [DOI] [PMC free article] [PubMed] [Google Scholar]
- 9.Jones SC, Korfali E, Marshall SA. Cerebral blood flow with the indicator fractionation of [14C]iodoantipyrine: effect of PaCO2 on cerebral venous appearance time. J Cereb Blood Flow Metab. 1991;11:236–241. doi: 10.1038/jcbfm.1991.55. [DOI] [PubMed] [Google Scholar]
- 10.LeDoux JE, Thompson ME, Iadecola C, Tucker LW, Reis DJ. Local cerebral blood flow increases during auditory and emotional processing in the conscious rat. Science. 1983;221:576–578. doi: 10.1126/science.6867731. [DOI] [PubMed] [Google Scholar]
- 11.Neitz J, Jacobs GH. Reexamination of spectral mechanisms in the rat (Rattus norvegicus) J Comp Psychol. 1986;100:21–29. [PubMed] [Google Scholar]
- 12.Ohata M, Fredericks WR, Sundaram U, Rapoport SI. Effects of immobilization stress on regional cerebral blood flow in the conscious rat. J Cereb Blood Flow Metab. 1981;1:187–194. doi: 10.1038/jcbfm.1981.19. [DOI] [PubMed] [Google Scholar]
- 13.Patlak CS, Blasberg RG, Fenstermacher JD. An evaluation of errors in the determination of blood flow by the indicator fractionation and tissue equilibration (Kety) methods. J Cereb Blood Flow Metab. 1984;4:47–60. doi: 10.1038/jcbfm.1984.7. [DOI] [PubMed] [Google Scholar]
- 14.Paxinos G, Watson C. The Rat Brain in Stereotactic Coordinates. 4. Academic Press; New York: 1998. [Google Scholar]
- 15.Roger M, Arnault P. Anatomical study of the connections of the primary auditory area in the rat. J Comp Neurol. 1989;287:339–356. doi: 10.1002/cne.902870306. [DOI] [PubMed] [Google Scholar]