

Abstract
The neurobiology of obesity is poorly understood. Here we report findings of a study designed to examine the differences in brain regional gray matter volume in adults recruited as either Obese Prone or Obese Resistant based on self-identification, body mass index, and personal/family weight history. Magnetic resonance imaging was performed in 28 Obese Prone (14 male, 14 female) and 25 Obese Resistant (13 male, 12 female) healthy adults. Voxel-based morphometry was used to identify gray matter volume differences between groups. Gray matter volume was found to be lower in the insula, medial orbitofrontal cortex and cerebellum in Obese Prone, as compared to Obese Resistant individuals. Adjusting for body fat mass did not impact these results. Insula gray matter volume was negatively correlated with leptin concentration and measures of hunger. These findings suggest that individuals at risk for weight gain have structural differences in brain regions known to be important in energy intake regulation, and that these differences, particularly in the insula, may be related to leptin.
Keywords: Voxel-based morphometry, Magnetic resonance imaging, Obesity risk, Insula, Orbitofrontal cortex, Leptin
Introduction
Obesity is a serious public health problem of dramatically rising prevalence in recent decades in the United States and the world, with currently over 65% of adults in the U.S. classified as either overweight or obese (Flegal, Carroll, Kit, & Ogden, 2012; Shields, Caroll, & Odgen, 2011). Early studies of obesity focused on metabolic differences between obese and non-obese persons; however, advances in structural and functional neuroimaging techniques have recently begun to shed light on neuroanatomical and neurophysiological factors that may be related to obesity.
Most functional magnetic resonance imaging (fMRI) studies on obesity have focused on how the condition alters the cortical response to food cues (Carnell, Gibson, Benson, Ochner, & Geliebter, 2012; Cornier, 2011; Cornier et al., 2009; Martin et al., 2010; McCaffery et al., 2009; Neary & Batterham, 2010; Rosenbaum, Sy, Pavlovich, Leibel, & Hirsch, 2008; Rothemund et al., 2007; Stoeckel et al., 2008; Van den Eynde & Treasure, 2009; Wallner-Leibmann et al., 2010). These studies have generally found increased responses to both visual and olfactory cues associated with high-calorie foods in obesity. Regions of increased response include the limbic areas such as the hypothalamus, amygdala, hippocampus, orbitofrontal cortex, and insula (Martin et al., 2010; Rothemund et al., 2007; Stoeckel et al., 2008). Furthermore, in a study of reduced-obese persons, i.e. formerly obese subjects who have lost weight, a decreased ability to “turn off” response to food cues after overfeeding was observed compared to thin controls (Cornier et al., 2009). These studies suggest that obesity is not only associated with altered response to food cues, but also a deficit in the ability to modulate this response based on metabolic need.
In a small number of studies, MRI has also been used to examine brain structure in human obesity. Pannacciulli et al. (2006) found that obese subjects had reduced gray matter (GM) volume in cerebellum, frontal operculum, postcentral gyrus, putamen, and middle frontal gyrus. In the same subjects, leptin concentration was also found to be negatively correlated with GM volume in the inferior frontal operculum, postcentral gyrus, and putamen, and positively correlated with GM volume in the inferior temporal gyrus and cerebellum (Pannacciulli, Le, Chen, Reiman, & Krakoff, 2007). More recent studies have shown negative correlations between GM volume and waist circumference in a variety of anterior and posterior cortical areas (Kurth et al., 2012), a negative correlation of BMI and future BMI with overall brain volume (Yokum, Ng, & Stice, 2012) and an association between reduced orbitofrontal cortex volume and executive dysfunction in obese adolescents (Maayan, Hoogendoorn, Sweat, & Convit, 2011).
Although previous neuroimaging research has shown that the obese phenotype is associated with structural and functional brain alterations, it is unknown if these changes are a core feature of the condition that gives rise to an obese phenotype, i.e. are present in “at risk” individuals, or are simply a consequence of excess body fat. Current understanding of the condition suggests that both environmental and genetic factors confer risk of obesity (Hill, Wyatt, & Melanson, 2000; Peters, Wyatt, Donahoo, & Hill, 2002); however, not everyone in a similar environment is obese or overweight, suggesting that resistance to the condition must be conferred through an endogenous mechanism (Bessesen, Bull, & Cornier, 2008). In the present study, we used whole brain voxel-based morphometry (VBM) to examine structural brain differences between Obese Prone (OP) and Obese Resistant (OR) individuals. Subjects were empirically classified as OR or OP based on personal and family weight history, as defined previously (Schmidt, Harmon, Sharp, Kealey, & Bessesen, 2012). Studying OP, as opposed to already obese or reduced-obese individuals, reveals structural brain differences that may precede weight gain and obesity and therefore could be a causative mechanism and/or be used as a predictor of obesity risk. In addition to the whole-brain VBM analysis, given previous findings implicating the insula in obesity (Carnell et al., 2012; Cornier et al., 2009), we hypothesized that GM volume in this region may relate to plasma leptin concentration and ratings of hunger after a meal. Specifically, we hypothesized that these factors would predict structural differences in the insula as well as other regions essential for maintenance and awareness of homeostatic balance.
Methods
Ethics statement
This study was conducted according to the principles expressed in the Declaration of Helsinki and was approved by the Colorado Multiple Institutional Review Board. All patients provided written informed consent for the collection of samples and subsequent analysis.
Subjects
Subjects were healthy men and women without eating disorders aged 25–40 empirically classified as either obesity resistant (OR) or obesity prone (OP) as previously defined (Schmidt et al., 2012). Specifically, OR subjects responded to advertisements for “naturally thin people”. They defined themselves as constitutionally thin based on their perception of difficulty gaining weight, expending little effort to maintain their current body weight and reporting a sense that their weight regulation was “different” from other people. These subjects were recruited to have a low to normal BMI (17–25 kg/m2, mean 21 ± 2 kg/m2), no reported first degree relatives with a history of obesity, never being overweight, weight stability (less than ±10 lbs) by self-report despite few to no attempts to lose weight, and no high levels of physical activity (fewer than 3 h per week of planned physical activity). OP subjects in contrast responded to advertisements for “people who struggle with their weight” and defined themselves as chronically struggling with body weight control. They were recruited to have a BMI of 20–30 kg/m2 (mean 26.2 ± 2.0 kg/m2), at least one first degree relative with a reported history of obesity, a history of past weight fluctuations (by ±10 lbs or more) despite putting effort into not gaining weight and previous attempts to lose weight, but were not actively attempting to lose weight and were weight stable for at least 3 months before being studied. OR and OP subjects were matched for sex, age (± 2 years), and ethnicity/race. Subjects were right-handed and could not have MRI exclusions. Twenty-five OR individuals (13 men, 12 women) and 28 OP individuals (14 men, 14 women) underwent MRI scanning (Table 1).
Table 1.
Subject characteristics and clinical measures.
| Obese Resistant | Obese Prone | p-Value | |
|---|---|---|---|
| N (M/F) | 25 (13/12) | 28 (14/14) | |
| Age | 31.32 ± 3.45 | 30.29 ± 3.81 | 0.3 |
| Body fat mass (kg) | 14.70 ± 13.73 | 23.77 ± 11.31 | 0.012 |
| Percent body fat mass | 18.66 ± 4.60 | 28.59 ± 8.18 | <0.001 |
| Body mass index | 20.96 ± 1.99 | 26.19 ± 2.90 | <0.001 |
| Leptin conc (ug/L) | 3.91 ± 2.89 | 11.42 ± 7.27 | <0.001 |
| Hunger ratings after a meal (mm/180 min)* | 8129 ± 3529 | 8679 ± 3455 | 0.55 |
Mean ± SD.
Hunger score after eating a prescribed breakfast was accessed using visual analog scales, with area under the curve (AUC) calculated using the trapezoid method. Higher scores indicate more hunger (and thus less satiety) after a meal.
Study design and measurements
Subjects first underwent baseline assessment of body composition measurement by dual-energy x-ray absorptiometry (DPX whole-body scanner, Lunar Radiation Corp., Madison, WI). After a 4-day eucaloric run-in diet (50% carbohydrate, 30% fat, and 20% protein) to ensure energy and macronutrient balance, subjects were studied after an overnight fast. Estimates of daily energy needs were made using lean body mass plus an activity factor. All food was prepared and provided by the University of Colorado Clinical and Translational Research Center (CTRC) kitchen. Subjects presented to the CTRC every morning for 4 days to pick up their eucaloric diet. They were weighed, ate breakfast, and picked up the remainder of their daily meals in coolers. They were asked to return any uneaten food, which was then measured and incorporated into their next day of food. Subjects were asked to maintain their usual pattern of physical activity and were regularly questioned regarding activity and compliance. Subjects were asked to not consume any alcoholic or calorie-containing beverages during the study period. In women, studies were performed in the follicular phase of their menstrual cycle.
Study day
Subjects presented to the outpatient clinic of the CTRC after an overnight fast. They were weighed, had fasting blood samples drawn for leptin concentration as determined by radioimmunoassay (Linco Research, Inc., St. Charles, MO) and completed baseline hunger ratings by visual analog scale (VAS). Hunger was rated by VAS on a line preceded by the question, “How hungry are you right now?” and anchored on the left by “not at all hungry” and by “extremely hungry” on the right. Subjects were then escorted to the Brain Imaging Center where they underwent fasting MRI measures. Subjects then consumed a liquid breakfast meal over 20 min. The caloric content of the liquid breakfast was equal to 25% of the energy provided during the run-in diet and had an identical macronutrient composition. Repeat hunger ratings by VAS were then performed 30, 60, 90, 120, 150, and 180 min after the meal. The area under the curve (AUC) for hunger was calculated using the trapezoid method.
Image acquisition
MR scanning was performed on a 3T whole body MR scanner (General Electric, Milwaukee, WI) with a standard quadrature head coil. A high resolution three-dimensional T1-weighted structural MRI was acquired for each participant using a spoiled gradient echo (SPGR-IR) sequence with the following parameters: repetition time = 5.5 ms, echo time = 1.5 ms, flip angle = 10°, 2562 matrix, 240 mm2 field-of-view (0.9 × 0.9 mm2 in-plane), 1.2-mm thick slice, 174 slices, coronal plane. Scan time was 5 min 39 s.
Image preprocessing
Data preprocessing was conducted with Statistical Parametric Mapping 8 software (SPM8; http://www.fil.ion.ucl.ac.uk/spm) and the VBM8-toolbox (http://dbm.neuro.uni-jena.de/vbm.html) with default settings. The VBM8-toolbox is an extension of the unified segmentation model (Ashburner & Friston, 2005) in which structural images are bias corrected, segmented into white matter, GM, and cerebrospinal fluid, and registered combined within the same model. The images were bias corrected to remove noise and inhomogeneities with a spatially Adaptive Nonlocal Means (SANLM) filter (Manjon, Coupe, Marti-Bonmati, Collins, & Robles, 2010). To further improve signal-to-noise ratio, a spatial constraint (incorporated in the segmentation procedure) was applied based on a classical Markov Random Field (MRF) model (Cuadra, Cammoun, Butz, Cuisenaire, & Thiran, 2005). Registration to standard MNI-space consisted of a linear affine transformation and a nonlinear deformation using high-dimensional DARTEL normalization (Ashburner, 2007). This procedure uses the DARTEL template of 550 healthy control participants (defined by default settings in VBM8). A nonlinear deformation was applied to the normalized segmented images to correct for individual differences in brain volume. Normalized unsegmented images were visually inspected for quality assurance. Finally, the segmented images were spatially smoothed with an 8 mm full-width-half-maximum Gaussian kernel.
Data analysis
Demographics and scores on hunger questionnaires were compared between groups with standard t-tests for independent samples. Statistical analyses of the structural MRI images were conducted in SPM8.
The primary comparison of OP to OR GM volume was performed as a whole-brain analysis, using a t-test with a voxel-level threshold of p < 0.001, and a cluster-level threshold of p < 0.05, corrected for multiple comparisons with family-wise error (FWE), using age and gender as covariates. GM volume values for plots were extracted for each subject at the local maximum at each significant cluster using the Marsbar toolbox (Brett, Anton, Valabregue, & Poline, 2002) in SPM8. All GM values in plots were normalized by dividing each value by the group mean.
The relationship between insula GM volume and hormone and behavioral measures was evaluated using a multiple regression analysis in SPM8, with age and gender as covariates. The region of interest (ROI) analysis was performed with the Marsbar toolbox, using insula ROIs (right and left) generated from the WFU Pickatlas (Maldjian, Laurienti, Kraft, & Burdette, 2003). The insula was chosen as an ROI based on previously published functional imaging data showing alterations in functional response of this region to food cues after overeating in reduced-obese individuals (Cornier et al., 2009), and the likelihood that differences in brain structure are related to differences in function (Carnell et al., 2012). The mean GM volume across each structure was examined.
Analyses also were performed with body fat mass (total and percent) as an additional covariate. BMI was not used as a covariate, as (1) BMI was chosen as a criterion for characterizing the two groups, and thus is not valid statistically as a covariate, and (2) BMI is an artificial construct that may be influenced by body fat mass-independent factors (e.g. muscle mass); thus body fat mass provides a more accurate measure of adiposity. However, to help rule out the effect of BMI, analyses were also conducted using OP subjects with BMIs of 27 or lower (20 individuals, 10 men, 10 women).
Results
Subject characteristics
Twenty-five OR (13M/12F, age 31.32 ± 3.45) and 28 OP (14M/14F, age 30.29 ± 3.81) subjects were studied. Compared to OR subjects, OP subjects had higher body fat mass (p = 0.012), percent body fat mass (p < 0.001), BMI (p < 0.001), and plasma leptin levels (p < 0.001) (Table 1). No significant difference was observed between OP and OR subjects in hunger ratings in response to a meal (p = 0.55, Table 1).
Comparison of regional GM between OR and OP subjects
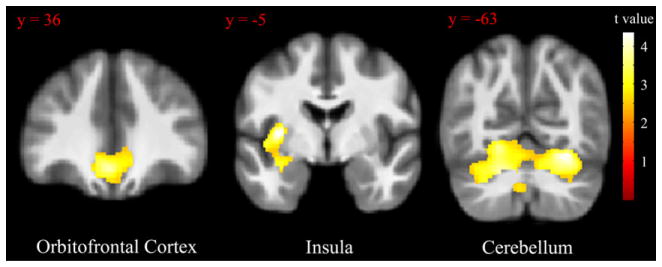
Compared to OR subjects, OP subjects showed reduced GM volume in the orbitofrontal cortex {peak coordinate [x,y, z (mm)] = (−3, 30,−14), k = 1411, t = 4.77}, left insula {peak coordinate [x,y, z (mm)] = (−33,−4, 4), k = 2295, t = 5.43}, and cerebellum {peak coordinate [x,y,z (mm)] = (22,−60,17), k = 8738, t = 4.77} (Fig. 1). Adjusting for percent body fat mass did not significantly affect any of these results (partial F-tests: orbitofrontal cortex, F1,47 = 0.21, p = 0.65; left insula, F1,47 = 0.025, p = 0.88; cerebellum, F1,47 = 0.014, p = 0.90). In addition, adjusting for total body fat mass did not significantly affect any of these results (partial F-tests: orbitofrontal cortex, F1,47 = 2.14, p = 0.15; left insula, F1,47 = 0.024, p = 0.88; cerebellum, F1,47 = 0.095, p = 0.76). At a more liberal statistical threshold of p < 0.01, insula differences were also observed to be bilateral {peak right insula coordinate [x,y, z (mm)] = (38, 4, 0), t = 3.24}. Restricting analysis to OP subjects with BMI 27 and below, OP subjects still showed reduced GM volume in the orbitofrontal cortex {peak coordinate [x,y, z (mm) = (−3, 30,−14), k = 4661, t = 4.35}, left insula {peak coordinate [x,y,z (mm)] = (−33,−4, 4), k = 4222, t = 4.34} and cerebellum{left peak coordinate [x,y, z (mm)] = (−20,−58,−30), t = 3.94; right peak coordinate [x,y,z (mm)] = (28,−63,−17), t = 4.3; k = 14021 (all one cluster)} (Fig. 4). These data indicate a significant GM volume reduction in these regions after controlling for age, gender and total brain volume in OP subjects compared to OR subjects and that these effects were not influenced by body fat mass.
Fig. 1.

Regions with reduced GM volume between OR and OP subjects. GM values were normalized and adjusted for effects of age, sex, and total brain volume. Statistical maps were thresholded at p < 0.001 for visualization and overlaid onto the group average image. Data are shown in the neurologic convention (R on R). Error bars represent the standard deviation.
Fig. 4.
Regions with reduced GM volume between OR and OP subjects, with analysis restricted to OP subjects with BMI = 27 and below. GM values were normalized and adjusted for age, sex, and total brain volume. Statistical maps were thresholded at p < 0.01 for visualization and overlaid onto the group average image. Data are shown in the neurologic convention (R on R).
Regional GM volume: effects of sex
There was a significant effect of sex on GM volume in left insula (coefficient: β = −0.36, t = 3.49, p = 0.001) and cerebellum (coefficient: β = −0.32, t = 2.89, p = 0.006), with men showing lower GM volume than women in these areas. No significant effect of sex on GM volume in OFC (coefficient: β = −0.11, t = 0.81, p = 0.42) was observed. No significant sex by group (OR vs OP) interaction was observed.
Correlates of GM with plasma leptin and hunger
Across all subjects, a significant negative correlation was observed between plasma leptin concentration and GM volume in the left insula {peak coordinate [x,y, z (mm)] = (−35,0, 2), k = 2608, r = 0.43, p = 0.002} (Fig. 2). Furthermore, a significant negative correlation was observed between hunger ratings in response to a meal and GM volume in the right insula {peak coordinate [x,y, z (mm)] = (38, 2, 6), k = 793, r = 0.33, p = 0.018} across all subjects (Fig. 3). Adjusting for fat mass did not significantly affect any of these results (partial F-tests: leptin, F1,42 = 0.004, p = 0.94; hunger AUC, F1,42 = 0.79, p = 0.38). These results indicate that, across all subjects, GM volume in the insula showed a significant inverse relationship with leptin concentration and with scores of hunger after controlling for age, gender, and total brain volume, and that these effects were not influenced by body fat mass.
Fig. 2.
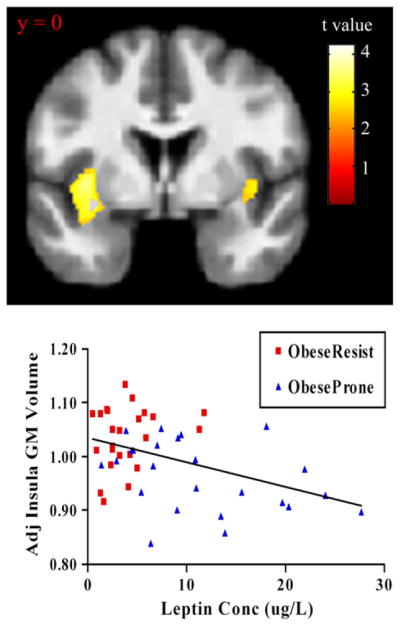
Insula volume correlation with plasma leptin concentration. GM values were normalized and adjusted for age, sex, and total brain volume. Statistical maps were thresholded at p < 0.01 for visualization and overlaid onto the group average image. Data are shown in the neurologic convention (R on R).
Fig. 3.
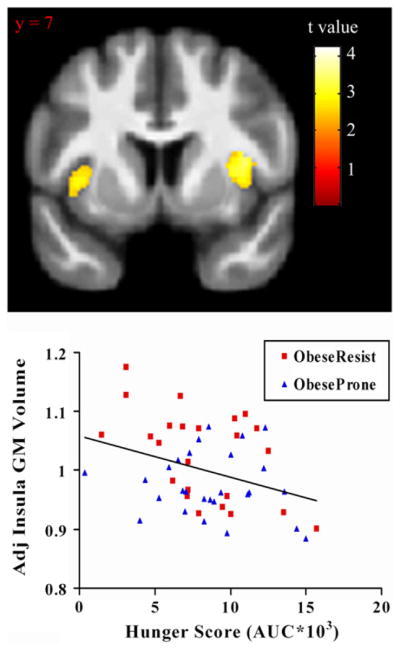
Insula volume correlation with hunger score after a meal. GM values were normalized and adjusted for age, sex, and total brain volume. Statistical maps were thresholded at p < 0.01 for visualization and overlaid onto the group average image. Data are shown in the neurologic convention (R on R).
Discussion
The primary findings of the present study are that, after controlling for age, sex, and total GM volume, (1) GM volume is reduced in the OFC, insula, and cerebellum in OP subjects relative to OR subjects, independent of fat mass (Fig. 1), (2)GM volume in the insula is inversely correlated with plasma leptin concentration (Fig. 2), (3)GM volume in the insula is inversely correlated with reported ratings of hunger after a meal (Fig. 3). These results suggest that structural architecture of the brain is altered in individuals prone to weight gain and obesity. In addition, the results suggest that reductions in insula GM volume are associated with altered hormonal and appetitive response. The finding that GM volume effects were not influenced by fat mass and were largely unchanged when analysis was restricted to OP subjects with lower BMIs suggests that the differences may represent a core feature of the propensity to weight gain and obesity and are not simply a byproduct of increased body fat.
The insula and OFC are part of a network of brain regions involved in homeostasis, reward and error processing, emotion, awareness of internal state, and behavioral inhibition, among other cognitive processes (Craig, 2009, 2010, 2011). In the context of feeding behaviors, pathology of this network may disrupt both hedonic and homeostatic processing, leading to an inability to regulate food intake and increasing risk of obesity. Indeed, obesity likely involves dysfunction in reward systems, in which the hedonic value of foods is not adaptively altered by metabolic demands (e.g. leading to increased appetite), as well as dysfunction in homeostatic signaling mechanisms that communicate changes in energy intake and energy demands from the body to the brain (Bessesen et al., 2008; Cornier et al., 2009).
The observed GM volume reduction in OFC in OP persons suggests that previously reported functional and structural differences of this region (Alkan et al., 2008; Cohen, Yates, Duong, & Convit, 2011; De Araujo, Kringelbach, Rolls, & Hobden, 2003; Hinton et al., 2004; Hollmann et al., 2011; Kringelbach, 2005; Kringelbach, O’Doherty, Rolls, & Andrews, 2003; O’Doherty et al., 2000; Pannacciulli, Le, Chen, Reiman, and Krakoff, 2007; Pannacciulli et al., 2006; Walther, Birdsill, Glisky, & Ryan, 2010) may occur prior to the onset of obesity. OFC activity is modulated by the perceived hedonic value of food (with higher activity for more rewarding foods) (Hollmann et al., 2011). OFC GM volume is reduced in obese adolescents (Maayan et al., 2011). Lower OFC volumes correlate with executive dysfunction and unhealthy food choices in obesity (Walther et al., 2010). Obese women show greater response of OFC to food cues after fasting than lean women (Stoeckel et al., 2008), and activation of the medial OFC is observed during anticipation of food reward in subjects with food addiction (Gearhardt et al., 2011). Importantly, the OFC receives input from all five major sensory pathways, and has reciprocal connections to limbic areas (hippocampus, amygdala), and the hypothalamus (Kringelbach, 2005); the region is thus well positioned to process the hedonic and homeostatic value of food reward (Kringelbach, 2005). Interestingly, the OFC volume reduction seen in OP individuals in the present study is predominately medial (x = −3; Fig. 1). The medial OFC has been shown to be associated with positive reinforcement (Kringelbach, 2005). It is thus possible to speculate that the GM volume reduction observed here may be associated with alterations in the ability to adjust behavior as a result of changes in the hedonic value of stimuli (e.g. food). Given its established role in inhibiting inappropriate responses (Elliot & Deakin, 2005), addictive behavior (Koob & Volkow, 2010), and executive function (Pessoa, 2010) loss of OFC integrity may negatively influence food-related decision-making in OP individuals.
Loss of GM volume was also observed in the insula, a region that has a direct reciprocal connection to the OFC (Kringelbach & Rolls, 2004). Numerous functional imaging studies have suggested that the insula plays a central role in feeding behaviors and the response to food cues and stimuli. The fasted or “hungry” state is associated with increased resting-state regional cerebral blood flow (rCBF) (Gautier et al., 2001; Hinton et al., 2004; Tataranni et al., 1999) and increased activity in response to visual food cues (Chechlacz et al., 2009; Cornier, Von Kaenel, Bessesen, & Tregellas, 2007; Fuhrer, Zysset, & Stumvoll, 2008; Killgore et al., 2003; Porubska, Veit, Preissl, Frische, & Birbaumer, 2006; Simmons, Martin, & Barsalou, 2005; St-Onge, Sy, Heymsfield, & Hirsch, 2005) in the insula. Insula activation is also correlated with the desire to eat as well as prospective food intake (Cornier et al. 2009; Porubska et al., 2006). Conversely, satiation is associated with reduced insula rCBF (Tataranni et al., 1999), and overfeeding diminishes the response of this region to visual food cues (Cornier et al., 2009). Insula response is also associated with memories about the hedonic properties of food, suggesting that it may be involved in stimulus-independent, endogenously triggered initiation of eating behavior (Levy, Henkin, Lin, Finley, & Schellinger, 1999; Pelchat, Johnson, Chan, Valdez, & Ragland, 2004). OP subjects appear to have diminished ability to down-regulate activity in the region in response to food cues during the overfed state (Cornier et al., 2009). The results of the present study suggest that structural abnormalities in this region are associated with dysfunctional regulation of this area, although it is unclear if these structural differences precede functional alterations.
The finding that GM volume in the insula is inversely correlated with plasma leptin concentration is important given that previous work has suggested that the hormone affects response in this area. For example, leptin-deficient and reduced obese adults show reduced activation in the insula while viewing pictures of foods after leptin replacement (Baicy et al., 2007; Rosenbaum et al., 2008). While leptin concentration is associated with group differences in insula GM volume observed in the present study, the differences seen here are independent of fat mass, suggesting that leptin is not acting solely as a surrogate marker of adiposity. These findings could suggest that relative leptin resistance occurs even at this early stage of overweight and that this may explain its association with differences in GM volume.
Insula GM volume was also inversely correlated with the hunger response to a meal in both OP and OR subjects. Given the importance of the insula in interoception (i.e. awareness of internal state), compromised GM integrity in this area may diminish its capacity to receive information about changes in energy balance after food consumption, and result in lingering feelings of hunger despite having recently eaten. Interestingly, the inverse correlation with hunger, a distinctly negative feeling, was right-lateralized, consistent with previous studies that have shown higher activation of right insula (relative to left) while experiencing negative emotions (Craig, 2005; Craig, 2009). The negative correlation was consistent across both OP and OR subjects and was not affected by fat mass, suggesting that structural GM-associated feelings of insatiability are independent of adiposity.
Previous work has shown reduced cerebellar GM volume in obese subjects (Pannacciulli et al., 2006) as well as a negative correlation between GM volume and waist circumference (Kurth et al., 2012). In regards to the present study, the loss of cerebellum GM volume in OP subjects independent of fat mass suggest that this loss is not a byproduct of increased body fat. Although the etiology of GM volume loss in this area is unclear, high fat diets result in decreased leptin receptor expression in the cerebellum in rats (Koros, Boukouvalas, Gerozissis, & Kitraki, 2009), and leptin receptor mediated signaling is neuroprotective in a number of rodent models (Avraham et al., 2011; Perez-Gonzalez et al., 2011; Signore, Zhang, Weng, Gao, & Chen, 2008). Future studies are needed to examine how leptin receptor expression and neuroprotection in the human cerebellum is affected by risk for obesity, diet, or body fat.
Men showed significantly reduced GM volume in the insula and cerebellum compared to women in the present study. Previous studies that have examined gender-based differences in GM volume have been inconsistent, perhaps due to inhomogeneity in the subject population or methodology (e.g. not using a whole brain volume correction). A recent study has shown increased GM volume in women in several areas, including orbitofrontal cortex, compared to men matched for whole brain volume (Luders, Gaser, Narr, & Toga, 2009). The functional significance of these differences is unclear, although men do show increased response in insula after chocolate satiation whereas women do not (Smeets et al., 2006).
There are several limitations to this study. While a strength of the study is that the we chose to measure these outcomes in people who were not yet obese but were selected for a propensity to gain weight or remain thin, it is difficult to determine the accuracy of the method we used in categorizing OP and OR individuals. Despite needing to meet specific criteria, much of the recruitment and characterization relied on the subject’s perception of their tendency to gain weight or not. These individuals will be followed prospectively to determine their weight trajectory over time. Furthermore, because the OP individuals had higher BMI and fat mass than the OR individuals, it is possible that the group differences seen may be related to the greater fat mass and not the classification of obesity proneness. Because, however, our two secondary analysis, one excluding OP individuals with higher BMI (>27) and the other adjusting for fat mass, did not alter the findings, the observed effects are likely not dependent on excess adiposity and therefore are potentially a marker of obesity risk.
Conclusion
The results of this study suggest that individuals who are at risk for weight gain have structural differences in brain regions known to be important in body weight regulation as compared to individuals who appear to be resistant to weight gain and obesity. This study also demonstrates that GM volume in the insula is inversely correlated with the plasma concentration of leptin and measures of hunger after a meal. These findings suggest that structural differences in cortical areas essential for regulation of food intake may be a core feature of weight gain and obesity risk, and that these structural changes may be related to leptin and eating behaviors.
Footnotes
Acknowledgments: We acknowledge and thank Debra Singel and Yiping Du of the University of Colorado Brain Imaging Center for their assistance with the MRI studies. We also thank the dietary services and metabolic kitchen of the University of Colorado Clinical Translational Research Center. This publication was supported by NIH/NCRR Colorado CTSI Grant No. UL1 RR025780, NIH/NIDDK Clinical Nutrition Research Unit Grant No. DK48520, and NIH/NIDDK Grant Nos. R01DK089095. Its contents are the authors’ sole responsibility and do not necessarily represent official NIH views. The authors declare no conflict of interest.
References
- Alkan A, Sahin I, Keskin L, Cikim AS, Karakas Hm, Sigirci A, et al. Diffusion-weighted imaging features of brain in obesity. Magnetic Resonance Imaging. 2008;26(4):446–450. doi: 10.1016/j.mri.2007.10.004. [DOI] [PubMed] [Google Scholar]
- Ashburner J. A fast diffeomorphic image registration algorithm. NeuroImage. 2007;38:95–113. doi: 10.1016/j.neuroimage.2007.07.007. [DOI] [PubMed] [Google Scholar]
- Ashburner J, Friston KJ. Unified segmentation. NeuroImage. 2005;26:839–851. doi: 10.1016/j.neuroimage.2005.02.018. [DOI] [PubMed] [Google Scholar]
- Avraham Y, Davidi N, Lassri V, Vorobiev L, Kabesa M, Dayan M, et al. Leptin induces neuroprotectiong neurogenesis and angiogenesis after stroke. Current Neurovascular Research. 2011;8(4):313–322. doi: 10.2174/156720211798120954. [DOI] [PubMed] [Google Scholar]
- Baicy K, London ED, Monterosso J, Wong ML, Belibasi T, Sharma A, et al. Leptin replacement alters brain response to food cues in genetically leptin-deficient adults. Proceedings of the National Academy of Sciences of the United States of America. 2007;104:18276–18279. doi: 10.1073/pnas.0706481104. [DOI] [PMC free article] [PubMed] [Google Scholar]
- Bessesen DH, Bull S, Cornier MA. Trafficking of dietary fat and resistance to obesity. Physiology & Behavior. 2008;94:681–688. doi: 10.1016/j.physbeh.2008.04.019. [DOI] [PMC free article] [PubMed] [Google Scholar]
- Brett M, Anton J-L, Valabregue R, Poline J-B. Region of interest analysis using an SPM toolbox (abstract) NeuroImage. 2002;16(2) (Available on CD-ROM) [Google Scholar]
- Carnell S, Gibson C, Benson L, Ochner CN, Geliebter A. Neuroimaging and obesity. Current knowledge and future directions. Obesity Reviews. 2012;13(1):43–56. doi: 10.1111/j.1467-789X.2011.00927.x. [DOI] [PMC free article] [PubMed] [Google Scholar]
- Chechlacz M, Rotshtein P, Klamer S, Porubská K, Higgs S, Booth D, et al. Diabetes dietary management alters responses to food pictures in brain regions associated with motivation and emotion. A functional magnetic resonance imaging study. Diabetologia. 2009;52(3):524–533. doi: 10.1007/s00125-008-1253-z. [DOI] [PubMed] [Google Scholar]
- Cohen JI, Yates KF, Duong M, Convit A. Obesity, orbitofrontal structure and function are associated with food choice. A cross-sectional study. BMJ Open. 2011;2:e000175. doi: 10.1136/bmjopen-2011-000175. [DOI] [PMC free article] [PubMed] [Google Scholar]
- Cornier MA. Is your brain to blame for weight regain? Physiology & Behavior. 2011;104:608–612. doi: 10.1016/j.physbeh.2011.04.003. [DOI] [PMC free article] [PubMed] [Google Scholar]
- Cornier MA, Salzberg AK, Endly DC, Bessesen DH, Rojas DC, Tregellas JR. The effects of overfeeding on the neuronal response to visual food cues in thin and reduced-obese individuals. PLoS One. 2009;4(7):e6310. doi: 10.1371/journal.pone.0006310. [DOI] [PMC free article] [PubMed] [Google Scholar]
- Cornier MA, Von Kaenel SS, Bessesen DH, Tregellas JR. Effects of overfeeding on the neuronal response to visual food cues. American Journal of Clinical Nutrition. 2007;86:965–971. doi: 10.1093/ajcn/86.4.965. [DOI] [PubMed] [Google Scholar]
- Craig AD. Forebrain emotional asymmetry. A neuroanatomical basis? Trends in Cognitive Sciences. 2005;9:566–571. doi: 10.1016/j.tics.2005.10.005. [DOI] [PubMed] [Google Scholar]
- Craig AD. How do you feel now? The anterior insula and human awareness. Nature Reviews Neuroscience. 2009;10:59–70. doi: 10.1038/nrn2555. [DOI] [PubMed] [Google Scholar]
- Craig AD. The sentient self. Brain Structure and Function. 2010;214:563–577. doi: 10.1007/s00429-010-0248-y. [DOI] [PubMed] [Google Scholar]
- Craig AD. Significance of the insula for the evolution of human awareness of feelings from the body. Annals of the New York Academy of Sciences. 2011;1225:72–82. doi: 10.1111/j.1749-6632.2011.05990.x. [DOI] [PubMed] [Google Scholar]
- Cuadra MB, Cammoun L, Butz T, Cuisenaire O, Thiran JP. Comparison and validation of tissue modelization and statistical classification methods in T1-weighted MR brain images. IEEE Transactions on Medical Imaging. 2005;24:1548–1565. doi: 10.1109/TMI.2005.857652. [DOI] [PubMed] [Google Scholar]
- De Araujo IET, Kringelbach ML, Rolls ET, Hobden P. The representation of umami taste in the human brain. Journal of Neurophysiology. 2003;90:313–319. doi: 10.1152/jn.00669.2002. [DOI] [PubMed] [Google Scholar]
- Elliot R, Deakin B. Role of the orbitofrontal cortex in reinforcement processing and inhibitory control. Evidence from functional magnetic resonance imaging studies in healthy human subjects. International Review of Neurobiology. 2005;65:89–116. doi: 10.1016/S0074-7742(04)65004-5. [DOI] [PubMed] [Google Scholar]
- Flegal KM, Carroll MD, Kit BK, Ogden CL. Prevalance of obesity and trends of body mass index among US adults, 1999–2010. JAMA. 2012;307(5):491–497. doi: 10.1001/jama.2012.39. [DOI] [PubMed] [Google Scholar]
- Fuhrer D, Zysset S, Stumvoll M. Brain activity in hunger and satiety. An exploratory visually stimulated fMRI study. Obesity. 2008;16(5):945–950. doi: 10.1038/oby.2008.33. [DOI] [PubMed] [Google Scholar]
- Gautier JF, Del Parigi A, Chen K, Salbe AD, Bandy D, Pratley RE, et al. Effect of satiation on brain activity in obese and lean women. Obesity Research. 2001;9:676–684. doi: 10.1038/oby.2001.92. [DOI] [PubMed] [Google Scholar]
- Gearhardt AN, Yokum S, Orr PT, Stice E, Corbin WR, Brownell KD. Neural correlates of food addiction. Archives of General Psychiatry. 2011;68(8):808–816. doi: 10.1001/archgenpsychiatry.2011.32. [DOI] [PMC free article] [PubMed] [Google Scholar]
- Hill JO, Wyatt HR, Melanson EL. Genetic and environmental contributions to obesity. Medical Clinics of North America. 2000;84:333–346. doi: 10.1016/s0025-7125(05)70224-8. [DOI] [PubMed] [Google Scholar]
- Hinton EC, Parkinson JA, Holland AJ, Arana FS, Roberts AC, Owen AM. Neural contributions to the motivational control of appetite in humans. European Journal of Neuroscience. 2004;20:1411–1418. doi: 10.1111/j.1460-9568.2004.03589.x. [DOI] [PubMed] [Google Scholar]
- Hollmann M, Hellrung L, Pleger B, Schlögl H, Kabisch S, Stumvoll M, et al. Neural correlates of the volitional regulation of the desire for food. Int J Obesity. 2011:1–8. doi: 10.1038/ijo.2011.125. http://dx.doi.org/10.1038/ijo.2011.125. [DOI] [PubMed]
- Killgore WD, Young AD, Femia LA, Bogorodzi P, Rogowska J, Yurgelun-Todd DA. Cortical and limbic activation during viewing of high-versus low-calorie foods. NeuroImage. 2003;19:1381–1394. doi: 10.1016/s1053-8119(03)00191-5. [DOI] [PubMed] [Google Scholar]
- Koob GF, Volkow ND. Neurocircuitry of addiction. Neuropsychopharmacology. 2010;35(1):217–238. doi: 10.1038/npp.2009.110. [DOI] [PMC free article] [PubMed] [Google Scholar]
- Koros C, Boukouvalas G, Gerozissis K, Kitraki E. Fat diet affects leptin receptor levels in the rat cerebellum. Nutrition. 2009;25(1):85–87. doi: 10.1016/j.nut.2008.06.033. [DOI] [PubMed] [Google Scholar]
- Kringelbach ML. The human orbitofrontal cortex. Linking reward to hedonic experience. Nature Reviews Neuroscience. 2005;6:691–702. doi: 10.1038/nrn1747. [DOI] [PubMed] [Google Scholar]
- Kringelbach ML, O’Doherty J, Rolls ET, Andrews C. Activation of the human orbitofrontal cortex to a liquid food stimulus is correlated with its subjective pleasantness. Cerebral Cortex. 2003;13:1064–1071. doi: 10.1093/cercor/13.10.1064. [DOI] [PubMed] [Google Scholar]
- Kringelbach ML, Rolls ET. The functional neuroanatomy of the human orbitofrontal cortex: evidence from neuroimaging and neuropsychology. Progress in Neurobiology. 2004;72(5):341–372. doi: 10.1016/j.pneurobio.2004.03.006. [DOI] [PubMed] [Google Scholar]
- Kurth F, Levitt JG, Phillips OR, Luders E, Woods RP, Mazziotta JC, et al. Relationship between GM, body mass index, and waist circumference in healthy adults. Human Brain Mapping. 2012 doi: 10.1002/hbm.22021. (e-pub ahead of print) [DOI] [PMC free article] [PubMed] [Google Scholar]
- Levy LM, Henkin RI, Lin CS, Finley A, Schellinger D. Taste memory induces brain activation as revealed by functional MRI. Journal of Computer Assisted Tomography. 1999;23:499–505. doi: 10.1097/00004728-199907000-00002. [DOI] [PubMed] [Google Scholar]
- Luders E, Gaser C, Narr KL, Toga AW. Why sex matters. Brain size independent differences in gray matter distributions between men and women. Journal of Neuroscience. 2009;29(45):14265–14270. doi: 10.1523/JNEUROSCI.2261-09.2009. [DOI] [PMC free article] [PubMed] [Google Scholar]
- Maayan L, Hoogendoorn C, Sweat V, Convit A. Disinhibited eating in obese adolescents is associated with orbitofrontal volume reductions and executive dysfunction. Obesity. 2011;19(7):1382–1387. doi: 10.1038/oby.2011.15. [DOI] [PMC free article] [PubMed] [Google Scholar]
- Maldjian JA, Laurienti PJ, Kraft RA, Burdette JH. An automated method for neuroanatomic and cytoarchitectonic atlas-based interrogation of fMRI data sets. NeuroImage. 2003;19:1233–1239. doi: 10.1016/s1053-8119(03)00169-1. [DOI] [PubMed] [Google Scholar]
- Manjon JV, Coupe P, Marti-Bonmati L, Collins DL, Robles M. Adaptive non-local means denoising of MR images with spatially varying noise levels. Journal of Magnetic Resonance Imaging. 2010;31:192–203. doi: 10.1002/jmri.22003. [DOI] [PubMed] [Google Scholar]
- Martin LE, Holsen LM, Chambers RJ, Bruce AS, Brooks WM, Zarcone JR, et al. Neural mechanisms associated with food motivation in obese and healthy weight adults. Obesity. 2010;18:254–260. doi: 10.1038/oby.2009.220. [DOI] [PubMed] [Google Scholar]
- McCaffery JM, Haley AP, Sweet LH, Phelan S, Raynor HA, Del Parigi A, et al. Differential functional magnetic imaging response to food pictures in successful weight-loss maintainers relative to normal-weight and obese controls. American Journal of Clinical Nutrition. 2009;90(4):928–934. doi: 10.3945/ajcn.2009.27924. [DOI] [PMC free article] [PubMed] [Google Scholar]
- Neary MT, Batterham RL. Gaining new insights into food reward with functional neuroimaging. Forum of Nutrition. 2010;63:152–163. doi: 10.1159/000264403. [DOI] [PubMed] [Google Scholar]
- O’Doherty J, Rolls ET, Francis S, Bowtell R, McGlone F, Kobal G, et al. Sensory-specific satiety-related olfactory activation of the human orbitofrontal cortex. NeuroReport. 2000;11:893–897. doi: 10.1097/00001756-200003200-00046. [DOI] [PubMed] [Google Scholar]
- Pannacciulli N, Del Parigi A, Chen K, Le DS, Reiman EM, Tataranni PA. Brain abnormalities in human obesity. A voxel-based morphometric study. NeuroImage. 2006;31:1419–1425. doi: 10.1016/j.neuroimage.2006.01.047. [DOI] [PubMed] [Google Scholar]
- Pannacciulli N, Le DSNT, Chen K, Reiman EM, Krakoff J. Relationships between plasma leptin concentrations and human brain structure. A voxel-based morphometric study. Neuroscience Letters. 2007;412:248–253. doi: 10.1016/j.neulet.2006.11.019. [DOI] [PMC free article] [PubMed] [Google Scholar]
- Pelchat ML, Johnson A, Chan R, Valdez J, Ragland JD. Images of desire. Food-craving activation during fMRI. NeuroImage. 2004;23:1486–1493. doi: 10.1016/j.neuroimage.2004.08.023. [DOI] [PubMed] [Google Scholar]
- Perez-Gonzalez R, Antequera D, Vargas T, Spuch D, Bolos M, Carro E. Leptin induces proliferation of neuronal progenitors and neuroprotection in a mouse model of Alzheimer’s disease. Journal of Alzheimer’s Disease. 2011;24:17–25. doi: 10.3233/JAD-2011-102070. [DOI] [PubMed] [Google Scholar]
- Pessoa L. Emergent processes in cognitive-emotional interactions. Dialogues in Clinical Neuroscience. 2010;12(4):433–448. doi: 10.31887/DCNS.2010.12.4/lpessoa. [DOI] [PMC free article] [PubMed] [Google Scholar]
- Peters JC, Wyatt HR, Donahoo WT, Hill JO. From instinct to intellect: the challenge of maintaining a healthy weight in the modern world. Obesity Reviews. 2002;3(2):69–74. doi: 10.1046/j.1467-789x.2002.00059.x. [DOI] [PubMed] [Google Scholar]
- Porubska K, Veit R, Preissl H, Frische A, Birbaumer N. Subjective feeling of appetite modulates brain activity. An fMRI study. NeuroImage. 2006;32:1273–1280. doi: 10.1016/j.neuroimage.2006.04.216. [DOI] [PubMed] [Google Scholar]
- Rosenbaum M, Sy M, Pavlovich K, Leibel RL, Hirsch J. Leptin reverses weight loss-induced changes in regional neural activity responses to visual food stimuli. Journal of Clinical Investigation. 2008;118:2583–2591. doi: 10.1172/JCI35055. [DOI] [PMC free article] [PubMed] [Google Scholar]
- Rothemund Y, Preuschof C, Bohner G, Bauknecht HC, Klingebiel R, Flor H, et al. Differential activation of the dorsal striatum by high-calorie visual food stimuli in obese individuals. NeuroImage. 2007;37:410–421. doi: 10.1016/j.neuroimage.2007.05.008. [DOI] [PubMed] [Google Scholar]
- Schmidt SL, Harmon KA, Sharp TA, Kealey EH, Bessesen DH. The effects of overfeeding on spontaneous physical activity in obesity prone and obesity resistant humans. Obesity. 2012 doi: 10.1038/oby.2012.103. http://dx.doi.org/10.1038/oby.2012.103 (advanced online publication) [DOI] [PMC free article] [PubMed]
- Shields M, Caroll MD, Odgen CL. Adult obesity prevalence in Canada and the United States. Advances in Nutrition. 2011;2:368–369. doi: 10.3945/an.111.000497. [DOI] [PMC free article] [PubMed] [Google Scholar]
- Signore AP, Zhang F, Weng Z, Gao Y, Chen J. Leptin neuroprotection in the CNS. Mechanisms and therapeutic potentials. Journal of Neurochemistry. 2008;106(5):1977–1990. doi: 10.1111/j.1471-4159.2008.05457.x. [DOI] [PMC free article] [PubMed] [Google Scholar]
- Simmons WK, Martin A, Barsalou LW. Pictures of appetizing foods activate gustatory cortices for taste and reward. Cerebral Cortex. 2005;15:1602–1608. doi: 10.1093/cercor/bhi038. [DOI] [PubMed] [Google Scholar]
- Smeets AM, Graaf C, Stafleu A, van Osch MJP, Nievelstein RAJ, van der Grond J. Effect of satiety on brain activation during chocolate tasting in men and women. American Journal of Clinical Nutrition. 2006;83(6):1297–1305. doi: 10.1093/ajcn/83.6.1297. [DOI] [PubMed] [Google Scholar]
- Stoeckel LE, Weller RE, Cook EW, 3rd, Twieg DB, Knowlton RC, Cox JE. Widespread reward-system activation in obese women in response to pictures of high-calorie foods. NeuroImage. 2008;41:636–647. doi: 10.1016/j.neuroimage.2008.02.031. [DOI] [PubMed] [Google Scholar]
- St-Onge MP, Sy M, Heymsfield SB, Hirsch J. Human cortical specialization for food. A functional magnetic resonance imaging investigation. Journal of Nutrition. 2005;135:1014–1018. doi: 10.1093/jn/135.5.1014. [DOI] [PubMed] [Google Scholar]
- Tataranni PA, Gautier JF, Chen K, Uecker A, Bandy D, Salbe AD. Neuroanatomical correlates of hunger and satiation in humans using positron emission tomography. Proceedings of the National Academy of Sciences of the United States of America. 1999;96:4569–4574. doi: 10.1073/pnas.96.8.4569. [DOI] [PMC free article] [PubMed] [Google Scholar]
- Van den Eynde F, Treasure J. Neuroimaging in eating disorders and obesity. Implications for research. Child and Adolescent Psychiatric Clinics of North America. 2009;18(1):95–115. doi: 10.1016/j.chc.2008.07.016. [DOI] [PubMed] [Google Scholar]
- Wallner-Leibmann S, Koschutnig K, Reishofer G, Sorantin E, Blaschitz B, Kruschitz R, et al. Insulin and hippocampus activation in response to images of high-calorie food in normal weight and obese adolescents. Obesity. 2010;18(8):1552–1557. doi: 10.1038/oby.2010.26. [DOI] [PubMed] [Google Scholar]
- Walther K, Birdsill AC, Glisky EL, Ryan L. Structural brain differences and cognitive functioning related to body mass index in older females. Human Brain Mapping. 2010;31:1052–1064. doi: 10.1002/hbm.20916. [DOI] [PMC free article] [PubMed] [Google Scholar]
- Yokum S, Ng J, Stice E. Relation of gray and white matter volumes to current BMI and future increases in BMI. A prospective MRI study. International Journal of Obesity. 2012;36:656–664. doi: 10.1038/ijo.2011.175. [DOI] [PMC free article] [PubMed] [Google Scholar]