

Abstract
Post-translational modifications such as phosphorylation play a vital role in the regulation of protein function. In our study of the basic Helix-loop-Helix (bHLH) transcription factor HAND1, we show that HAND1 is phosphorylated during the trophoblast giant cell differentiation on residues residing in Helix I of the bHLH domain. Our hypothesis is that these modifications result in changes in HAND1 dimerization affinities with other bHLH factors. To test this idea, we employed FRET to measure the protein-protein interactions of HAND1 and HAND1 point mutants in HEK293 cells using YFP and CFP fusion proteins and laser scanning confocal microscopy.
Keywords: Phosphorylation, Fluorescence Resonance Energy Transfer, Transcription factors
Introduction
The basic Helix-loop-Helix (bHLH) transcription factors HAND1 and HAND2 are members of the twist family of bHLH proteins (for review (1)). HAND factors are expressed in a variety of tissues during murine development including the heart, cardiac neural crest, lateral mesoderm, extraembryonic mesoderm, maternally derived decidua and sympathetic nervous system. bHLH factors activate/repress transcription by forming dimers via their HLH motif and bind DNA through the juxtaposition of the 2 basic domains, which recognize a canonical cis-element CANNTG, termed an E-box (for review (2)). bHLH proteins can generally be separated into to classes the class A bHLH factors (E-proteins) which are ubiquitously expressed and a tissue-restricted or class B bHLH factors (1, 2). The established paradigm of function was that a heterodimer composed of a class A and a class B protein was required for transcriptional regulation and in fact many class B factors do not form homodimers or heterodimers with other class B factors efficiently. Recently, we and others recognized that members of the twist family of proteins exhibited a more promiscuous dimerization profiles forming homodimers and heterodimers with a wide range of class B factors (3-6) With this in mind, we formulated the hypothesis that tissue-specific transcriptional regulation by HAND factors was in fact driven by the formation of a specific bHLH dimer complex that could form. This hypothesis prompts the additional question of how is HAND dimerization controlled. Most recently we determined that phosphorylation on specific residues in the bHLH domain occur on HAND1 during trophoblast differentiation. We hypothesized that these post-translational modifications might affect dimerization affinities of HAND1 and thus affect biological function (6). To determine if HAND phosphorylation, resulted in altered dimerization affinities, we generated YFP and CFP C-terminal fusions proteins with HAND, HAND1 T107;S109 point mutants and full length E12 and E47. These HAND and E-protein fusion proteins were coexpressed in various combinations in HEK293 cells and FRET efficiencies between the YFP and CFP fusion proteins were determined using laser-scanning confocal microscopy.
Materials and Methods
Constructs
HAND1 point mutants HAND1 S98A, S109A-T107A &D were generated using the Quickchange Mutagenesis kit (Strategene) following the manufacturers protocols (6). E12 and E47 were a generous gift from M. Bonner-Fraser (Cal. Tech). PCR products of HAND1, HAND1 mutants, E12 and E47 in which stop codons were removed were cloned in frame 5’ to either YFP or CFP in the pEYFP-N1 and pECFPN-1 (Clonetech).
Tissue Culture and DNA transfections
HEK293 cells were grown in DMEM containing antibiotics and 10%FBS at 5%CO2 in a humidified incubator as described (7) DNA was transfected into cells using a CaPO4 method as described (7) onto #1 cover-slips in 10cm dishes. Cells were grown 48hr post transfection, fixed and coverslips were mounted using Vectasheild (Vector Laboratories) mounting media.
FRET
Dimerization of HAND elements was determined by the Acceptor Photobleaching method of FRET detection. A Zeiss 510 NLO microscope (Carl Zeiss Inc.) was used to record the fluorescence of CFP and YFP in constructs of HAND both before and after selective photobleaching of at least 85% of the YFP acceptor fluorophore. CFP was excited by 458 nm light and the emission was collected through an HQ 470-500 nm bandpass filter (Chroma Technology, Brattleboro, VT). YFP was excited by 514 nm light and the emission was collect through an HQ 525-575 nm bandpass filter (Chroma Technology, Brattleboro, VT). Selective photobleaching of YFP was performed by repeatedly scanning a region of the specimen with the 514 nm laser line set at maximum intensity to photobleach at least 85% of the original acceptor fluorescence. The fluorescence emission from the donor and the acceptor are collected sequentially using the “multitrack” function of the Zeiss LSM 510 software. A Timed Bleach protocol is utilized to automate the acquisition of pre-bleach images, perform acceptor photobleaching of the acceptor, and acquisition of post-bleach images. The pre- and post-bleach images are saved as a single file that can be analyzed using measurement functions resident in the Zeiss LSM 510 software. Average fluorescence intensities of the donor are measured before and after bleaching and these values are recorded in a spreadsheet that can be imported into Excel. The efficiency of FRET was calculated by
ET = 1 – (IDA/ID)
where IDA and ID represent the steady state donor fluorescence in the presence and the absence of the acceptor. The change in donor fluorescence was assessed in a minimum of 80 regions of interest for each experimental set. Mean FRET efficiencies were then reported ± standard error. See detailed protocol.
Results and Discussion
When we realized that PKA, PKC and B56δ-containing PP2A were modulating HAND1 phosphorylation of residues T107 and S109 we immediately thought that modifications to these residues affect HAND1 dimerization (6). Our initial efforts focused on immunoprecipitation of myc- and Flag-tagged HAND1 and E-proteins coexpressed in HEK293 cells. Although these experiments did provide insight that supported our hypothesis (6), the data obtained was qualitative in nature and thus specific statements on HAND1 dimerization strength could not be deduced. To obtain highly quantifiable data on the effects of modification of T107;S109 in HAND1, we choose FRET analysis. Transfer of energy can occur from a donor molecule to an acceptor molecule when they reside within 10Å to 100Å of each other (8). The method used to detect FRET requires the measurement of the donor molecule (CFP) fluorescence in the presence of the acceptor (YFP) and then again once the acceptor is eliminated by selective photobleaching. Laser light at the maximal emission of the acceptor (514nm for YFP) is used to destroy YFP emission within a desired location within the cell. Without YFP to “steal” energy from the CFP the result is an increase in CFP emission. As Figure 1 shows, coexpression of HAND1YFP and HAND1T107;S109DCFP are both expressed within the nucleus of 2 HEK293 cells prior to photobleaching. Photobleaching of the rightmost cell (arrow) eliminates YFP fluorescence from the cell (Fig. 1) visible changes in the fluorescence observed from HAND1T107S109DCFP are evident from the increased emission from the CFP (marked +). It is this net change CFP emission that is calculated by the imaging/analysis software. Specific and random regions within the nucleus were sampled. Nuclei that were not photobleached were also measured as control.
Fig. 1. Representive images of FRET HAND1 homodimer experiment.
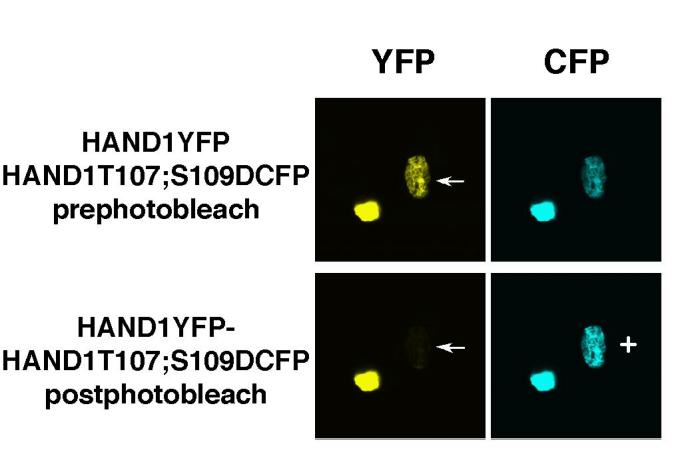
HAND1YFP and HAND1T107;S109DCFP were cotransfected into HEK293 cells growing on coverslips as described, grown for 48 hr, fixed and mounted onto slides. Images prephotobleach show relative equal intensities of YFP and CFP emission. White arrow indicates the position of the cell which has been photobleached and + shows visually the increase on CFP emission. Note that the unbleached cell maintains consistent emission for both YFP and CFP.
From these analyses we deduced that alteration of T107;S109 to alanine significantly reduces the FRET efficiencies of the E12 and E47 heterodimer (6). Consequently, FRET efficiency for the HAND1 homodimer increases with the same mutant (6). Analysis of the HAND1T107;S109D mutation also decreases FRET efficiencies of the E-protein heterodimer, but to a lesser extent (6). Along these lines, HAND1 homodimers also show an increased FRET efficiency that is similar to that observed in the T107;S109A mutation. These results can be explained by simple mass action. E-proteins are ubiquitously expressed including HEK293 cells. As there are untagged bHLH factors expressed in the cells we are using for analysis and they are likely to form dimers with our exogenous YFP and CFP fusion proteins, they are likely to confound results. For example if T107;S109A dimerizes less efficiently with E-proteins (including endogenous ones) there is in fact more free HAND1 to participate in HAND1 homodimers and thus by simple mass action FRET efficiency of the HAND1 homodimer would increase. Similarly, if T107;S109D stabilizes the HAND1 homodimer, then for example you would form more HAND1YFP-HAND1YFP homodimers at the expense of dimerization with the CFP-tagged E-proteins. This model is further complicated by expression additional bHLH proteins and dictates that levels of expression (i.e. the stoichiometry of bHLH proteins within the cell) and the phosphorylation state of HAND1 both dictate dimer choice. This model is further supported by the finding that although the T107;S109A and D mutants show a similar effect on HAND1 homodimer formation when these mutants are electroporated into the limbs of developing chicks they display pronounced variation in phenotypic outcome (6). In summary the use of FRET to assess the protein-protein interaction within cells allows for accurate, reproducible and quantifiable measure of interaction strength. By incorporation of the protein mutations regions important for these interactions can be mapped and the effects of altering these critical domains can then be tested in a variety of biological systems.
Acknowledgments
We thank our co-authors of Molecular Cell 12:1225-1237 Marthe J. Howard, Jennifer R. McDaid, Leanne McIlreavey, Karen M. Dionne, David M. Virshup and Peter Cserjesi. We also thank, Dan Hadzic, Brandon Smiley, YanLi Zhao and Kunal Patel for excellent technical assistance. This work was supported by grants from the National Institutes of Health (R01 HLA61677-04; 2RO1HL61677-05) and March of Dimes Birth Defects Foundation (ABF).
Appendix
Protocols
Tissue culture preparations and CaPO4 transfection
Plate HEK293 cells on #1 coverslips in 10 cm dishes and grow for 48hr at 5% CO2 37oC.
Cells (around 60% confluent) are then fed and allowed to grow between 2-4 hours.
Precipitate DNA with 100% ethanol (ETOH), wash with 70% ETOH and dry pellets.
Resuspend pellets in 50mL of sterile H2O and 500mL of 2X Hepes-buffered saline (HBS). Transfer DNA mix to 15mL snap-top tube.
With an automatic pipette, blow air gently into the mixture. Concurrently add dropwise 450mL of a 2:12 dilution of 2M CaCl2. A fine precipitate should form in the tube. Incubate for 20 min. at room temperature.
Add the 1ml precipitate to the plate of cells. Place them in the incubator for 4-6 hours.
Aspirate off media, and add 3mL of shock media (15% glycerol in supplemented DMEM) incubate for 1 minute in hood, aspirate of media wash once with 1XPBS, add 10mL of fresh supplemented DMEM and grow for 48hr.
2XHBS
280mM NaCl
50mM HEPES (USE only sodium salt not free acid)
1.5mM NaH2PO4
1.5mM Na2HPO4
pH exactly to 7.10
Working stock of CaCl2
2mL 2M CaCl2
12mL H20
Filter both using a 0.2mM filter.
Cell Fixation
Wash cells 3X with 1XPBS taking care not to dislodge cells from the coverslips.
Add 5mL of fixative (4% paraformaldehyde pH7.4) and incubate 30 minutes at room temperature.
Aspirate off fixative and add 5mL 0.1%NaBH4 in 1XPBS incubate 30 minutes at room temperature.
Aspirate off 0.1%NaBH4, add 5mL of1XPBS to dish.
With a #5 forceps, pick up the coverslip (keeping track of which side the cells are on) and mount the coverslip on a washed microscope slide coated with several drops of Vectashield. Remove air bubbles, clean slide and seal with clear nail polish. Store slides in the dark at 4oC until use. Properly prepared slides are good at least for 6 months.
FRET
Warm up A Zeiss 510 NLO microscope (Carl Zeiss Inc.) for at least 15 minutes.
Place sample slide on stage and focus in on cells. Check for both CFP and YFP emission to confirm comparable levels of coexpression. Should a large variation in expression be encountered finding a different cell or repeating the transfections is recommended.
Configure the Zeiss LSM 510 to record each fluorescence signal sequentially using the “multitracking” function.
Perform a Timed Bleach protocol to record a pre-bleach image, perform photobleaching of the acceptor, and record a post-bleached image.
Average fluorescence intensities are measured in regions of interest of the image using the resident software available with the Zeiss LSM 510. Record average intensities in a spreadsheet that can be imported into Excel to calculate FRET efficiencies.
When all data is collected, calculate the efficiency of FRET using the equation ET = 1 – (IDA/ID) where IDA and ID represent the steady state donor fluorescence in the presence and the absence of the acceptor.
Note: The change in donor fluorescence should be determined in a number of regions within the cell, within a number of cells, and from at least 2 independent transfections. Typically the total sample size can range between 35-100 data points. In most cases an increased sample size does not alter mean efficiency of FRET values significantly but does add confidence to statistical manipulations.
Equipment
CO2-waterjacketed incubator, tissue culture hood.
Zeiss 510 LSM with 3-line argon laser (458 nm, 488 nm, and 514 nm).
Non-standard barrier filters for CFP detection (470-500 nm bandpass) and YFP detection (525-575 nm bandpass) from Chroma Technology Inc.
References
- Firulli AB. A HANDful of questions: The molecular biology of the HAND-subclass of basic helix-loop-helix transcription factors. Gene. 2003;312C:27–40. doi: 10.1016/S0378-1119(03)00669-3. [DOI] [PubMed] [Google Scholar]
- Massari ME, Murre C. Helix-Loop-Helix Proteins: Regulators of Transcription in Eukaryotic Organisms. Molec Cell Biol. 2000;20:429–440. doi: 10.1128/mcb.20.2.429-440.2000. [DOI] [PMC free article] [PubMed] [Google Scholar]
- Firulli BA, Hadzic DB, McDaid JR, et al. The basic helix-loop-helix transcription factors dHAND and eHAND exhibit dimerization characteristics that suggest complex regulation of function. Journal of Biological Chemistry. 2000;275:33567–33573. doi: 10.1074/jbc.M005888200. [DOI] [PMC free article] [PubMed] [Google Scholar]
- Scott IC, Anson-Cartwright L, Riley P, et al. The HAND1 basic helix-loop-helix transcription factor regulates trophoblast differentiation via multiple mechanisms. Molec Cell Biol. 2000;20:530–541. doi: 10.1128/mcb.20.2.530-541.2000. [DOI] [PMC free article] [PubMed] [Google Scholar]
- Castanon I, Von Stetina S, Kass J, et al. Dimerization partners determine the activity of the Twist bHLH protein during Drosophila mesoderm development. Development. 2001;128:3145–3159. doi: 10.1242/dev.128.16.3145. [DOI] [PubMed] [Google Scholar]
- Firulli B, Howard MJ, McDaid JR, et al. PKA, PKC and the Protein Phosphatase 2A Influence HAND factor function: A Mechanisms for Tissue Specific Transcriptional Regulation. Mol Cell. 2003;12:1225–1237. doi: 10.1016/s1097-2765(03)00425-8. [DOI] [PubMed] [Google Scholar]
- Firulli AB, Maibenco DC, Kinniburgh AJ. Triplex forming Ability of a c-myc Promoter element Predicts Promoter Strength. Archives of Biochemistry and Biophysics. 1994;310:236–242. doi: 10.1006/abbi.1994.1162. [DOI] [PubMed] [Google Scholar]
- Centozone V, Sun M, Masuda A, Gerritsen H, Herman B. Fluorescence resonance energy transfer imaging microscopy. Meth Enzmol. 2002;360:542–560. doi: 10.1016/s0076-6879(03)60127-8. [DOI] [PubMed] [Google Scholar]