

Abstract
The promise of augmenting pharmacovigilance with patient-generated data drawn from the Internet was called out by a scientific committee charged with conducting a review of the current and planned pharmacovigilance practices of the US Food and Drug Administration (FDA). To this end, we present a study on harnessing behavioral data drawn from Internet search logs to detect adverse drug reactions (ADRs). By analyzing search queries collected from 80 million consenting users and by using a widely recognized benchmark of ADRs, we found that the performance of ADR detection via search logs is comparable and complementary to detection based on the FDA’s adverse event reporting system (AERS). We show that by jointly leveraging data from the AERS and search logs, the accuracy of ADR detection can be improved by 19% relative to the use of each data source independently. The results suggest that leveraging nontraditional sources such as online search logs could supplement existing pharmacovigilance approaches.
Adverse drug reactions (ADRs) comprise the fourth leading cause of death in the United States, ahead of pulmonary disease, diabetes, infection with human immunodeficiency virus, and automobile accidents.1,2,3,4 Beyond deaths, adverse reactions cause millions of injuries across the world each year and billions of dollars in associated costs. Numerous ADRs could be prevented with more accurate and timely detection. Drug safety surveillance, or pharmacovigilance, targets the detection, assessment, and prevention of ADRs in the postapproval period. To date, pharmacovigilance programs such as the US Food and Drug Administration (FDA) adverse event reporting system (AERS) rely on spontaneous reporting. The AERS pools reports of suspected ADRs collected from health-care professionals, consumers, and pharmaceutical companies. The reports are used to identify and investigate safety concerns about drugs and to provide guidance for regulatory actions, including issuing warnings, mandating label changes, and suspending the use of medications. Increasingly, statistical analyses of AERS data are being used to identify signals of potential ADRs.5 Although the AERS has been invaluable and will continue to be a major source of information on adverse reactions, analysis of spontaneous reports is only one aspect of the developing science of pharmacovigilance. Recent high-profile cases of ADRs, such as the delayed identification of heart attack risk associated with Vioxx and the inconsistent evidence that led to confusion over the safety of Avandia, along with the recognized limitations of spontaneous reporting, highlight the need to devise more comprehensive approaches to pharmacovigilance that would span and leverage scientific insights about ADRs from multiple complementary data sources.6,7,8,9
Recent directions in pharmacovigilance focus on the expanded secondary use of electronic health records and medical insurance claims.6,8,10 Ongoing efforts rely on (i) analysis of data from clinical trials and (ii) the use of information related to mechanistic pharmacology and pharmacogenetics. In addition, there is a recognized need11 to harness nontraditional resources that are generated by patients via the Internet, including online social media (e.g., patients’ experiences with medications that are explicitly shared via online health forums and social networks),4,12,13 and implicit health information contained in the logs of popular search engines.
Anonymized Internet search logs can serve as a planetary-scale sensor network for public health, identifying informative patterns of health information seeking about medications, symptoms, and disorders. A study conducted in 2009 by the Centers for Disease Control and Prevention estimated that 61% of adults search the Web for health- and medical condition–related information.14 Another study by the Pew Research Center reported in early 2013 that 72% of Internet users claimed to search online for health information and that 8 in 10 online health inquiries start at a search engine.15 Search logs are used in the Google Flu Trends project, demonstrating that statistics of influenza-related search terms recorded by search engines can be used to track rates of influenza.16 Similarly, analyzing search queries about medications and medical conditions may provide early clues about ADRs.
The present work builds on an earlier study,17 which demonstrated that large-scale analysis of Internet search queries can accurately signal drug interactions associated with hyperglycemia. The work has framed efforts to create a log-analysis tool at Microsoft Research, named the Behavioral Log-based Adverse Event Reporting System, a prototype system that can provide ongoing monitoring and exploration of ADRs from search logs.
In the current study, we present new findings and developments in the design, evaluation, and value of a surveillance system based on Internet search logs. We introduce a new approach for systematic signal detection using those logs and further evaluate the potential value of search log data as a resource for generating early warnings about ADRs by using a large complement of drugs and outcomes.
The data used in this study comprise 18 months of Internet search logs from 2011 to 2013, collected from more than 80 million users of a Web browser add-on from Microsoft. The logs were sourced from users who had consented to the collection and use of their logs when they installed browser software (institutional review board approval was not required). The add-on recorded these users’ search queries on the Google, Bing, and Yahoo! search engines and the URLs of the Web pages that they visited during this time period. An anonymous identifier, connected to the instance of the browser add-on, was used to track queries. All analyses were performed at the aggregate level across thousands of searchers, and no attempts were made to identify individual searchers from the logs.
The model of human behavior assumed in this work is that people search for information about drugs they are taking (or have been prescribed) and at a later time point search for symptoms or conditions they experience that may be linked to the drugs as potential adverse events. The links were inferred from longitudinal analysis of sequences of queried search terms corresponding to drugs, medical conditions, and their related symptoms. The inclusion of symptoms allows the identification of search behavior associated with conditions that could be related to drug consumption but for which the user may not yet have been professionally diagnosed. Queried terms corresponding to the drugs, conditions, and symptoms of interest were identified using sets of synonyms automatically generated from medical ontologies and historical search-result click data. A methodology inspired by self-controlled study designs18 was used to analyze the longitudinal sequences and estimate statistical associations between drugs and outcomes of interest. The associations were estimated by comparing aggregated query rates for a condition in a surveillance period after and before a drug was first queried for by each user. Signals were quantified by a statistic called the “query rate ratio” (QRR). We structured the observation period to increase the likelihood that terms associated with searches on symptoms and disorders are based on symptoms that have been experienced.
Signal-detection accuracy was evaluated on the basis of correctly classifying 398 test cases (drug–outcome pairs) deemed as either true ADRs or negative controls (spurious ADRs) that comprise a recognized drug safety gold standard created by the Observational Medical Outcomes Partnership (OMOP).8,19 The gold standard, which includes 181 drugs covering nonsteroidal anti-inflammatory drugs, antibiotics, antidepressants, angiotensin-converting enzyme inhibitors, β-blockers, antiepileptics, and glucose-lowering drugs, is divided into four sets of test cases corresponding to one of four outcomes: acute myocardial infarction, acute renal failure, acute liver injury, and upper gastrointestinal bleeding, which represent four significant and actively monitored adverse events.20 The results of this evaluation were compared with the accuracy of signal detection based on the FDA’s AERS. Finally, we investigated the potential of Internet search logs to augment AERS-based surveillance by evaluating a signal-detection strategy that combines signals generated by jointly leveraging data from the AERS and search logs.
Results
For the comparative evaluation, AERS signal scores (association statistics) for the same set of OMOP test cases were obtained from a recent study5 that characterized the performance of signal detection based on the AERS. The study was based on almost the entire set of public domain AERS reports available to date (~5 million reports). The AERS signals used for comparison in this study were generated by the FDA’s primary signal-detection algorithm, called the Multi-Item Gamma Poisson Shrinker.21
The association statistics used in the current evaluation are denoted by EB05 and QRR05, which represent the lower fifth percentile of the observed-to-expected ratio distribution calculated by the Multi-Item Gamma Poisson Shrinker and the lower fifth percentile of the QRR distribution, respectively. The use of lower-bound association statistics, instead of point estimates, is a recommended adjustment commonly applied by safety evaluators at the FDA22 to reduce false signaling. In the case of the AERS, this adjustment has been shown to provide a greater degree of accuracy than point estimates,5 and the same result was observed in this study for the QRR statistic.
Performance (signal-detection accuracy) was measured based on the area under the receiver operating characteristic (ROC) curve (AUC). The evaluation and comparison were performed separately for each of the four OMOP outcomes. Of the original 398 OMOP test cases, the evaluation was restricted to a subset of 325 test cases (Table 1), for which there was at least one AERS report and for which at least 50 distinct users queried for a given drug–outcome pair of interest (test case).
Table 1. Distribution of OMOP test cases used in the evaluation.
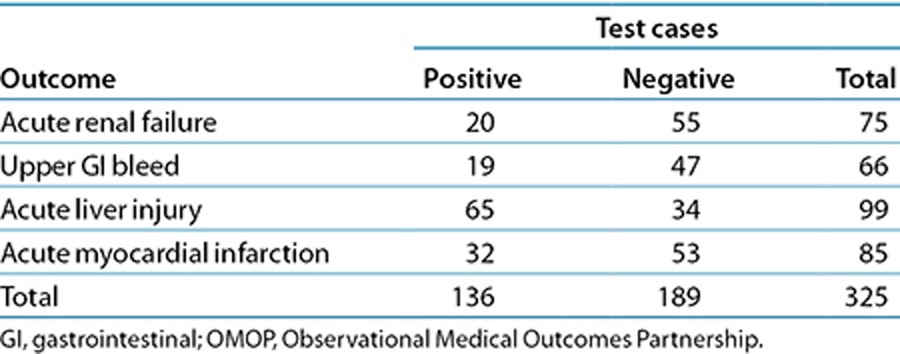
Table 2 and Figure 1 summarize the main results. On the basis of the 325 test cases, the performance of signal detection using search logs ranges from an AUC of 0.73, for acute myocardial infarction, to an AUC of 0.92, for upper gastrointestinal bleeding, with an average AUC of 0.83 for the four outcomes analyzed. The traditional analysis of AERS data attained an average AUC of 0.81. The relative AUC differences between the two data sources range from 4% in favor of the AERS for acute renal failure to 29% in favor of search logs for upper gastrointestinal bleeding, with an average relative difference of 11% in favor of search logs for the four outcomes investigated. The relative AUC difference is defined as the proportion of error reduction gained by using one data source relative to the other (formal definition in the Methods section).
Table 2. Comparison of signal-detection accuracy for AERS and search logs.
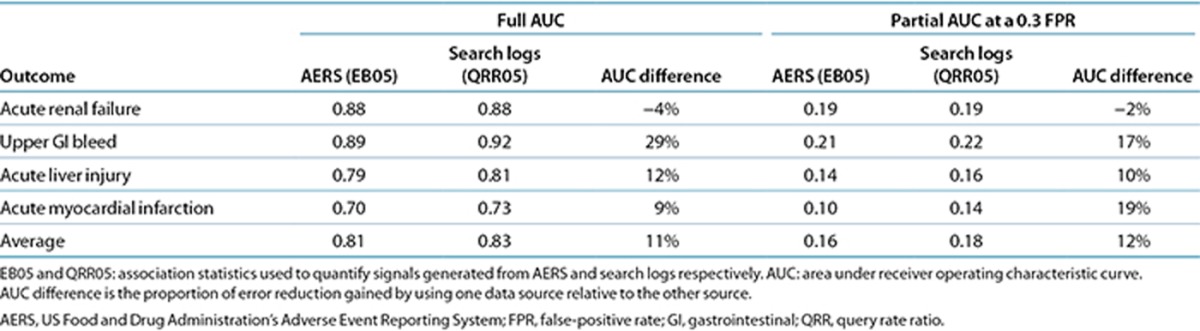
Figure 1.

Receiver operating characteristic (ROC) curves of signal detection using analyses of the US Food and Drug Administration’s Adverse Event Reporting System (AERS ) data (red) and search logs (blue). GI, gastrointestinal.
The ROC curves for the AERS and search logs (Figure 1) demonstrate that the two data sources have different operating characteristics, providing different trade-offs in terms of sensitivity and specificity. Considering that false alerts may compromise the value of a surveillance system, it has been advised that false-positive rates should be given key consideration in the assessment of a signal-detection system.23,24,25 Accordingly, partial-AUC analysis at a 0.3 false-positive rate (specificity: >0.7), a suggested ROC region of clinical relevance for signal-detection assessment,26 shows (Table 2) that search logs generally perform better than the AERS in this restricted ROC space and may improve upon the AERS by an average of 12% for the four outcomes analyzed. Establishing statistical significance of the differences in the observed AUC (see Methods section) was not attainable (P > 0.05). Thus, it can be argued that the accuracy of signals from traditional AERS analysis and that of signals from search logs are comparable.
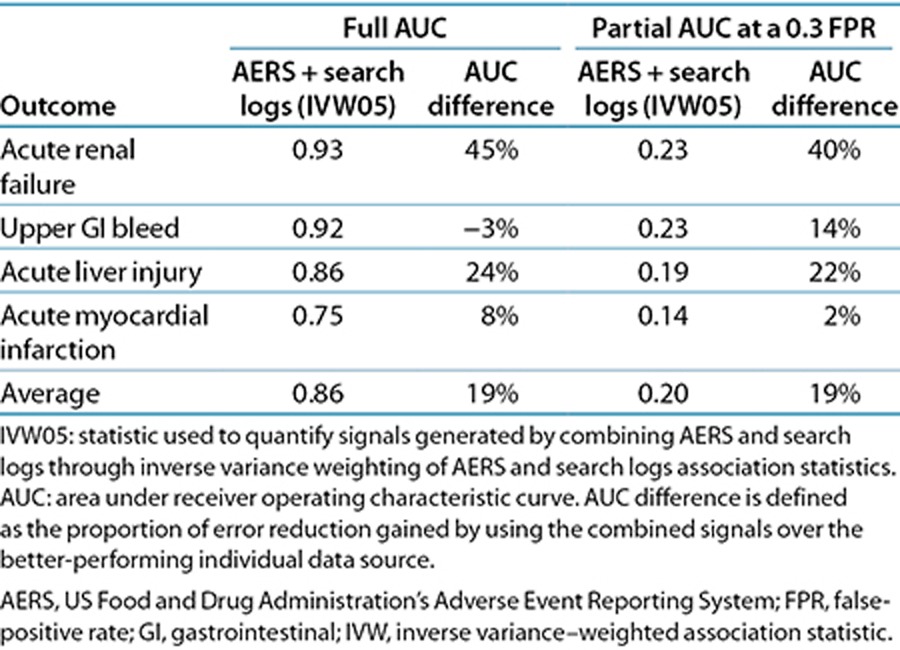
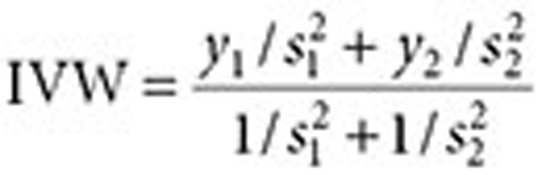
We explored the opportunity to harness analyses of search logs to complement and extend traditional AERS analysis. Table 3 shows that combining signals (association statistics) from the AERS and search logs results in a substantial improvement in detection accuracy, averaging 19% (full-AUC analysis) and 19% (partial-AUC analysis) relative to the use of each source separately. In this case, the AUC improvements are statistically significant (P < 0.05). The signals were combined through inverse variance weighting of signal score point estimates (see Methods section) and by using the lower fifth percentile of the weighted average distribution as a composite signal score (denoted as IVW05).
Table 3. Signal-detection accuracy for a strategy that combines signal generated from AERS and search logs.
Supplementary Table S1 online provides the signal statistics underlying the results of this study.
Discussion
It is widely acknowledged that no single data source or analytic approach adequately addresses the need for more effective ADR detection. Progress in pharmacovigilance is likely to come via approaches that can effectively integrate safety evidence from multiple complementary data sources.
Search logs may provide early clues about ADRs as patients engage search engines to learn about medications that they are using and medical conditions that they experience—effectively linking drugs and potential adverse events over time. The need to augment pharmacovigilance with safety evidence from search logs was noted by a scientific committee reviewing the FDA’s current and planned pharmacovigilance practices.11 To this end, we present a study that informs the design of a signal-detection system based on search logs and that systematically evaluates its potential value for use in pharmacovigilance.
Establishing baseline performance characteristics is essential for understanding how a surveillance system might perform in identifying future unknown ADRs. Our results suggest that a surveillance system based on Internet search logs can attain a relatively high degree of accuracy (average AUC of 0.83) in signaling true ADRs as well as differentiating them from likely spurious ones, with expected performance comparable to that of ADR detection based on the AERS. The results also suggest that signals related to upper gastrointestinal bleeding and acute myocardial infarction can be detected more accurately through search logs than through the AERS. Given the general consensus that the AERS is better suited to surveillance of rare events than to events with a high background rate,5,27 such as myocardial infarction, the greater accuracy of search logs for detecting myocardial infarction further underscores the promise of using search logs for pharmacovigilance.
Supporting the vision of a computationally integrative approach to pharmacovigilance, we have shown that a systematic integration of signals from both the AERS and search logs improves detection accuracy by an average of 19% relative to the use of each data source independently. Two earlier studies demonstrated similar potential by combining signals from AERS and observational data.28,29 Despite these promising results, further research is needed to understand the relative benefits and limitations of each data source and to fully realize an integrative strategy for pharmacovigilance based on the fusion of multiple sources of data, including clinical narratives,30 the biomedical literature,31 biological/chemical data,32,33 social media,12 and search logs.
The OMOP gold standard is a widely acknowledged benchmark to systematically evaluate the accuracy of a pharmacovigilance signal-detection system.5,34,35 However, the gold standard consists of test cases that were publicly known during the time frame of our evaluation and thus may be insufficient to evaluate characteristics of real-world performance in which emerging or unknown ADRs are targeted. Furthermore, the public availability of knowledge about ADRs may affect reporting, search, and prescription patterns, which in turn could bias evaluation that is retrospective in nature. Consequently, and despite our efforts to mitigate this publicity bias (discussed below), the absolute performance metrics we report may be optimistic with respect to how we should anticipate performance for future safety issues. Although a limited number of studies27,36,37 have proposed prospective evaluation strategies that, to some extent, could address these issues, there are currently no established guidelines or appropriate benchmarks to do so with high fidelity. The lack of such benchmarks can partially be attributed to the challenges in ascertaining causality for relatively new associations and identifying the time frame in which they become publicly known. Nevertheless, these limitations are increasingly acknowledged by the drug safety community, with several efforts (including ours) to outline a comprehensive evaluation strategy and establish a gold standard for that purpose. Relatedly, while seeking to characterize performance independent of a specific threshold implementation, we acknowledge that in real settings and in future evaluations a signaling threshold will need to be identified. Harpaz et al.5 outline approaches for optimal threshold identification that depend on a stakeholder’s tolerance for false positives, which we plan to pursue in future evaluations.
Detecting signals from search logs for pharmacovigilance requires consideration of biasing factors, noise, and uncertainties about such influences on queries as experiences, vocation, interests, and exposure to online content. Having each searcher serve essentially as his/her own control in our analyses mitigates certain confounding biases such as those associated with demographic factors, health status, and search habits. Users may search on medications, symptoms, and disorders for a variety of reasons, beyond the case for which they are taking a medication and experiencing symptomatology. For example, health-care professionals may routinely search for medical information. We developed a method for automatically identifying and excluding health-care professionals (9% of the user population exhibiting index search events) from our analyses. There is also uncertainty about the alignment of the timing of a first search on a medication with its initial use. Users consuming a medication may experience symptoms before or after issuing search queries on the medication.
We took two steps to reduce the likelihood that reviewing online content influenced searches on adverse effects: (i) we enforced an additional gap between the last drug query and the first symptom/condition query, and (ii) we ignored symptom/condition queries between the first and last drug query to remove instances of cycling between drugs and symptoms/conditions in exploratory searches. The exclusion period established by these two steps is mirrored symmetrically to the time period before the first drug search, thereby ignoring symptom/condition queries appearing a short time before the drug appears in the logs.
To understand the potential confounding influence of exploratory searches on medications to subsequent exploratory (vs. experiential) searches on symptoms or conditions, we sampled 1,000 online searchers and recorded the content of all Web pages that they visited during the exclusion period described above. We found that only 1.4% of searchers who later queried for a symptom/condition of interest had previously visited pages containing content on these symptoms or conditions, increasing our confidence that observed symptom/condition searching is related to experiencing a condition rather than motivated by the previous review of online content. More research is needed to understand the degree of influence of Web page content on search behavior. We are pursuing enhanced inference procedures to distinguish scenarios in which users are experiencing adverse effects vs. situations in which users are performing more general explorations of conditions that have been linked to their medications; we stress that ascertaining drug exposure and outcome occurrence can at best be achieved by analyzing textual cues. Attempts to identify and contact users to validate exposure/outcome are prohibited per the terms under which the data are collected. Additional studies are also needed to understand (i) the appearance and timing of search on medications relative to the time that patients have been prescribed medications and (ii) the influence of the appearance of symptomatology on the first and later searches on the medications.
Our assumptions about search behavior effectively set the stage for a longitudinal observational study but may have resulted in loss of valuable information contained in explicit searches for side effects, e.g., “piroxicam induced heart attack” or queries including both a drug and an outcome that fell within the exclusion period. Analyzing the gaps left by discarding explicit searches and the process of developing a signaling strategy that leverages these searches merits further research.
The methods and results that we have described highlight the value of harnessing aggregations of online behavioral signals for pharmacovigilance. The wide dispersal and ubiquity of information seeking via online search provides a large-scale and anonymized sensor network for public health, with streams of data that complement the collection and analysis of spontaneous reports by the FDA. We believe that continuing efforts to harness these and other nontraditional data streams will result in the earlier identification of adverse side effects of medications.
Methods
Concept definitions and term recognition. Each outcome in the OMOP gold standard is defined by a set of SNOMED CT38 (Systematized Nomenclature of Medicine–Clinical Terms) concept codes (definitions supplied by OMOP). Drugs in the gold standard are specified at the ingredient level by RxNorm39 concept codes. An initial set of synonyms for each OMOP drug and outcome concept was obtained from BioPortal, a repository of more than 300 biomedical ontologies that provides mappings among synonymous medical concepts.40 For each concept, the initial sets of synonyms were supplemented with consumer-oriented search terms derived from Bing’s query-click logs. Additional terms to be included were determined by first identifying all results clicked for a certain query and then identifying other queries that led to the same pages (e.g., “bleeding stomach ulcers” for the concept “upper gastrointestinal bleeding”).41 For each condition, we also identified a set of symptoms via literature review (e.g., “tarry feces” for upper gastrointestinal bleeding) and used the processes described above to generate synonyms for the symptoms. Automated term recognition was then used to tag queried search terms associated with each of the OMOP drugs and condition concepts (and symptoms thereof). Figure 2 displays the top 10 queried terms associated with each of the four OMOP conditions. Although these terms were derived directly from the OMOP definitions, the choice of search terms used for signal detection may influence performance.16,17
Figure 2.

Top 10 search terms for each of the Observational Medical Outcomes Partnership (OMOP) outcomes. Percentage denotes the fraction of queries with the search term for the outcome. *A search term corresponding to a symptom of a condition.
Excluded users. Users linked to ≥1,000 search queries on any given day were classified as automated traffic (Internet bots) and removed. We found that the percentage of a user’s queries containing a medical term within their first month of search activity could help identify health-care professionals. We removed users with a percentage >20% as probably being health-care professionals. The percentage threshold was derived from a predictive model (logistic regression) using various search statistics related to medical terms as potential predictors. Model selection and validation were based on 10-fold cross-validation using a manually labeled sample of 170 users proportionally allocated to each of the percentage deciles. The model had an error rate of 20% in classifying health-care professionals.
Generation of search logs signal. Without loss of generality, let D, C, and S be the set of terms (synonyms) associated with a specific drug of interest, a specific condition of interest, and a symptom of the condition, respectively. Denote a queried search term issued by user i in time t by  . Let
. Let 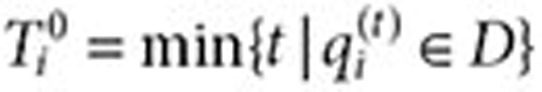 be the time of the first query for the drug of interest (time zero) and
  be the time of the last query for the drug. Let
  , let β and γ be two prespecified parameters, and let
  . The full surveillance period is then defined as
  , and the exclusion period as
  (Figure 3). The surveillance period restricts the length of observation for which a condition may be regarded as being linked to a drug. The exclusion period is a time window in which we ignore all queries of conditions or symptoms to reduce the likelihood that these queries are part of an exploratory search or are influenced by review of online content. The variable α is assumed to be a time period in which users may be cycling between drugs and symptoms/conditions in exploratory searches. The mean for α was 1.98 days, and its median was 1 day. β is an additional gap between
  and the remaining observation period, and it reduces the likelihood that online information on adverse effects influenced follow-on searches. γ is the time duration beyond the exclusion period in which queries are included in the analysis. Notice that both periods are symmetric around time zero, the index event of the first drug search. We experimented with different values of the parameters β (1–10 days) and γ (30/60/90 days) and found that β = 7 days and γ = 60 days yield the best performance with respect to the four outcomes analyzed. However, it is likely that different observation periods (defined by γ) would be required to detect other events, e.g., events with longer onset.
Figure 3.

Illustration of the components used to compute associations between drugs and medical conditions for signal detection using search logs. Each user is associated with a surveillance period (blue line) centered on the time of the user’s first query  for a drug of interest (D). Associations are estimated by calculating the query rate ratio (QRR)—the ratio between the number of queries for a condition (C) or symptom (S) of interest outside the exclusion period (shaded region) after and before
  . In this example, QRR = (4 + 3 + 2)/(1 + 1 + 1) = 3.
A statistical association between a drug–condition pair of interest is estimated by comparing the aggregate query rates for a condition or symptom of interest in the inclusion periods after and before time zero for the drug of interest (see Figure 3). Specifically, let
 |
be the number of times user i queried for condition (or symptom) of interest in the inclusion period after  . Let
. Let
 |
be the equivalent quantity in the inclusion period before  . The QRR that represents the association statistic for the drug–outcome pair of interest is given by the expression
 |
Figure 3 provides an illustration of the QRR calculation. It can be seen that in this analysis each user serves as his/her own control, forming the basis for a self-controlled study design. A similar method called “observational screening” was developed by the OMOP19 to analyze ADRs in observational data.
The confidence interval for QRR (assuming a ratio of two Poisson rates) is given by the following expression42:
 |
where  ,
,  . The lower and upper bounds—QRR05 and QRR95—are calculated by substituting
  .
.
Combining signals. Let  ,
,  ,
,  , and
, and  . The inverse variance–weighted association statistic (IVW) for a given drug–outcome pair is given by
 |
where  and
and  are approximated by
  and
and  , respectively (
 ). The lower 5% percentile of the IVW distribution is given by
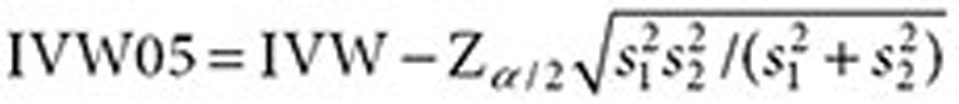 |
AUC statistics. The comparative statistic of the relative difference between the AUC of signals from search logs and the AUC of signals from the AERS (used in Table 2) is defined by
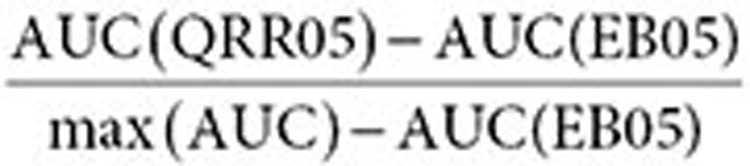 |
where max (AUC) = 1 for full-AUC analysis, and max (AUC) = 0.3 for partial-AUC analysis at a 0.3 false-positive rate. The AUC difference (improvement) of the combined signals relative to either search logs or the AERS (used in Table 3) is defined similarly by
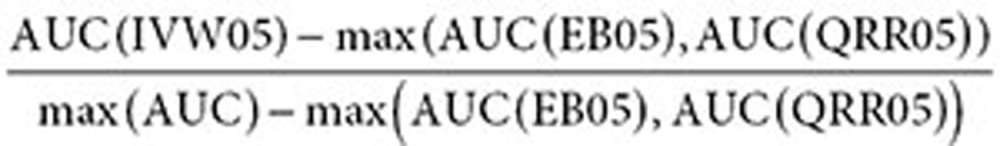 |
A two-sided test was applied to test whether the differences in the AUCs of search logs (based on QRR05) and the AERS (based on EB05) were statistically significant. A one-sided test was applied to test whether the AUC of the combined signal score (IVW05) represents a statistically significant improvement over the AUC of the individual sources. The tests were applied to the pooled set of signal scores representing all four outcomes in order to produce a single result (P value). Statistical significance (P values) was computed using stratified (by ground truth) bootstrapping of signal scores, available in the R package pROC.43 Bootstrapping ensures that both independent and correlated AUCs (e.g., the combined vs. individual signal scores) are appropriately tested.
Author Contributions
R.H., R.W.W., N.H.S., and E.H. wrote the manuscript; R.H., R.W.W., N.H.S., and E.H. designed the research; R.W.W., R.H., and E.H. performed the research and analyzed the data; W.D. contributed new reagents/analytical tools.
Study Highlights
Acknowledgments
This research was supported by National Institutes of Health grant U54-HG004028 for the National Center for Biomedical Ontology and by National Institute of General Medical Sciences grant GM101430-01A1. We thank Paul Koch for assistance with access to and analysis of search log information.
Footnotes
SUPPLEMENTARY MATERIAL is linked to the online version of the paper at http://www.nature.com/cpt
R.W.W. and E.H. are employed by Microsoft Research. W.D. is employed by Oracle. R.H. was a visiting researcher at Microsoft Research while conducting portions of this research. N.H.S. declared no conflict of interest.
Supplementary Material
References
- Lazarou, J., Pomeranz, B.H. & Corey, P.N. Incidence of adverse drug reactions in hospitalized patients: a meta-analysis of prospective studies. JAMA 279, 1200–1205 (1998). [DOI] [PubMed] [Google Scholar]
- Classen, D.C., Pestotnik, S.L., Evans, R.S., Lloyd, J.F. & Burke, J.P. Adverse drug events in hospitalized patients. Excess length of stay, extra costs, and attributable mortality. JAMA 277, 301–306 (1997). [PubMed] [Google Scholar]
- Ahmad, S.R. Adverse drug event monitoring at the Food and Drug Administration. J. Gen. Intern. Med. 18, 57–60 (2003). [DOI] [PMC free article] [PubMed] [Google Scholar]
- Harpaz, R., DuMouchel, W., Shah, N.H., Madigan, D., Ryan, P. & Friedman, C. Novel data-mining methodologies for adverse drug event discovery and analysis. Clin. Pharmacol. Ther. 91, 1010–1021 (2012). [DOI] [PMC free article] [PubMed] [Google Scholar]
- Harpaz, R., DuMouchel, W., LePendu, P., Bauer-Mehren, A., Ryan, P. & Shah, N.H. Performance of pharmacovigilance signal-detection algorithms for the FDA adverse event reporting system. Clin. Pharmacol. Ther. 93, 539–546 (2013). [DOI] [PMC free article] [PubMed] [Google Scholar]
- Platt, R., Wilson, M., Chan, K.A., Benner, J.S., Marchibroda, J. & McClellan, M. The new Sentinel network — improving the evidence of medical-product safety. New Eng J Med. 361, 645–647 (2009). [DOI] [PubMed] [Google Scholar]
- Avorn, J. & Schneeweiss, S. Managing drug-risk information — what to do with all those new numbers. New Eng J Med. 361, 647–649 (2009). [DOI] [PubMed] [Google Scholar]
- Stang, P.E. et al. Advancing the science for active surveillance: rationale and design for the Observational Medical Outcomes Partnership. Ann. Intern. Med. 153, 600–606 (2010). [DOI] [PubMed] [Google Scholar]
- McClellan, M. Drug safety reform at the FDA—pendulum swing or systematic improvement? N. Engl. J. Med. 356, 1700–1702 (2007). [DOI] [PubMed] [Google Scholar]
- Coloma, P.M. et al.; EU-ADR Consortium. Combining electronic healthcare databases in Europe to allow for large-scale drug safety monitoring: the EU-ADR Project. Pharmacoepidemiol. Drug Saf. 20, 1–11 (2011). [DOI] [PubMed] [Google Scholar]
- FDA Science Board Subcommittee: Review of the FDA/CDER Pharmacovigilance Program (Prepared for the FDA Science Board May 2011). <http://www.fda.gov/downloads/AdvisoryCommittees/CommitteesMeetingMaterials/ScienceBoardtotheFoodandDrugAdministration/UCM276888.pdf>. Accessed November 2013.
- Leaman, R., Wojtulewicz, L., Sullivan, R., Skariah, A., Yang, J. & Gonzalez, G. Towards Internet-age pharmacovigilance: extracting adverse drug reactions from user posts in health-related social networks. In Proceedings of the 2010 Workshop on Biomedical Natural Language Processing, Uppsala, Sweden, 15 July 2010, 117–125.
- Wicks, P., Vaughan, T.E., Massagli, M.P. & Heywood, J. Accelerated clinical discovery using self-reported patient data collected online and a patient-matching algorithm. Nat. Biotechnol. 29, 411–414 (2011). [DOI] [PubMed] [Google Scholar]
- Centers for Disease Control and Prevention (CDC). Use of the Internet for Health Information: United States, 2009. <http://www.cdc.gov/nchs/data/databriefs/db66.htm>. Accessed November 2013.
- Pew Research Center. Pew Internet & American Life Project: Health Online 2013. <http://www.pewinternet.org/~/media/Files/Reports/2013/Pew%20Internet%20Health%20Online%20report.pdf>. Accessed November 2013.
- Ginsberg, J., Mohebbi, M.H., Patel, R.S., Brammer, L., Smolinski, M.S. & Brilliant, L. Detecting influenza epidemics using search engine query data. Nature 457, 1012–1014 (2009). [DOI] [PubMed] [Google Scholar]
- White, R.W., Tatonetti, N.P., Shah, N.H., Altman, R.B. & Horvitz, E. Web-scale pharmacovigilance: listening to signals from the crowd. J. Am. Med. Inform. Assoc. 20, 404–408 (2013). [DOI] [PMC free article] [PubMed] [Google Scholar]
- Louis, T.A., Lavori, P.W., Bailar, J.C. 3rd & Polansky, M. Crossover and self-controlled designs in clinical research. N. Engl. J. Med. 310, 24–31 (1984). [DOI] [PubMed] [Google Scholar]
- Observational Medical Outcomes Partnership (OMOP). <http://omop.org/>. Accessed November 2013.
- Trifirò, G. et al.; EU-ADR group. Data mining on electronic health record databases for signal detection in pharmacovigilance: which events to monitor? Pharmacoepidemiol. Drug Saf. 18, 1176–1184 (2009). [DOI] [PubMed] [Google Scholar]
- DuMouchel, W. & Pregibon, D. Empirical bayes screening for multi-item associations. Proceedings of the Seventh ACM SIGKDD International Conference on Knowledge Discovery and Data Mining, San Francisco, CA, 26-29 August 2001, 67–76.
- Szarfman, A., Machado, S.G. & O’Neill, R.T. Use of screening algorithms and computer systems to efficiently signal higher-than-expected combinations of drugs and events in the US FDA’s spontaneous reports database. Drug Saf. 25, 381–392 (2002). [DOI] [PubMed] [Google Scholar]
- Alvarez, Y., Hidalgo, A., Maignen, F. & Slattery, J. Validation of statistical signal detection procedures in eudravigilance post-authorization data: a retrospective evaluation of the potential for earlier signalling. Drug Saf. 33, 475–487 (2010). [DOI] [PubMed] [Google Scholar]
- Almenoff, J.S., LaCroix, K.K., Yuen, N.A., Fram, D. & DuMouchel, W. Comparative performance of two quantitative safety signalling methods: implications for use in a pharmacovigilance department. Drug Saf. 29, 875–887 (2006). [DOI] [PubMed] [Google Scholar]
- Berlin, C. et al. Are all quantitative postmarketing signal detection methods equal? Performance characteristics of logistic regression and Multi-item Gamma Poisson Shrinker. Pharmacoepidemiol. Drug Saf. 21, 622–630 (2012). [DOI] [PubMed] [Google Scholar]
- Ryan, P.B., Madigan, D., Stang, P.E., Marc, O.J., Racoosin, J.A. & Hartzema, A.G. Empirical assessment of methods for risk identification in healthcare data: results from the experiments of the Observational Medical Outcomes Partnership. Stat. Med. 31, 4401–4415 (2012). [DOI] [PubMed] [Google Scholar]
- Hochberg, A.M., Reisinger, S.J., Pearson, R.K., O’Hara, D.J. & Hall, K. Using data mining to predict safety actions from FDA adverse event reporting system data. Drug Inf. J. 41, 633–643 (2007). [Google Scholar]
- Harpaz, R., DuMouchel, W., LePendu, P. & Shah, N.H. Empirical Bayes model to combine signals of adverse drug reactions. Proceedings of 2013 ACM SIGKDD International Conference on Knowledge Discovery and Data Mining (KDD’13), Chicago, IL, 11-14 August.
- Harpaz, R. et al. Combing signals from spontaneous reports and electronic health records for detection of adverse drug reactions. J. Am. Med. Inform. Assoc. 20, 413–419 (2013). [DOI] [PMC free article] [PubMed] [Google Scholar]
- LePendu, P. et al. Pharmacovigilance using clinical notes. Clin. Pharmacol. Ther. 93, 547–555 (2013). [DOI] [PMC free article] [PubMed] [Google Scholar]
- Shetty, K.D. & Dalal, S.R. Using information mining of the medical literature to improve drug safety. J. Am. Med. Inform. Assoc. 18, 668–674 (2011). [DOI] [PMC free article] [PubMed] [Google Scholar]
- Pouliot, Y., Chiang, A.P. & Butte, A.J. Predicting adverse drug reactions using publicly available PubChem BioAssay data. Clin. Pharmacol. Ther. 90, 90–99 (2011). [DOI] [PMC free article] [PubMed] [Google Scholar]
- Vilar, S., Harpaz, R., Chase, H.S., Costanzi, S., Rabadan, R. & Friedman, C. Facilitating adverse drug event detection in pharmacovigilance databases using molecular structure similarity: application to rhabdomyolysis. J. Am. Med. Inform. Assoc. 18 (suppl. 1), i73–i80 (2011). [DOI] [PMC free article] [PubMed] [Google Scholar]
- Ryan, P.B., Schuemie, M.J., Welebob, E., Duke, J., Valentine, S. & Hartzema, A.G. Defining a reference set to support methodological research in drug safety. Drug Saf. 36 (suppl. 1), S33–S47 (2013). [DOI] [PubMed] [Google Scholar]
- Ryan, P.B. et al. A comparison of the empirical performance of methods for a risk identification system. Drug Saf. 36 (suppl. 1), S143–S158 (2013). [DOI] [PubMed] [Google Scholar]
- Caster, O., Norén, G.N., Madigan, D. & Bate, A. Large-scale regression-based pattern discovery: the example of screening the WHO global drug safety database. Stat. Anal. Data Min. 3, 197–208 (2010). [Google Scholar]
- Cami, A., Arnold, A., Manzi, S. & Reis, B. Predicting adverse drug events using pharmacological network models. Science Translational Med. 3, 114ra127 (2011). [DOI] [PubMed] [Google Scholar]
- Systematized Nomenclature of Medicine-Clinical Terms (SNOMED CT). <http://www.ihtsdo.org/snomed-ct/>. Accessed November 2013.
- RxNorm. <http://www.nlm.nih.gov/research/umls/rxnorm/>. Accessed November 2013.
- Whetzel, P.L. et al. BioPortal: enhanced functionality via new Web services from the National Center for Biomedical Ontology to access and use ontologies in software applications. Nucleic Acids Res. 39, W541–W545 (2011). [DOI] [PMC free article] [PubMed] [Google Scholar]
- Beeferman, D. & Berger, A. Agglomerative clustering of a search engine query log. Proceedings of the Sixth ACM SIGKDD International Conference on Knowledge Discovery and Data Mining, Boston, Massachusetts, 20 August 2000.
- Graham, P.L., Mengersen, K. & Morton, A.P. Confidence limits for the ratio of two rates based on likelihood scores: non-iterative method. Stat. Med. 22, 2071–2083 (2003). [DOI] [PubMed] [Google Scholar]
- Robin, X. et al. pROC: an open-source package for R and S plus to analyze and compare ROC curves. BMC Bioinformatics 12, 77 (2011). [DOI] [PMC free article] [PubMed] [Google Scholar]
Associated Data
This section collects any data citations, data availability statements, or supplementary materials included in this article.