Abstract
Purpose:
In this work the authors develop and investigate the feasibility of a method to estimate time-varying volumetric images from individual MV cine electronic portal image device (EPID) images.
Methods:
The authors adopt a two-step approach to time-varying volumetric image estimation from a single cine EPID image. In the first step, a patient-specific motion model is constructed from 4DCT. In the second step, parameters in the motion model are tuned according to the information in the EPID image. The patient-specific motion model is based on a compact representation of lung motion represented in displacement vector fields (DVFs). DVFs are calculated through deformable image registration (DIR) of a reference 4DCT phase image (typically peak-exhale) to a set of 4DCT images corresponding to different phases of a breathing cycle. The salient characteristics in the DVFs are captured in a compact representation through principal component analysis (PCA). PCA decouples the spatial and temporal components of the DVFs. Spatial information is represented in eigenvectors and the temporal information is represented by eigen-coefficients. To generate a new volumetric image, the eigen-coefficients are updated via cost function optimization based on digitally reconstructed radiographs and projection images. The updated eigen-coefficients are then multiplied with the eigenvectors to obtain updated DVFs that, in turn, give the volumetric image corresponding to the cine EPID image.
Results:
The algorithm was tested on (1) Eight digital eXtended CArdiac-Torso phantom datasets based on different irregular patient breathing patterns and (2) patient cine EPID images acquired during SBRT treatments. The root-mean-squared tumor localization error is (0.73 ± 0.63 mm) for the XCAT data and (0.90 ± 0.65 mm) for the patient data.
Conclusions:
The authors introduced a novel method of estimating volumetric time-varying images from single cine EPID images and a PCA-based lung motion model. This is the first method to estimate volumetric time-varying images from single MV cine EPID images, and has the potential to provide volumetric information with no additional imaging dose to the patient.
Keywords: MV imaging, lung motion model, cine EPID images, 4DCT, treatment verification
I. INTRODUCTION
Real-time tumor and normal tissue localization during treatment has the potential to improve lung cancer treatment. Mobile lung tumors are routinely treated by adding margins to the target volume that account for respiratory motion. Margin sizes are established based on motion estimations made during treatment simulation. However, tumor motion has been shown to vary substantially during and between treatments for some patients.1 Combined with patient positioning errors, this means that margins based on motion estimates made from treatment simulation may not ensure adequate target coverage at the time of treatment. Expanded margins decrease the likelihood of target misses, but increase the normal tissue complication probability (NTCP).2–7 Accurate and reliable, real-time tumor localization during treatment could allow for margins to be reduced without sacrificing target coverage, permitting increased dose to be safely delivered to the tumor without an unacceptable increase in NTCP.
Electronic portal imaging device (EPID) images offer an appealing means of tumor localization during treatment.8,9 Most new linear accelerators (linacs) are equipped with an EPID. The EPID is used to generate images from the MV beam produced by the linac. These images are often used for patient positioning based on bony anatomy. Usually, the EPID is retracted after patient positioning, but EPID can be left out to collect exit radiation during treatment delivery. In cine mode, the EPID acquires a sequence of beams-eye-view (BEV) images during treatment. MV image based localization is appealing because: (1) no additional dose is delivered to the patient;10 (2) the tumor can be tracked directly, without relying on potentially unstable relationships with surrogates such as chest wall motion; and (3) the BEV is the most important angle for target position monitoring because the dose falloff in the direction parallel to the beam is much less than in the perpendicular cross-plane directions. Disadvantages of using BEV MV images are poor image quality compared to kV images and limited field of view since only anatomy within the field aperture is visible. A method capable of estimating volumetric time-varying images from EPID images that accurately captures anatomical variations could play an important role in motion management and adaptive radiotherapy.
In this work, we develop and assess the feasibility of a new algorithm that combines a principal component analysis (PCA)-based lung motion model with single cine EPID images, and demonstrate its ability to estimate volumetric time-varying treatment images and extract 3D tumor positions. This algorithm is comprised of two steps. In the first step a patient-specific lung-motion model is created using pretreatment information (i.e., 4DCT). In the second step, parameters in the motion model are tuned according to the information in the EPID image. We test the method on a digital phantom as well as patient images.
II. MATERIALS AND METHODS
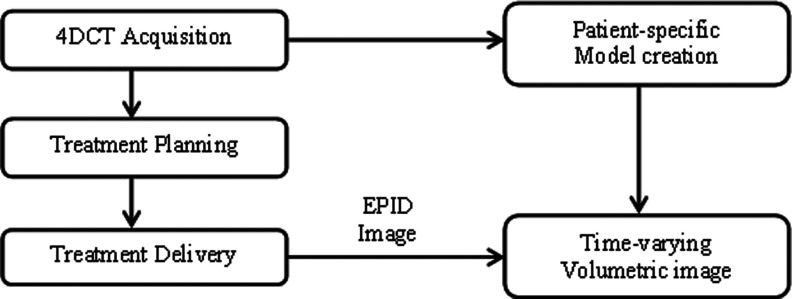
The proposed workflow for this algorithm is shown in Fig. 1. Before describing the workflow in detail, the definition of keys terms used in this paper are as follows.
FIG. 1.
Flowchart depicting data acquisition through time-varying volumetric image estimation.
II.A. Key terms used
There are several key terms used in Secs. II B and III C that describe the lung motion model and estimation of time-varying volumetric images. For clarity these terms are defined as follows.
Reference image: Displacement vector fields (DVFs) capture the incremental motion of voxels in a moving image with respect to voxels in a specific reference image. For our work, we used peak-exhale as the reference image.
Estimated time-varying volumetric image: Each in-treat-ment EPID image is combined with the patient-specific motion model to estimate a time-varying volumetric image. This volumetric image is an estimation of the patient anatomy at the time that EPID image was acquired.
Ground truth volumetric images/test images: For the digital phantom study, the accuracy of an estimated time-varying volumetric image is tested by comparing it to a volumetric image obtained directly from the digital phantom. We also refer to ground truth volumetric images as “test images.”
Simulated EPID images: 2D MV projection images generated using the digital phantom.
Optimization (digitally reconstructed radiograph) DRR: These are simulated 2D MV projection images created by applying the projection operator to the deformed reference image during iterative optimization of cost function in Eq. (2).
II.B. Data acquisition
II.B.1. Modified eXtended CArdiac-Torso (XCAT) phantom data
We used a modified XCAT digital phantom11,12 to simulate the process of time-varying image estimation. The modified XCAT phantom incorporates measured tumor trajectories and generates synchronized realistic anatomic motion. A detailed description of steps leading to adaptive calculation of chest wall and diaphragm motion and the generation of 3D data based on recorded tumor trajectories is described in Ref. 11. The 3D patient tumor trajectories used here were acquired with the Mitsubishi Real-Time Radiation Therapy (RTRT) system in the Radiation Oncology Clinic at the Nippon Telegraph and Telephone Company in Sapporo, Japan. Patients were implanted with two to four 1.5 mm diameter gold ball-bearings in or near the tumor. During treatment, one of these markers is tracked in real-time using stereotactic diagnostic x-ray fluoroscopy. An external surrogate system was integrated with RTRT. The signal from the surface is synchronized with the signal from the fluoroscopic unit so that the 3D tumor position and external marker position is obtained. These 3D tumor positions were then used to generate the data from modified XCAT phantom. These 3D tumor trajectories were acquired at 30 Hz. Complete information on the acquisition of these trajectories can be found in Refs. 13 and 14.
Data based on the modified XCAT phantom were generated for eight different patients; for each patient 100 phantoms corresponding to 30 s of breathing were used. Thus, a total of 800 phantoms (8 patients × 100 phantoms) corresponding to 240 s (8 patients × 30 s) were used for the first set of experiments. Each phantom had a resolution of 2 × 2 × 2.5 mm in the left-right (LR), anterior-posterior (AP), and superior-inferior (SI) directions, respectively. The overall dimension of each phantom was 256 × 256 × 120. For each case 10 phantoms, corresponding to one breathing cycle, were used to build the PCA lung motion model (as described in Sec. II C). Next, 800 phantoms were used to test the time-varying image estimation capability of the model. Simulated EPID images were generated for a field size of 50 × 40 mm2 and at a gantry angle of 45°. Thus, in total, 800 2D simulated EPID images corresponding to eight different tumor trajectories spanning over 240 s were used for testing.
II.B.2. Patient data
We also tested our algorithm on a set of patient 4DCT and EPID data acquired in our clinic. The 4DCT data was acquired using a sixteen-slice LightSpeed RT16 CT scanner (GE Medical Systems). The scanner was operated in an axial cine mode. The dimension of each voxel was 1.27 × 1.27 × 2.5 mm. The 4DCT data was used to build a patient-specific lung motion model (Sec. II C).
The EPID images were acquired during SBRT treatment on a Novalis Tx linac using 6 MV at 600 MU/min. The imager has a physical size of 40 × 30 cm and a physical resolution of 0.39 mm. For this study EPID images were acquired at 2 fps and half the maximum resolution (512 × 384 pixels). The SAD and SID for the linac were 100 and 180 cm, respectively. The field size defined by the MLC leaves was approximately 50 × 39 mm and the gantry angle was 20°. A total of 160 EPID images, corresponding to 80 s, were used.
II.C. Patient-specific PCA lung motion model
The PCA lung motion model uses a priori knowledge based on pretreatment images. The key idea behind building a motion model is to characterize the movement of each voxel over any given breathing period.15,16 The motion of voxels can be approximated via a set of DVFs corresponding to different phases.17–19 To compactly represent the salient components of DVFs, suitable basis function decomposition can be employed. The detailed steps to calculate DVFs and find an efficient representation are described below:
Displacement vector fields: For a given set of K volumetric images over a breathing cycle, deformable image registration (DIR) between a reference image and the rest of images produces (K-1) DVFs. We chose the volume corresponding to peak exhale as reference due to its reproducibility.13 3D volumetric DIR is based on Demon's algorithm. We used a parallel version of the Demons algorithm implemented on NVIDIA GPU and it has been well validated for lung CT.20
Basis function decomposition: To efficiently capture the salient components of voxel movement and reduce the dimensionality of the (K-1) DVFs, we employ a linear basis function decomposition based on PCA. PCA separates DVFs into a weighted linear combination of eigenvectors as follows:
| (1) |
where is the mean DVF, un represents eigenvectors, wn(t) are the corresponding eigen-coefficients, and N is the number of eigenvectors. For this work we use three eigenvectors, i.e., N = 3. The eigenvector decomposition decouples spatiotemporal information in the DVFs to time-dependent coefficients wn(t), space-dependent eigenvectors un, and a space-dependent . Thus, a change in eigen-coefficients can generate a new set of DVFs.
II.D. Estimation of time-varying volumetric images
The next step is the estimation of time-varying image from a cine EPID image. Sec. II C describes how the time dependent part of estimated volumetric images can be captured by updating eigen-coefficients. As proposed by Li et al.,17 eigen-coefficients are calculated by iterative cost function minimization to estimate each volumetric image. The cost function is
| (2) |
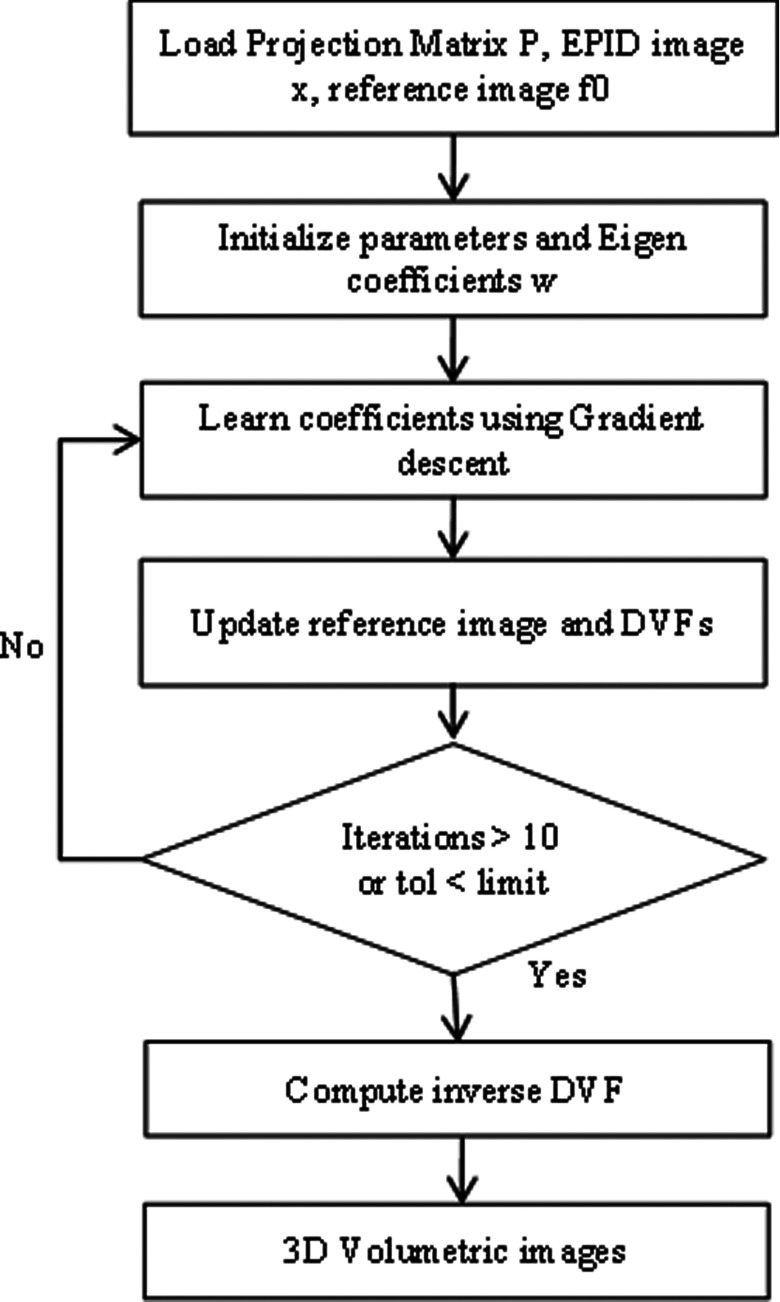
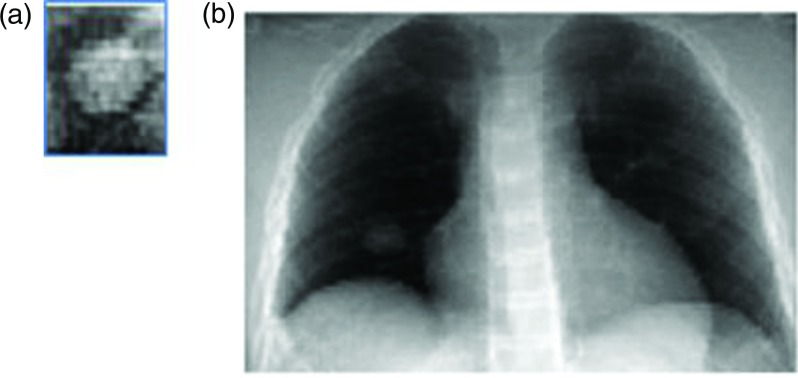
where J(w) is the objective function representing the squared L2-norm of the error between the 2D simulated EPID image x and the optimization DRR of the updated volume image f (obtained via deforming the reference image fo). The relative pixel intensity between the optimization MV DRR and the 2D simulated EPID image is represented by the parameter . P is the projection matrix21 that computes the optimization MV DRR for a 3D image f using Siddon's algorithm. A complete flowchart describing all steps for solving Eq. (2) via iterative minimization and calculating eigen-coefficients is shown in Fig. 2. A typical optimization MV DRR is shown in Fig. 3.
FIG. 2.
Flowchart showing steps for solving Eq. (2) via iterative optimization and calculating eigen-coefficients for a given MV EPID image.
FIG. 3.
(a) A typical MV DRR for a tumor in the right lung. (b) A kV DRR for the same shows its location in the right lower lobe.
II.E. Error metrics
To evaluate the accuracy of our algorithm we adopted two metrics, one to assess the global accuracy of the estimated volumetric image and another one to assess the local voxelwise accuracy:
-
(1)Estimated volumetric image accuracy: This metric calculates normalized voxelwise difference root mean square error (NRMSE). This metric is defined as follows:
where V is the estimated volumetric image and V* is the ground truth test image obtained from the modified XCAT phantom, i represents an individual voxel index, and L is the total number of voxels in the image. Estimated volumetric image accuracy is dimensionless, as it is a ratio of the sum of squared voxelwise intensity differences and the sum of squared voxelwise ground truth test images.The NRMSE evaluates the improvement in estimated volumetric image accuracy by comparing the “initial NRMSE” with the “final NRMSE”. The initial NRMSE is defined as the error between the reference image and the ground truth test image, whereas the final NRMSE refers to the error between the estimated volumetric image and the ground truth test image. As an improvement in estimated volumetric image accuracy is achieved, the estimated image becomes more similar to the ground truth image, and the final NRMSE is less than the initial NRMSE.
-
(2)
Tumor localization accuracy: This metric evaluates the accuracy of 3D tumor trajectories in time-varying estimated volumetric images. Tumor location is compared in all three LR, AP, and SI directions as well as 3D positions of the tumor centroid positions. This is a local assessment of geometric accuracy.
Both of these metrics help to assess the accuracy of time-varying volumetric images. While defining a “perfect” metric for accuracy evaluation is a challenging task, we choose these metrics in accordance with previously published work.17,19 Even though neither of the metrics simultaneously captures global and local displacement and intensity errors, reporting both metrics gives insight into the overall accuracy of the method.
III. RESULTS
III.A. Patient trajectory-based modified XCAT phantom results
The method was first tested on images generated from the XCAT phantom for eight different patient tumor trajectories. For each case, 10 phantoms corresponding to the first breathing period (simulating 4DCT) were used to train the PCA lung motion model. Next, 100 phantoms and corresponding simulated EPID images spanning 30 s were used for testing the algorithm. These experiments were performed with a fixed gantry angle of 20°. Gantry angle dependence is examined in Sec. III B. The diameter of the tumor is 2.0 cm (volume 4.18 cm3) and it is located in the right lower lobe. We have assumed a nondeformable tumor. Hence, the centroid of tumor should give us fair estimate of the tumor tracking. Ground truth in XCAT phantom was defined by motion vector fields (MVFs) corresponding to each respiratory phase. MVFs in XCAT give location of every voxel which was used to track tumor trajectories and delineate boundaries. In the estimated image, the tumor is defined using edge detection method. We use Canny edge detector to extract the contours of the tumor and these edges are then used to calculate the centroid of the tumor.
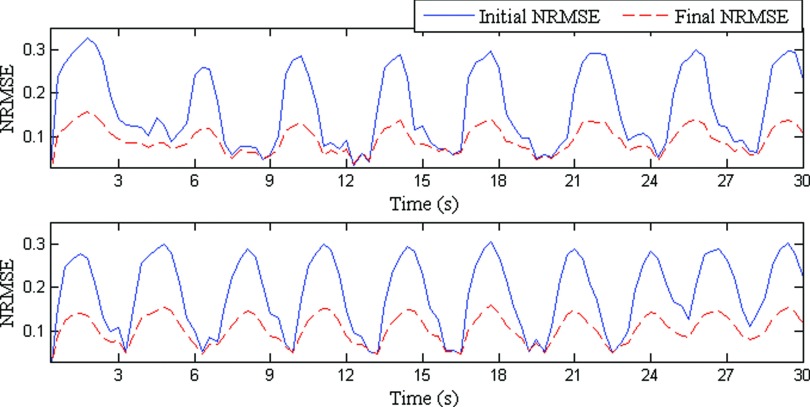
Figure 4 shows estimated volumetric image accuracies for two sample patients. Estimated volumetric image accuracies for all the eight patients are given in Table I. It can be observed in Fig. 4 that volumetric estimated images are always closer to the ground truth image than the reference image. The other key point to be observed from Table I is that both the mean and standard deviation of the final NRMSE is less than the initial NRMSE.
FIG. 4.
NRMSEs for two patients for approximately 30 s are shown. Solid blue lines represent the initial NRMSE and broken red lines show final NRMSE. In an ideal case, a flat dashed red line would indicate exact similarity between estimated and ground truth images.
TABLE I.
Comparison of volumetric image estimation accuracy based on initial and final NRMSE. The first column shows the NRMSE between test images and reference images while the second column shows the NRMSE between reference images and time-varying estimated volumetric images.
| Initial NRMSE | Final NRMSE | |
|---|---|---|
| 1 | 0.13 ± 0.06 | 0.09 ± 0.03 |
| 2 | 0.16 ± 0.09 | 0.09 ± 0.03 |
| 3 | 0.10 ± 0.04 | 0.08 ± 0.02 |
| 4 | 0.15 ± 0.06 | 0.12 ± 0.04 |
| 5 | 0.11 ± 0.05 | 0.08 ± 0.02 |
| 6 | 0.09 ± 0.04 | 0.07 ± 0.02 |
| 7 | 0.19 ± 0.09 | 0.11 ± 0.03 |
| 8 | 0.20 ± 0.08 | 0.12 ± 0.04 |
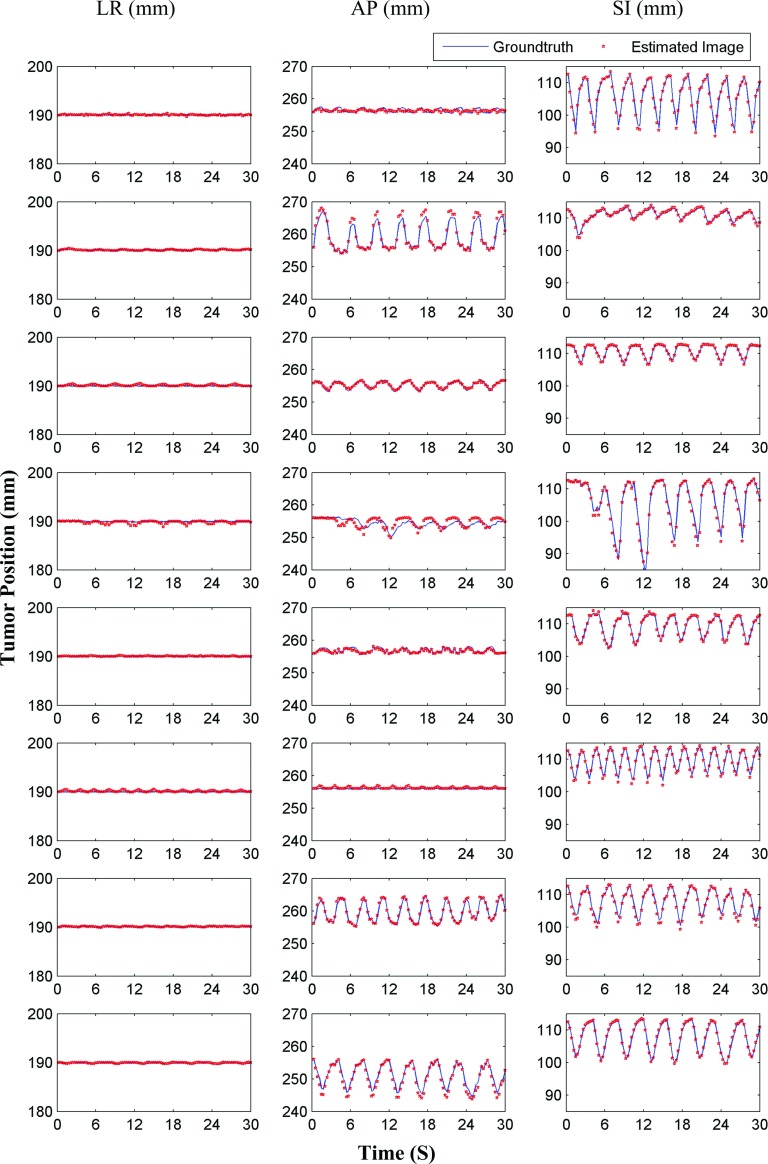
Tumor localization accuracies are shown in Fig. 5. In this figure, estimated and ground truth tumor centroid positions in the LR, AP, and SI directions are shown. The corresponding values for all cases are given in Table II. It can be observed from Fig. 5 that the estimated tumor trajectories closely follow the ground truth tumor trajectories. RMS values of tumor localization accuracies in LR, AP, and SI directions are (0.09 ± 0.13), (0.51 ± 0.56), and (0.37 ± 0.42) mm, respectively. The overall mean 3D tumor centroid localization accuracy is 0.73 ± 0.63 mm.
FIG. 5.
Tumor centroid positions for eight patients (based on XCAT phantoms) are shown. Solid blue lines show tumor centroid positions for ground truth 3D images, while the red dots show tumor centroid positions for estimated time-varying 3D images.
TABLE II.
Tumor localization accuracy for individual patients and their standard deviations are shown here. The last column shows errors for the tumor 3D positions. The mean tumor localization accuracy across the population is shown in the last row of the table.
| LR | AP | SI | 3D | |
|---|---|---|---|---|
| Patient # | (mm) | (mm) | (mm) | (mm) |
| 1 | 0.07 ± 0.06 | 0.52 ± 0.39 | 0.36 ± 0.25 | 0.67 ± 0.42 |
| 2 | 0.04 ± 0.03 | 0.63 ± 0.71 | 0.30 ± 0.25 | 0.75 ± 0.70 |
| 3 | 0.14 ± 0.16 | 0.26 ± 0.21 | 0.21 ± 0.10 | 0.40 ± 0.22 |
| 4 | 0.20 ± 0.25 | 1.02 ± 0.75 | 0.73 ± 0.82 | 1.46 ± 0.88 |
| 5 | 0.04 ± 0.04 | 0.27 ± 0.27 | 0.24 ± 0.17 | 0.42 ± 0.24 |
| 6 | 0.14 ± 0.15 | 0.25 ± 0.25 | 0.32 ± 0.29 | 0.45 ± 0.39 |
| 7 | 0.05 ± 0.03 | 0.28 ± 0.29 | 0.63 ± 0.52 | 0.73 ± 0.54 |
| 8 | 0.08 ± 0.06 | 0.86 ± 0.70 | 0.22 ± 0.11 | 0.94 ± 0.64 |
| Overall | 0.09 ± 0.13 | 0.51 ± 0.56 | 0.37 ± 0.42 | 0.73 ± 0.63 |
III.B. Gantry-angle dependence
To explore the dependency of accuracy on gantry angle, we conducted a set of 3D tumor tracking experiments for gantry angles ranging from 0° to 360° (at an increment of 30°). The tumor moved in a sinusoidal motion with 20 mm SI and 12 mm AP peak-to-peak amplitudes. The diameter of the tumor is 2.0 cm and the volume is 4.18 cm3 and it is located in the right lower lobe. We have assumed a nondeformable tumor. LR, AP, SI, and 3D tumor centroid errors between estimated tumor trajectories and ground truth are shown in Table III. The tracking accuracies show little or no variation due to change in gantry angle.
TABLE III.
Variations in tumor tracking error with respect to changing gantry angle.
| LR | AP | SI | 3D | |
|---|---|---|---|---|
| Gantry angle | (mm) | (mm) | (mm) | (mm) |
| 0 | 0.30 ± 0.29 | 0.49 ± 0.41 | 0.95 ± 1.02 | 1.19 ± 1.05 |
| 30 | 0.30 ± 0.31 | 0.25 ± 0.19 | 1.34 ± 1.50 | 1.46 ± 1.48 |
| 60 | 0.20 ± 0.14 | 0.52 ± 0.37 | 1.17 ± 1.21 | 1.33 ± 1.23 |
| 90 | 0.34 ± 0.34 | 0.43 ± 0.29 | 1.22 ± 1.49 | 1.43 ± 1.45 |
| 120 | 0.13 ± 0.16 | 0.19 ± 0.14 | 1.24 ± 1.29 | 1.32 ± 1.23 |
| 150 | 0.12 ± 0.13 | 0.27 ± 0.23 | 1.15 ± 1.02 | 1.21 ± 1.02 |
| 180 | 0.14 ± 0.15 | 0.31 ± 0.31 | 1.03 ± 0.96 | 1.11 ± 0.98 |
| 210 | 0.20 ± 0.17 | 0.23 ± 0.20 | 1.29 ± 1.37 | 1.39 ± 1.33 |
| 240 | 0.13 ± 0.10 | 0.54 ± 0.36 | 0.85 ± 0.88 | 1.04 ± 0.92 |
| 270 | 0.33 ± 0.32 | 0.47 ± 0.36 | 1.03 ± 1.30 | 1.26 ± 1.30 |
| 300 | 0.11 ± 0.14 | 0.22 ± 0.14 | 1.21 ± 1.25 | 1.30 ± 1.20 |
| 330 | 0.09 ± 0.07 | 0.23 ± 0.17 | 1.16 ± 1.19 | 1.21 ± 1.17 |
| Overall | 0.20 ± 0.22 | 0.35 ± 0.30 | 1.14 ± 1.17 | 1.27 ± 1.16 |
III.C. Patient data
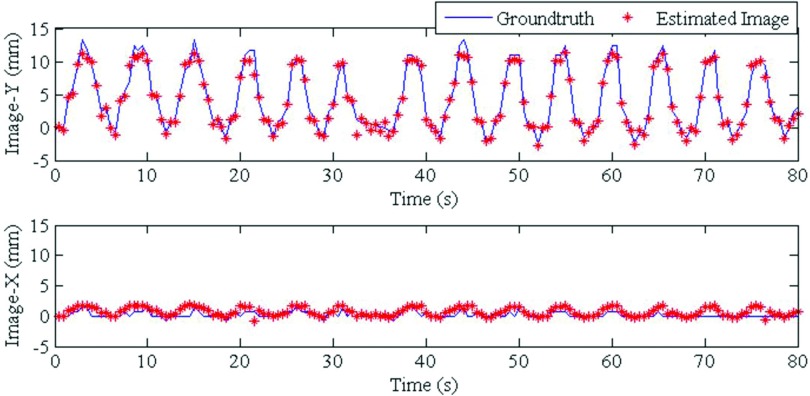
4DCT images acquired 12 days prior to treatment were used to build the PCA lung motion model. The estimated volumetric image accuracy was tested for 160 EPID images corresponding to 80 s. These images were acquired and anonymized with our clinic's Institutional Review Board approval. The tracking results of our model were compared to the method developed by Rottmann et al.,9 which has been well-validated using manual tracking by experts. Figure 6 shows the result for one EPID image. The image on the left shows the cine EPID image and the next three images show coronal, sagittal, and axial slices from the corresponding time-varying estimated volumetric image. The tumor localization accuracy is shown in Fig. 7. The red line shows the tumor position from the time-varying estimated volumetric images (projected onto the imager plane) and the blue line shows the ground truth tumor trajectory of the Rottmann et al.9 While the estimated tumor position is in 3D, ground truth is only available in 2D. For comparison to our results, we extracted the tumor centroid from our estimated 3D images using a Canny filter as explained for the XCAT portion.
FIG. 6.

Coronal (middle-left), sagittal (middle-right), and axial (right) slices from a volumetric fluoroscopic image estimated from a single EPID image (left).
FIG. 7.
Tumor centroid positions for the patient data are shown. Solid blue lines show tumor centroid positions for ground truth images, while red dots show tumor centroid positions for estimated time-varying volumetric images. Image-Y and Image-X are the Y and X directions on the imager.
The tumor localization accuracies for the patient data in 2D for Image-Y and Image-X (the two imager directions) are (0.55 ± 0.5) and (0.50 ± 0.56) mm, respectively. 2D tumor centroid localization accuracy is (0.90 ± 0.65) mm. These errors have been scaled back to the isocenter and are, thus, ∼100/180 of the error in the imager plane. NRMSE cannot be computed for the patient data because no 3D ground truth image exists.
IV. DISCUSSION
We introduced a new method to estimate a volumetric image from a single cine EPID image and did initial testing of its feasibility on XCAT digital phantom data derived from patient breathing patterns, and on an example patient case. The method relies on building a patient-specific lung motion model from pretreatment 4DCT images, then adapting the model parameters to incorporate updated information from the cine EPID images. The lung motion model captures the spatial and temporal information in eigenvectors and eigen-coefficients respectively. The in-treatment information from each cine EPID image is incorporated by updating eigen-coefficients via iterative cost function optimization. These updated coefficients, in conjunction with eigenvectors, generate an updated set of DVFs, which are then used to estimate time-varying volumetric images.
Our results in the phantom data and the example patient case showed tumor localization errors on the order of 1 mm. The errors reported in the section on gantry angle dependence are larger than 1 mm, possible due to the large breathing motion used for this experiment. The global image accuracy, quantified in initial and final NRMSE, showed improved overall accuracy in the final time-varying volumetric images. It can be observed from Fig. 4 that the final NRMSE value is roughly periodic, with a period same as the patient's breathing. This could reflect the relative difficulty of employing the model to estimate images at phases far from the reference (end of exhale) phase. Using multiple references phases could potentially reduce this effect at the price of increased computational expense. While far from comprehensive, these initial results are promising, and suggest that future investigation on larger patient datasets could be worthwhile to investigate this technology further.
EPID-based time-varying estimated volumetric image estimation holds promise as an important tool. The key advantage of this technique is that without exposing the patient to extra dose we can obtain the 3D location of the tumor and normal structures. This information could be useful for the assessment of dose delivered to the tumor and healthy tissues.
The overall accuracy of time-varying volumetric image estimation depends upon factors such as EPID and 4DCT image quality and resolution, and 4DCT sorting artifacts. Another potential source of error comes from the fact that the patient-specific model is based on 4DCT data for a single breathing cycle. The pretreatment breathing pattern might differ from the breathing pattern during treatment delivery. However, previous studies have demonstrated that this model is robust to changes in breathing period, amplitude, and baseline shifts throughout a range of normal breathing patterns.17,19 Anatomical changes between 4DCT acquisition and treatment delivery could still pose a major challenge (e.g., pleural effusion, tumor shrinking, atelectasis, stomach filling). In the future this problem could be mitigated by building motion models from 4DCBCT on the day of treatment as opposed to 4DCT from simulation. The proposed model is based on MV projection images from BEV. This makes it useful for 3D conformal radiotherapy. Cases where the BEV is not available or lesions are not very clear, e.g., in IMRT, the proposed model might need extra information to estimate the 3D volumetric images. For future work, it would be interesting to explore methods to incorporate supplementary information (e.g., implanted markers) and extend the current model to IMRT.
V. CONCLUSION
In this work, we have introduced an algorithm to estimate time-varying volumetric images from single cine EPID images. The key advantage of EPID-based estimated volumetric image generation is that no additional dose is given to the patient. We tested the algorithm in two sets of experiments. In the first set of experiments, we employed 3D data generated from the modified XCAT phantom for eight different tumor trajectories. In the second set of experiments, cine EPID images from a lung SBRT patient treated in our clinic were used. In both cases, the algorithm was capable of estimating time-varying volumetric images with sub-millimeter tumor localization accuracy. To our knowledge, this algorithm is the first to estimate a volumetric image from a single cine EPID image.
ACKNOWLEDGMENTS
The authors would like to express their gratitude to Dr. Seiko Nishioka of the Department of Radiology, NTT Hospital, Sapporo, Japan and Dr. Hiroki Shirato of the Department of Radiation Medicine, Hokkaido University School of Medicine, Sapporo, Japan for sharing the 3D patient tumor position dataset. This project was supported, in part, through a Master Research Agreement with Varian Medical Systems, Inc., Radiological Society of North America Research Scholar Grant Nos. RSCH1206 (J.H.L.) and NIH/NCI 1K99CA166186 (R.L.).
REFERENCES
- 1.Keall P. J., Mageras G. S., Balter J. M., Emery R. S., Forster K. M., Jiang S. B., Kapatoes J. M., Low D. A., Murphy M. J., Murray B. R., Ramsey C. R., Van Herk M. B., Vedam S. S., Wong J. W., and Yorke E., “The management of respiratory motion in radiation oncology report of AAPM Task Group 76,” Med. Phys. 33, 3874–3900 (2006). 10.1118/1.2349696 [DOI] [PubMed] [Google Scholar]
- 2.Cardinale R. M., Wu Q., Benedict S. H., Kavanagh B. D., Bump E., and Mohan R., “Determining the optimal block margin on the planning target volume for extracranial stereotactic radiotherapy,” Int. J. Radiat. Oncol., Biol., Phys. 45, 515–520 (1999). 10.1016/S0360-3016(99)00203-5 [DOI] [PubMed] [Google Scholar]
- 3.Kontrisova K., Stock M., Dieckmann K., Bogner J., Potter R., and Georg D., “Dosimetric comparison of stereotactic body radiotherapy in different respiration conditions: A modeling study,” Radiother Oncol. 81, 97–104 (2006). 10.1016/j.radonc.2006.08.006 [DOI] [PubMed] [Google Scholar]
- 4.Martel M. K., Ten Haken R. K., Hazuka M. B., Kessler M. L., Strawderman M., Turrisi A. T., Lawrence T. S., Fraass B. A., and Lichter A. S., “Estimation of tumor control probability model parameters from 3-D dose distributions of non-small cell lung cancer patients,” Lung Cancer 24, 31–37 (1999). 10.1016/S0169-5002(99)00019-7 [DOI] [PubMed] [Google Scholar]
- 5.McGarry R. C., Papiez L., Williams M., Whitford T., and Timmerman R. D., “Stereotactic body radiation therapy of early-stage non-small-cell lung carcinoma: Phase I study,” Int. J. Radiat. Oncol., Biol., Phys. 63, 1010–1015 (2005). 10.1016/j.ijrobp.2005.03.073 [DOI] [PubMed] [Google Scholar]
- 6.Okunieff P., Morgan D., Niemierko A., and Suit H. D., “Radiation dose-response of human tumors,” Int. J. Radiat. Oncol., Biol., Phys. 32, 1227–1237 (1995). 10.1016/0360-3016(94)00475-Z [DOI] [PubMed] [Google Scholar]
- 7.Wulf J., Baier K., Mueller G., and Flentje M. P., “Dose-response in stereotactic irradiation of lung tumors,” Radiother. Oncol. 77, 83–87 (2005). 10.1016/j.radonc.2005.09.003 [DOI] [PubMed] [Google Scholar]
- 8.Berbeco R. I., Hacker F., Zatwarnicki C., Park S. J., Ionascu D., O’Farrell D., and Mamon H. J., “A novel method for estimating SBRT delivered dose with beam's-eye-view images,” Med. Phys. 35, 3225–3231 (2008). 10.1118/1.2938514 [DOI] [PubMed] [Google Scholar]
- 9.Rottmann J., Aristophanous M., Chen A., Court L., and Berbeco R., “A multi-region algorithm for markerless beam's-eye view lung tumor tracking,” Phys. Med. Biol. 55, 5585–5598 (2010). 10.1088/0031-9155/55/18/021 [DOI] [PubMed] [Google Scholar]
- 10.Kilby W. and Savage C., “The effect of the Varian amorphous silicon electronic portal imaging device on exit skin dose,” Phys. Med. Biol. 48, 3117–3128 (2003). 10.1088/0031-9155/48/19/002 [DOI] [PubMed] [Google Scholar]
- 11.Mishra P., St James S., Segars W. P., Berbeco R. I., and Lewis J. H., “Adaptation and applications of a realistic digital phantom based on patient lung tumor trajectories,” Phys. Med. Biol. 57, 3597–3608 (2012). 10.1088/0031-9155/57/11/3597 [DOI] [PMC free article] [PubMed] [Google Scholar]
- 12.Segars W. P., Sturgeon G., Mendonca S., Grimes J., and Tsui B. M., “4D XCAT phantom for multimodality imaging research,” Med. Phys. 37, 4902–4915 (2010). 10.1118/1.3480985 [DOI] [PMC free article] [PubMed] [Google Scholar]
- 13.Berbeco R. I., Mostafavi H., Sharp G. C., and Jiang S. B., “Towards fluoroscopic respiratory gating for lung tumours without radiopaque markers,” Phys. Med. Biol. 50, 4481–4490 (2005). 10.1088/0031-9155/50/19/004 [DOI] [PubMed] [Google Scholar]
- 14.Shirato H., Oita M., Fujita K., Watanabe Y., and Miyasaka K., “Feasibility of synchronization of real-time tumor-tracking radiotherapy and intensity-modulated radiotherapy from viewpoint of excessive dose from fluoroscopy,” Int. J. Radiat. Oncol., Biol., Phys. 60, 335–341 (2004). 10.1016/j.ijrobp.2004.04.028 [DOI] [PubMed] [Google Scholar]
- 15.Low D. A., Parikh P. J., Lu W., Dempsey J. F., Wahab S. H., Hubenschmidt J. P., Nystrom M. M., Handoko M., and Bradley J. D., “Novel breathing motion model for radiotherapy,” Int. J. Radiat. Oncol., Biol., Phys. 63, 921–929 (2005). 10.1016/j.ijrobp.2005.03.070 [DOI] [PubMed] [Google Scholar]
- 16.Sohn M., Birkner M., Yan D., and Alber M., “Modelling individual geometric variation based on dominant eigenmodes of organ deformation: Implementation and evaluation,” Phys. Med. Biol. 50, 5893–5908 (2005). 10.1088/0031-9155/50/24/009 [DOI] [PubMed] [Google Scholar]
- 17.Li R., Lewis J. H., Jia X., Gu X., Folkerts M., Men C., Song W. Y., and Jiang S. B., “3D tumor localization through real-time volumetric x-ray imaging for lung cancer radiotherapy,” Med. Phys. 38, 2783–2794 (2011). 10.1118/1.3582693 [DOI] [PubMed] [Google Scholar]
- 18.Li R., Lewis J. H., Jia X., Zhao T., Liu W., Wuenschel S., Lamb J., Yang D., Low D. A., and Jiang S. B., “On a PCA-based lung motion model,” Phys. Med. Biol. 56, 6009–6030 (2011). 10.1088/0031-9155/56/18/015 [DOI] [PMC free article] [PubMed] [Google Scholar]
- 19.Mishra P., Li R., James S. S., Mak R. H., Williams C. L., Yue Y., Berbeco R. I., and Lewis J. H., “Evaluation of 3D fluoroscopic image generation from a single planar treatment image on patient data with a modified XCAT phantom,” Phys. Med. Biol. 58, 841–858 (2013). 10.1088/0031-9155/58/4/841 [DOI] [PMC free article] [PubMed] [Google Scholar]
- 20.Gu X., Pan H., Liang Y., Castillo R., Yang D., Choi D., Castillo E., Majumdar A., Guerrero T., and Jiang S. B., “Implementation and evaluation of various demons deformable image registration algorithms on a GPU,” Phys. Med. Biol. 55, 207–219 (2010). 10.1088/0031-9155/55/1/012 [DOI] [PMC free article] [PubMed] [Google Scholar]
- 21.Siddon R. L., “Calculation of the radiological depth,” Med. Phys. 12, 84–87 (1985). 10.1118/1.595739 [DOI] [PubMed] [Google Scholar]


