Abstract
IMPORTANCE
Determining the annual rate of change in the width of the inner segment ellipsoid zone (EZ; ie, inner/outer segment border) in the context of short-term variability should allow us to better understand the value of this measure for future treatment trials in X-linked retinitis pigmentosa (XLRP).
OBJECTIVES
To identify the width of the central region showing an EZ and to determine the short-term repeat variability and the annual rate of change in the width of the EZ from spectral-domain optical coherence tomography (SD-OCT) measures in RP.
DESIGN
Patients with recessive or simplex RP (age range, 8–65 years; mean age, 40.5 years) underwent scanning twice on the same day to evaluate test-retest variability. Patients with XLRP (age range, 8–27 years; mean age, 15.2 years) from a larger group participating in an ongoing double-blind treatment trial (docosahexaenoic acid vs placebo; clinicaltrials.gov NCT00100230) underwent spectral-domain optical coherence tomography line scanning across the horizontal meridian at 3 yearly intervals.
SETTING
Research center specializing in medical retina.
PARTICIPANTS
Forty-eight patients with RP, including 20 with recessive or simplex RP and 28 with XLRP, and 23 healthy control subjects.
MAIN OUTCOME AND MEASURE
Widths of the EZ calculated and compared among the 3 annual visits.
RESULTS
Test-retest differences were normally distributed, and the magnitude of the difference was independent of mean EZ width. The mean (SD) for test-retest differences in EZ width was 0.08° (0.22°) (range, −0.30° to 0.60°). Thus, 95%of all test-retest differences fall within ±0.43° (124 µm). Of the 28 patients with XLRP, 27 showed a significant decrease in EZ width after 2 years. Patients with XLRP showed a mean annual decrease in EZ width of 0.86° (248 µm, or 7%).
CONCLUSIONS AND RELEVANCE
The mean rate of decline in EZ width (7%) translates into a mean rate of change of 13%for the equivalent area of functioning retina. This rate of change is consistent with that reported for visual fields and full-field electroretinograms. Unlike visual fields and electroretinograms, however, the repeat variability is less than the annual rate of change. These results support the validity of EZ width as an outcome measure in prospective clinical trials in RP.
Retinitis pigmentosa (RP) refers to a genetically heterogeneous group of inherited retinal degenerations causing early night blindness, progressive visual field constriction, and characteristic fund us abnormalities. The slow rate of progression in measures of visual function has been a deterrent for treatment trials in patients with RP. Visual acuity typically remains stable until late in the disease’s progression.1,2 Kinetic visual fields begin to constrict after a critical age,3 but the annual rate of decline varies from5%to 20% depending on the isopter and RP genotype.4–7 Static perimetry, which evolved primarily for the detection of glaucomatous field defects, has been used as a primary outcome measure in clinical trials in RP,8,9 as has the full-field electroretinogram (ERG), especially to 30-Hz flicker.10,11 However, trial durations of several years are necessary because the rate of progression in these measures is low, especially when compared with the intervisit variability.
Spectral-domain optical coherence tomography (SD-OCT) measures of structural changes in the outer segment (OS) layer have been proposed as possible outcome measures for clinical trials of RP.12Ten laminar boundaries can be distinguished with current SD-OCT clinical devices, leading to 9 identifiable retinal layers.13 Of these, the most immediately relevant to progression in RP are the OS layer, the inner segment (IS) layer, and the outer nuclear layer. A previous study14 demonstrated that the region of the retina showing an IS ellipsoid zone (EZ), previously referred to as the IS/OS border, can be directly related to the visual field boundary. The goal of the present study was to use segmentation of retinal layers to identify the width of the central region showing an EZ. To determine test-retest variability, we measured the retinal width of the EZ twice during a short interval in patients with autosomal recessive or simplex RP. To determine the value of this measure for evaluating the rate of disease progression, we measured the EZ width in patients with X-linked RP (XLRP) on 3 annual visits. Determining the annual rate of change in EZ width in the context of short-term variability allowed us to better understand the value of this measure for future treatment trials.
Methods
Patients
Measures were obtained from 48 patients with RP diagnosed byophthalmologists specializing in medical retina. Twenty patients with recessive or simplex RP(age range, 8–65 years; mean age, 40.5 years) underwent scanning twice on the same day to evaluate test-retest variability. Twenty-eight patients with XLRP(age range, 8–27 years; meanage, 15.2 years) from a larger group participating in an ongoing double-blind treatment trial (docosahexaenoic acid vs placebo; clinicaltrials.gov NCT00100230), underwent SD-OCT line scanning across the horizontal meridian at 3 yearly intervals (visits A, B, and C). Patients from the larger trial were included if the central 30° of the central retina included regions with and without an EZ. Reference values were obtained from23 control subjects with normal vision.12 All procedures adhered to the Declaration of Helsinki and were approved by the institutional review board at The University of Texas Southwestern Medical Center.
Acquisition of Data
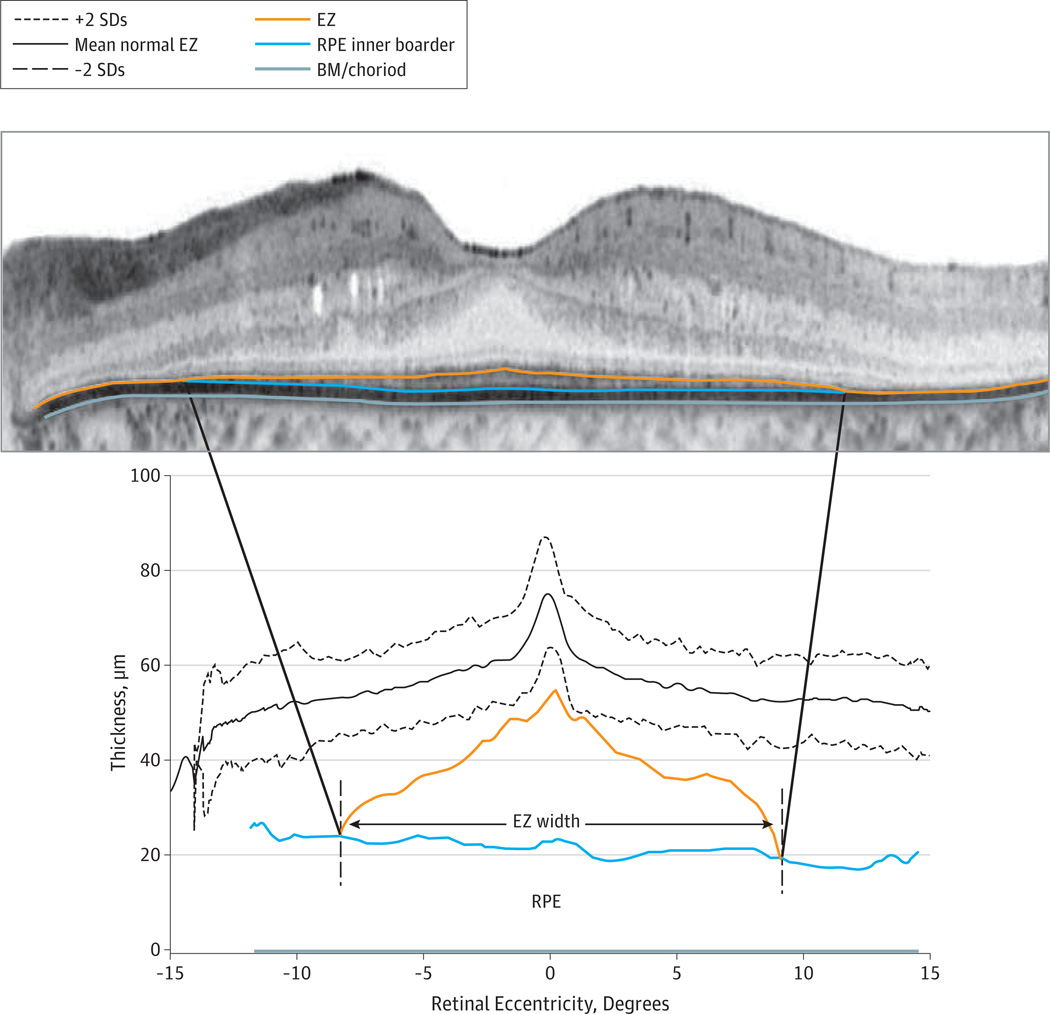
The SD-OCT measures were obtained with a commercial device (Spectralis Heidelberg retina angiography + OCT; Heidelberg Engineering Inc). Automatic real-time registration was used with a mean of 100 scans. All scans had a quality index greater than 25 dB. Subsequent scans were captured with the aid of automatic registration to ensure the same scan placement on each test. Manual segmentation was aided by subroutines written in commercially available software (Igor Pro 6.03A; Wave Metrics, Inc) and were based on previously published routines (Matlab; Math Works).12 The following 3 boundaries were identified (Figure 1): between the Bruch membrane and choroid, between the photoreceptor OS and the retinal pigment epithelium, and the EZ. For all scans, the nasal and temporal borders of the EZ were defined as the locations where the thickness of the OS layer had declined to zero. The width of the EZ was defined as the horizontal distance between these 2 locations. The EZ widths were calculated and compared among visits. The Shapiro-Wilk normality test was used to assess the normality of EZ width distributions. Short-term test-retest variability was assessed by using a Bland-Altman plot. Paired t tests were used to evaluate possible changes in EZ widths among the annual visits.
Figure 1.
Spectral-Domain Optical Coherence Tomography Scan of the Horizontal Midline in a Patient With X-Linked Retinitis Pigmentosa
Segmentation lines for the inner segment ellipsoid zone (EZ; inner/outer segment border) line band, the outer segment–retinal pigment epithelium (OS-RPE) junction, and the Bruch membrane (BM)–choroid junction are superimposed on the scan. The OS thickness relative to the normal mean EZ (2 SDs) for 23 healthy subjects is shown below. Vertical dashed lines indicate the retinal eccentricities at which OS thickness drops to 0 (ie, EZ becomes indistinguishable from the RPE).
Results
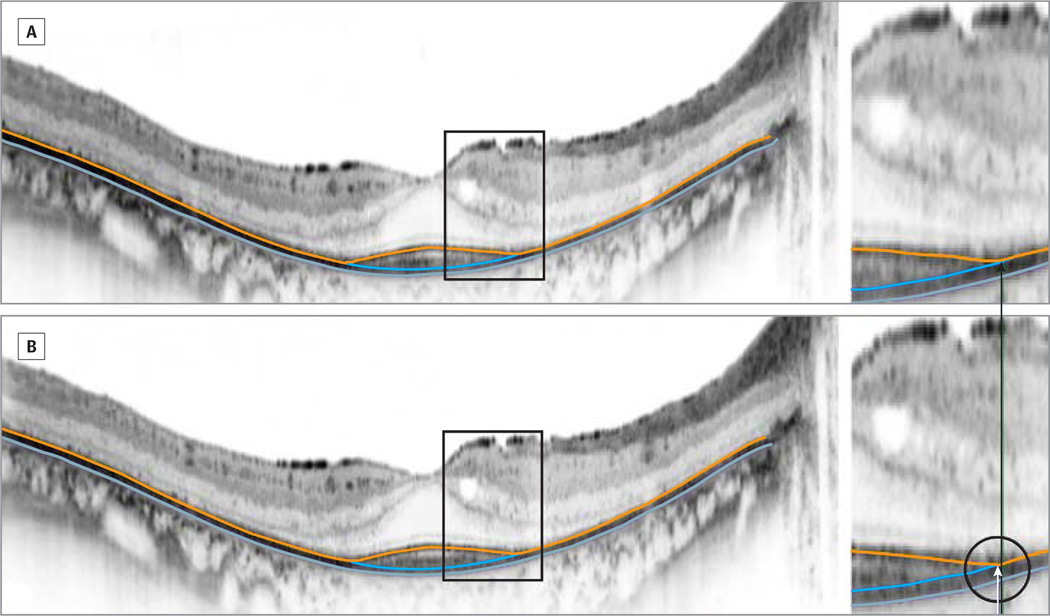
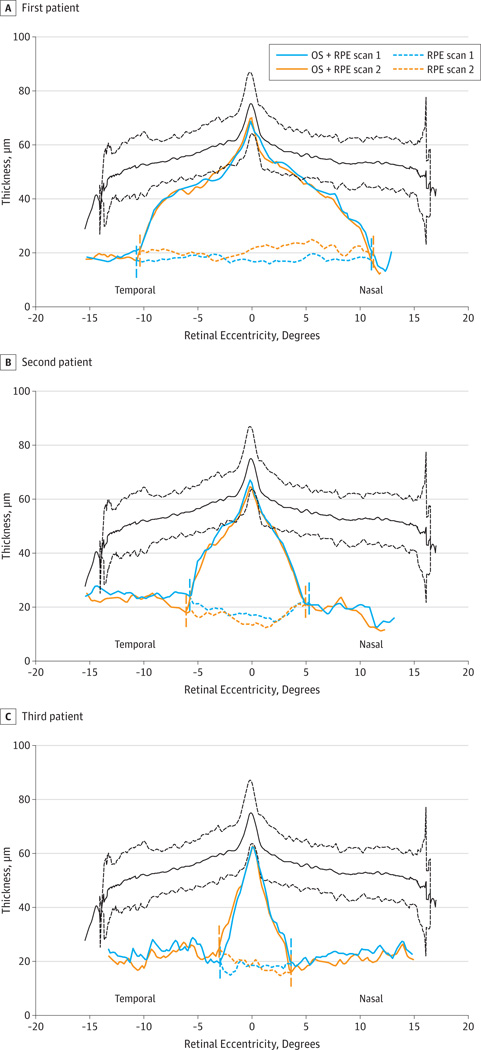
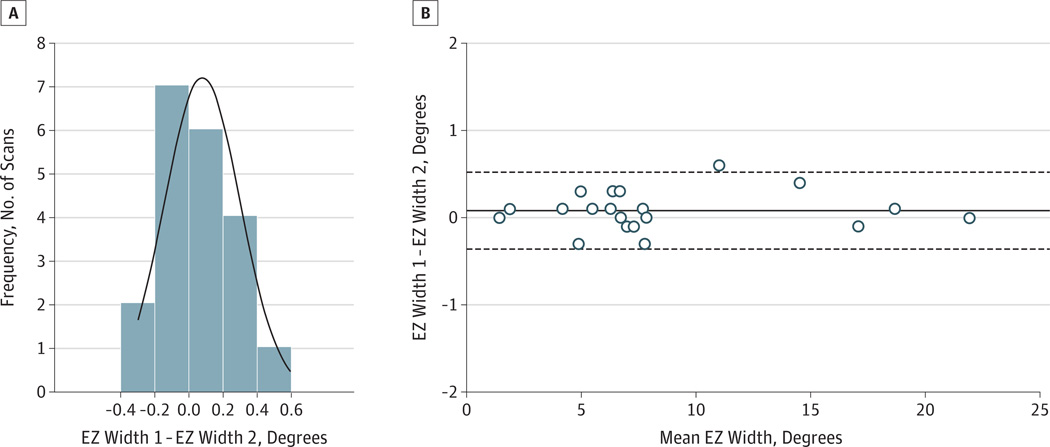
Figure 2 depicts representative midline scans with superimposed segmentation lines from a patient who underwent scanning twice on the same day. Segmentation lines from 3 patients with arange of EZ widths are plotted separately inFigure 3. We found good agreement between test-retest measures regardless of EZ width. Test-retest differences were normally distributed (Figure 4A), and the magnitude of the difference was independent of mean EZ width (Figure 4B). The mean (SD) for test-retest differences in EZ width was 0.08° (0.22°) (range, −0.30° to0.60°).Thus95%of all test-retest differences fell within ±0.43° (124 µm).With a mean EZ width of 12° in these patients, the resulting test-retest variability was 3.6%.
Figure 2.
Spectral-Domain Optical Coherence Tomography Scans of the Horizontal Midline From a Patient With Autosomal Recessive Retinitis Pigmentosa Undergoing Scanning Twice on the Same Day
A and B, Magnified views of the transition zone are shown to the right. The first and second scans differed in inner segment ellipsoid zone (inner/outer segment border) width by 0.3° (86 µm).
Figure 3.
Test-Retest Measures From 3 Patients With Autosomal Recessive Retinitis Pigmentosa Exhibiting a Range of Inner Segment Ellipsoid Zone (EZ; Inner/Outer Segment Border) Widths
Thickness of the outer segment plus retinal pigment epithelium (OS + RPE) on scans 1 and 2 and thickness of the RPE on scans 1 and 2 when it is distinguishable from the EZ band are depicted. Vertical dashed lines indicate the horizontal extent of the EZ band. Solid and broken black lines indicate mean EZ thickness of 2 SDs for 23 healthy subjects.
Figure 4.
Test-Retest Differences
A, Test-retest differences were normally distributed with a mean of 0.08° (solid curve shows fit of Shapiro-Wilk normality test to distribution of widths [n = 20]). EZ indicates inner segment ellipsoid zone (inner/outer segment border). B, The magnitude of the test-retest difference for EZ was independent of the mean EZ width.
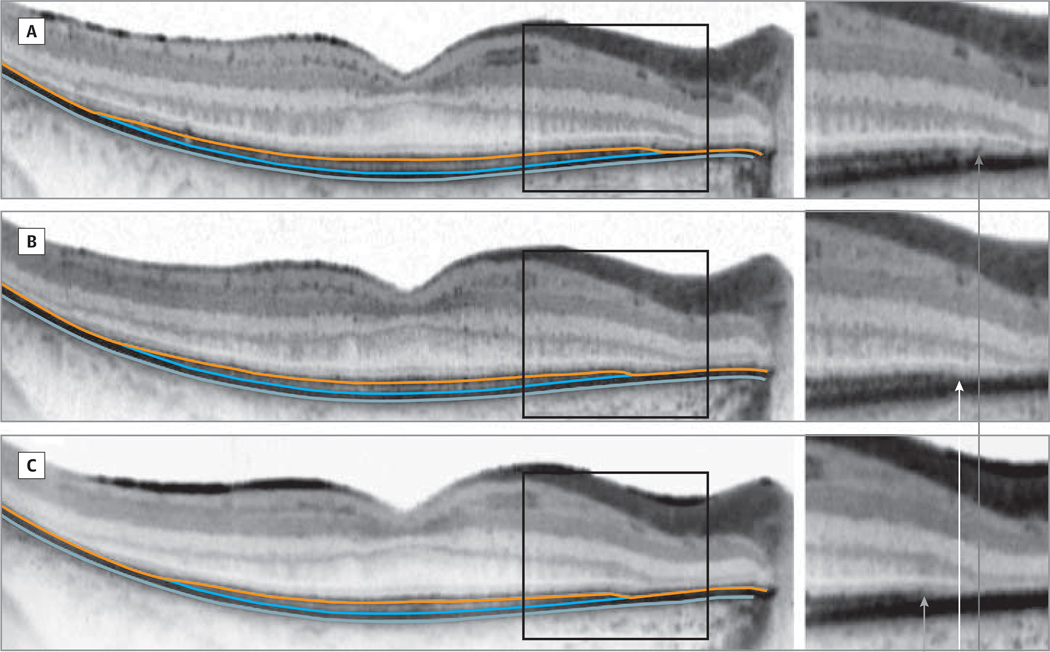
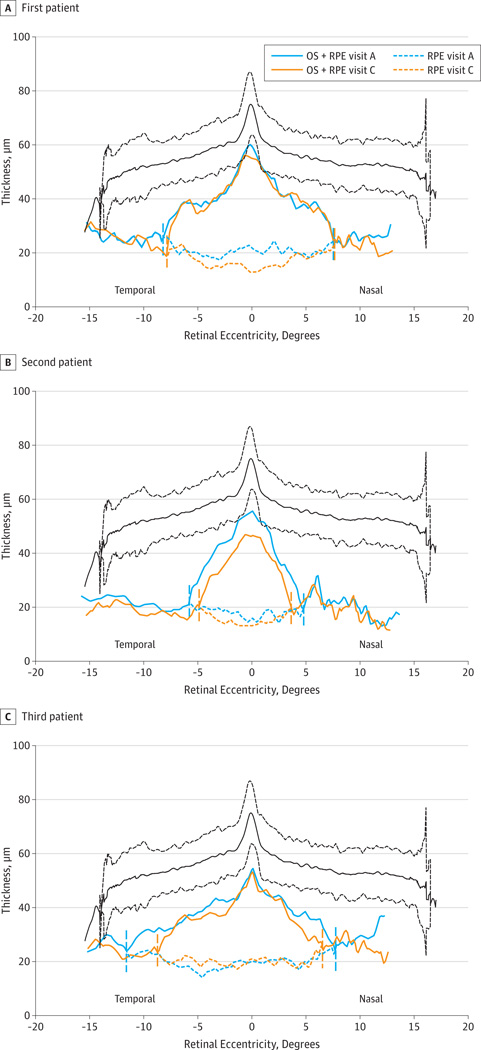
Representative scans from a patient with XLRP during the 3 annual visits are shown in Figure 5. At higher magnification (insets), the nasal edge of the EZ can be seen moving closer to the fovea each year as indicated by the arrows. Movement toward the fovea is also apparent at the temporal margin of the EZ. Sample segmentations demonstrating minimal, medium, and large rates of yearly change are shown in Figure 6.
Figure 5.
Representative Scans From a Patient With X-Linked Retinitis Pigmentosa Across 3 Annual Visits
At the right is shown the inset at higher magnification. Arrows indicate the nasal edge of the inner segment ellipsoid zone (EZ; inner/outer segment border) each year. We detected a progressive shift in the remaining EZ band toward the center during the 3 annual visits.
Figure 6.
Annual Measures From 3 Patients With X-Linked Retinitis Pigmentosa
These 3 patients demonstrate the range of annual loss in inner segment ellipsoid zone (EZ; inner/outer segment border) width. Outer segment plus retinal pigment epithelium (OS + RPE) thickness on the first (visit A) and third (visit C) annual visits and thickness of the RPE when it is distinguishable from the EZ line on visits A and C are depicted. Vertical dashed lines indicate the horizontal extent of the EZ line. Solid and broken black lines indicate mean EZ thickness (2 SD) for 23 healthy subjects. A, This patient had a small decrease in EZ after 2 years. B, The second patient demonstrated average progression. C, The third patient demonstrated fast progression.
Of the 28 patients with XLRP, 27 had a significant decrease (>0.43°) in EZ width in 2 years. Average EZ widths and annual changes are shown in the Table.Mean EZ widths were significantly different for each pair of years (P < .001, paired t tests). During the 2-year follow-up interval, the mean EZ decrease was 1.72° (495 µm).
Table.
Average EZ Widths and Annual Changes
| Visit | Degenerations, Degrees | Decrease, % | P Value | |
|---|---|---|---|---|
| Mean (SE) Ellipsoid Zone Width | Decrease From Previous Year | |||
| Year 1 | 12.4 (1.1) | |||
| Year 2 | 11.5 (1.0) | 0.90 | 7.3 | <.001 |
| Year 3 | 10.7 (1.0) | 0.80 | 7.0 | <.001 |
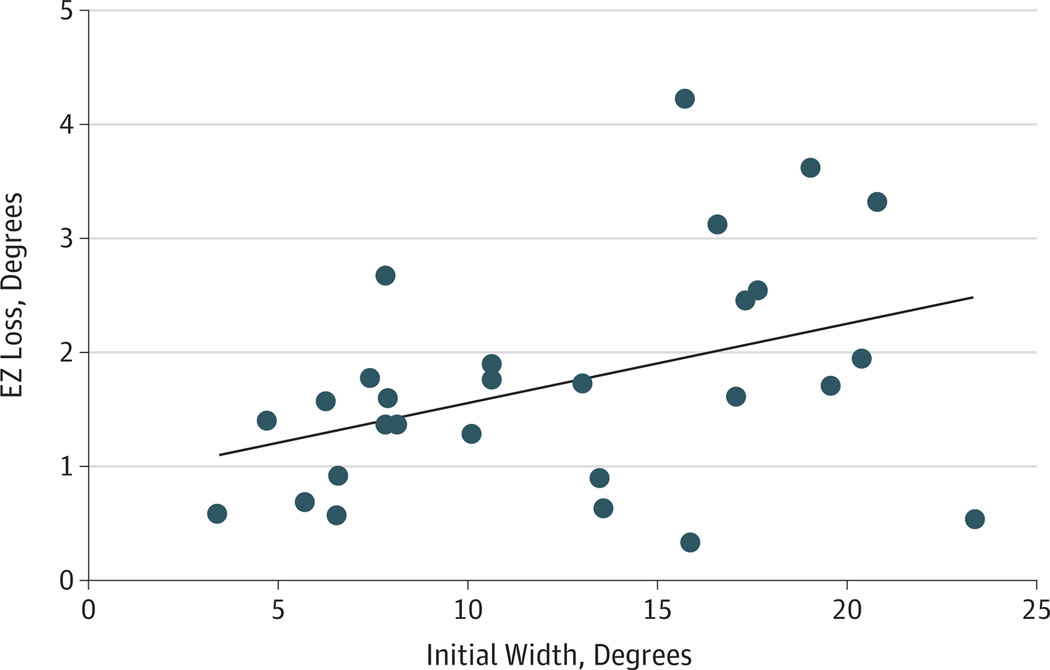
We found a weak relationship between the magnitude of EZ loss in 2 years and the initial width of the EZ band (Figure 7). The tendency was for EZ loss to be greater when the initial width of the EZ band was greater and to lessen as the edges of the EZ band approached the fovea.
Figure 7.
Relationship Between the Magnitude of Inner Segment Ellipsoid Zone (EZ; Inner/Outer Segment Border) Loss During 2 Years and Initial Width of EZ
We detected a weak tendency for the magnitude of EZ loss to decrease in proportion to the initial EZ diameter (r2 = 0.16[P = .03]).
Discussion
By monitoring the width of the EZ band, we can detect degenerative loss across 1-year intervals in most patients with XLRP. The decreases are small, averaging 248 µm/y. Yearly decreases of this magnitude, which equates to 0.86°/y, could not be detected in individual patients by standard perimetry owing toits limited resolution and lower reproducibility. The mean annual decrease in EZ width of 0.86° (7%) translates as a 13% mean annual rate of change for the equivalent area of the EZ. A13% mean rate of change is consistent with the reported rate of change in visual fields and cone full-field ERGs in XLRP. In 2004, Hoffman et al11 reported that the mean annual rate of cone ERG amplitude loss in 4 years was 12.5% in the placebo group of a randomized trial in XLRP. Others have reported rates of decline for patients with RP without regard to genetic type. Thus, annual rates ranging from 10% to 17.1% have been reported in prospective natural history studies and randomized trials.5,10
Retest variability for EZ width was independent of average EZ width, suggesting that this measure may be appropriate for patients at different stages of disease as long as the edge of the EZ can be imaged. We did find some preliminary evidence, however, that the rate of progression, expressed as the percentage of loss per year, may not be constant with the stage of disease. We detected a weak but significant tendency (Figure 7) for the rate of EZ contraction to slow as the EZ approached the fovea. This finding is consistent with slowing in the rate of progression reported in ERGs and late-stage disease.15
Similarities between the annual rates of change in the width of the EZ and in the full-field cone ERG are at least consistent with both measures indexing the extent of relatively healthy retina. Another indication that the EZ might be a suitable surrogate end point in clinical trials comes from direct structure function correlations between OCT variables and visual sensitivity. At multiple locations throughout the central retina, the relative sensitivity in static perimetryis proportional to the relative thickness of the OS layer on SD-OCT.16 Large changes in visual field sensitivity on either side of the EZ boundary, defined by the edge of the EZ, are found.14 Thus, converging evidence from numerous studies suggests that the position at which the EZ disappears provides a structural-marker for the edge of the visual field.
As a measure of progression, the EZ has the advantage of being a physical measure with low repeat variability. In the present study, 95% of all test-retest differences were less than 0.43° (124 µm), which is comparable to the repeat variability reported by others.17 For the patients with RP included in the test-retest analysis, who had a mean EZ width of 12° (3.5 mm), the threshold for significant change (with 95% confidence) was 3.6%. This change value is considerably lower than values typically reported for the full field ERG and visual field. The threshold for significant change in full-field ERG cone flicker (with 95% confidence) ranges from 30% to 50%.5,18–22 Because field measurements with kinetic perimetry largely depend on the skill of the perimetrist, thresholds for significant change in field area vary from 20% to 40%.5,23,24 For static perimetry, the threshold for significant change in total sensitivity is on the order of 20%.11,25 Thus, high variability coupled with the slow rate of decline necessitates trials of several years’ duration when using ERG or visual field as the primary outcome measure.
The utility of EZ width as an outcome measure may not be limited to RP. The edge of the EZ band has been quantitatively assessed in choroideremia,26 Usher syndrome type 2,27 and Stargardt disease.26 Among these entities, disease specific variations occur in the relative damage to the RPE,OS, and outer nuclear layer within a transition zone from healthy to severely affected regions of the retina. For example, the disappearance of the EZ line and thinning of the OS and outer nuclear layer is much more abrupt in choroideremia and Stargardt disease than in RP. These abrupt transitions are consistent with the more abrupt transitions between seeing and non-seeing areas of visual field in these diseases relative to RP. Changes in EZ width over time in these diseases will be interesting to follow up.
Our results suggest that EZ width might be considered a structural surrogate for the visual field inRP. Before its acceptance as a primary end point, however, EZ width needs to be further validated against quality-of-life instruments and accepted psychophysical measures.
Acknowledgments
Funding/Support: This study was supported by grant FD-R-02543 from the US Food and Drug Administration; by grant EY09076 from the National Eye Institute; by Foundation Fighting Blindness; and by DSM Nutritional Products.
Footnotes
Author Contributions: Study concept and design: Birch.
Acquisition of data: K. G. Locke, K. I. Locke, Hoffman.
Analysis and interpretation of data: Birch, K. G. Locke, Wen, K. I. Locke, Hood.
Drafting of the manuscript: Birch, Hood.
Critical revision of the manuscript for important intellectual content: Birch, K. G. Locke, Wen, Hoffman.
Statistical analysis: Birch, K. G. Locke, Wen, Hood. Obtained funding: Birch, Hoffman.
Administrative, technical, and material support: K. G. Locke, Hood.
Study supervision: Birch, Hood.
Conflict of Interest Disclosures: Dr Hoffman reports serving as a consultant for DSM Nutritional Products. Dr Hood reports serving as a consultant for Topcon.
REFERENCES
- 1.Holopigian K, Greenstein V, Seiple W, Carr RE. Rates of change differ among measures of visual function in patients with retinitis pigmentosa. Ophthalmology. 1996;103(3):398–405. doi: 10.1016/s0161-6420(96)30679-9. [DOI] [PubMed] [Google Scholar]
- 2.Fishman GA. Retinitis pigmentosa: visual loss. Arch Ophthalmol. 1978;96(7):1185–1188. doi: 10.1001/archopht.1978.03910060019004. [DOI] [PubMed] [Google Scholar]
- 3.Massof RW, Dagnelie G, Benzschawel T, Palmer RW, Finkelstein D. First order dynamics of visual field loss in retinitis pigmentosa. Clin Vis Sci. 1990;5(1):1–26. [Google Scholar]
- 4.Grover S, Fishman GA, Anderson RJ, Alexander KR, Derlacki DJ. Rate of visual field loss in retinitis pigmentosa. Ophthalmology. 1997;104(3):460–465. doi: 10.1016/s0161-6420(97)30291-7. [DOI] [PubMed] [Google Scholar]
- 5.Berson EL, Sandberg MA, Rosner B, Birch DG, Hanson AH. Natural course of retinitis pigmentosa over a three-year interval. Am J Ophthalmol. 1985;99(3):240–251. doi: 10.1016/0002-9394(85)90351-4. [DOI] [PubMed] [Google Scholar]
- 6.Massof RW, Finkelstein D. Two forms of autosomal dominant primary retinitis pigmentosa. Doc Ophthalmol. 1981;51(4):289–346. doi: 10.1007/BF00143336. [DOI] [PubMed] [Google Scholar]
- 7.Grover S, Fishman GA, Brown J., Jr Patterns of visual field progression in patients with retinitis pigmentosa. Ophthalmology. 1998;105(6):1069–1075. doi: 10.1016/S0161-6420(98)96009-2. [DOI] [PubMed] [Google Scholar]
- 8.Berson EL, Rosner B, Sandberg MA. Clinical trial of lutein in patients with retinitis pigmentosa receiving vitamin A. Arch Ophthalmol. 2010;128(4):403–411. doi: 10.1001/archophthalmol.2010.32. [DOI] [PMC free article] [PubMed] [Google Scholar]
- 9.Berson EL, Rosner B, Sandberg MA. Clinical trial of docosahexaenoic acid in patients with retinitis pigmentosa receiving vitamin A treatment. Arch Ophthalmol. 2004;122(9):1297–1305. doi: 10.1001/archopht.122.9.1297. [DOI] [PubMed] [Google Scholar]
- 10.Berson EL, Rosner B, Sandberg MA. A randomized trial of vitamin A and vitamin E supplementation for retinitis pigmentosa. Arch Ophthalmol. 1993;111(6):761–772. doi: 10.1001/archopht.1993.01090060049022. [DOI] [PubMed] [Google Scholar]
- 11.Hoffman DR, Locke KG, Wheaton DH, Fish GE, Spencer R, Birch DG. A randomized, placebo-controlled clinical trial of docosahexaenoic acid supplementation for X-linked retinitis pigmentosa. Am J Ophthalmol. 2004;137(4):704–718. doi: 10.1016/j.ajo.2003.10.045. [DOI] [PubMed] [Google Scholar]
- 12.Hood DC, Lin CE, Lazow MA, Locke KG, Zhang X, Birch DG. Thickness of receptor and post-receptor retinal layers in patients with retinitis pigmentosa measured with frequency-domain optical coherence tomography. Invest Ophthalmol Vis Sci. 2009;50(5):2328–2336. doi: 10.1167/iovs.08-2936. [DOI] [PMC free article] [PubMed] [Google Scholar]
- 13.Curcio CA, Messinger JD, Sloan KR, Mitra A, McGwin G, Spaide RF. Human chorioretinal layer thicknesses measured in macula-wide, high-resolution histologic sections. Invest Ophthalmol Vis Sci. 2011;52(7):3943–3954. doi: 10.1167/iovs.10-6377. [DOI] [PMC free article] [PubMed] [Google Scholar]
- 14.Hood DC, Ramachandran R, Holopigian K, Lazow M, Birch DG, Greenstein VC. Method for deriving visual field boundaries from OCT scans of patients with retinitis pigmentosa. Biomed Opt Express. 2011;2(5):1106–1114. doi: 10.1364/BOE.2.001106. [DOI] [PMC free article] [PubMed] [Google Scholar]
- 15.Berson EL, Rosner B, Sandberg MA. Further evaluation of docosahexaenoic acid in patients with retinitis pigmentosa receiving vitamin A treatment: subgroup analyses. Arch Ophthalmol. 2004;122(9):1306–1314. doi: 10.1001/archopht.122.9.1306. [DOI] [PubMed] [Google Scholar]
- 16.Rangaswamy NV, Patel HM, Locke KG, Hood DC, Birch DG. A comparison of visual field sensitivity to photoreceptor thickness in retinitis pigmentosa. Invest Ophthalmol Vis Sci. 2010;51(8):4213–4219. doi: 10.1167/iovs.09-4945. [DOI] [PMC free article] [PubMed] [Google Scholar]
- 17.Hood DC, Cho J, Raza AS, Dale EA, Wang M. Reliability of a computer-aided manual procedure for segmenting optical coherence tomography scans. OptomVis Sci. 2011;88(1):113–123. doi: 10.1097/OPX.0b013e3181fc3625. [DOI] [PMC free article] [PubMed] [Google Scholar]
- 18.Grover S, Fishman GA, Birch DG, Locke KG, Rosner B. Variability of full-field electroretinogram responses in subjects without diffuse photoreceptor cell disease. Ophthalmology. 2003;110(6):1159–1163. doi: 10.1016/S0161-6420(03)00253-7. [DOI] [PubMed] [Google Scholar]
- 19.Birch DG, Anderson JL, Fish GE. Yearly rates of rod and cone functional loss in retinitis pigmentosa and cone-rod dystrophy. Ophthalmology. 1999;106(2):258–268. doi: 10.1016/S0161-6420(99)90064-7. [DOI] [PubMed] [Google Scholar]
- 20.Birch DG, Hood DC, Locke KG, Hoffman DR, Tzekov RT. Quantitative electroretinogram measures of phototransduction in cone and rod photoreceptors: normal aging, progression with disease, and test-retest variability. Arch Ophthalmol. 2002;120(8):1045–1051. doi: 10.1001/archopht.120.8.1045. [DOI] [PubMed] [Google Scholar]
- 21.Jacobi PC, Miliczek KD, Zrenner E. Experiences with the international standard for clinical electroretinography: normative values for clinical practice, interindividual and intraindividual variations and possible extensions. Doc Ophthalmol. 1993;85(2):95–114. doi: 10.1007/BF01371126. [DOI] [PubMed] [Google Scholar]
- 22.Fishman GA, Chappelow AV, Anderson RJ, Rotenstreich Y, Derlacki DJ. Short-term inter-visit variability of ERG amplitudes in normal subjects and patients with retinitis pigmentosa. Retina. 2005;25(8):1014–1021. doi: 10.1097/00006982-200512000-00010. [DOI] [PubMed] [Google Scholar]
- 23.Ross DF, Fishman GA, Gilbert LD, Anderson RJ. Variability of visual field measurements in normal subjects and patients with retinitis pigmentosa. Arch Ophthalmol. 1984;102(7):1004–1010. doi: 10.1001/archopht.1984.01040030806021. [DOI] [PubMed] [Google Scholar]
- 24.Bittner AK, Iftikhar MH, Dagnelie G. Test-retest, within-visit variability of Goldmann visual fields in retinitis pigmentosa. Invest Ophthalmol Vis Sci. 2011;52(11):8042–8046. doi: 10.1167/iovs.11-8321. [DOI] [PMC free article] [PubMed] [Google Scholar]
- 25.Seiple W, Clemens CJ, Greenstein VC, Carr RE, Holopigian K. Test-retest reliability of the multifocal electroretinogram and Humphrey visual fields in patients with retinitis pigmentosa. Doc Ophthalmol. 2004;109(3):255–272. doi: 10.1007/s10633-005-0567-0. [DOI] [PubMed] [Google Scholar]
- 26.Lazow MA, Hood DC, Ramachandran R, et al. Transition zones between healthy and diseased retina in choroideremia (CHM) and Stargardt disease (STGD) as compared to retinitis pigmentosa (RP) Invest Ophthalmol Vis Sci. 2011;52(13):9581–9590. doi: 10.1167/iovs.11-8554. [DOI] [PMC free article] [PubMed] [Google Scholar]
- 27.Jacobson SG, Aleman TS, Sumaroka A, et al. Disease boundaries in the retina of patients with Usher syndrome caused by MYO7A gene mutations. Invest Ophthalmol Vis Sci. 2009;50(4):1886–1894. doi: 10.1167/iovs.08-3122. [DOI] [PubMed] [Google Scholar]


