

Abstract
The transcription factor Foxp3 is indispensable for the ability of regulatory T (Treg) cells to suppress fatal inflammation. Here, we characterized the role of Foxp3 in chromatin remodeling and regulation of gene expression in actively suppressing Treg cells in an inflammatory setting. Although genome-wide Foxp3 occupancy of DNA regulatory elements was similar in resting and in vivo activated Treg cells, Foxp3-bound enhancers were poised for repression only in activated Treg cells. Following activation, Foxp3-bound sites showed reduced chromatin accessibility and selective H3K27 tri-methylation, which was associated with Ezh2 recruitment and downregulation of nearby gene expression. Thus, Foxp3 poises its targets for repression by facilitating formation of repressive chromatin in regulatory T cells upon their activation in response to inflammatory cues.
Regulatory T (Treg) cells inhibit inflammatory responses under physiological conditions, during acute and chronic infections, and at mucosal surfaces colonized by commensal microorganisms1,2. The bulk of peripheral Treg cells in a homeostatic setting persist in a “resting” or “naïve” state characterized by only limited, if any, suppressor activity. Upon inflammatory challenge, cytokine receptor and TCR driven signals elicit Treg cell suppressor activity through induction of various effectors of suppression. Treg cells isolated from these activating environments can have increased suppressive ability and potently curtail disease upon adoptive cell transfer1,2.
Although various mechanisms contribute to Treg cell activity in different biological contexts, Foxp3 expression is indispensable for Treg cell suppressor function3,4. Loss of Foxp3 protein in differentiated Treg cells results in their functional deficiency5. This observation suggested that Foxp3 might open a unique set of enhancers of genes responsible for Treg cell suppressor function; however, recent examination of the enhancer and DNA methylation landscapes in ex vivo isolated Treg cells and their precursors revealed that Foxp3 binds largely to enhancers that are pre-established in a Foxp3-independent manner6,7. While these studies showed that other factors have a major impact on the Treg cell enhancer landscape formed prior to Foxp3 induction, the role of Foxp3 itself in regulating gene expression in Treg cells remained poorly understood. For instance, consensus is lacking on the basic means of Foxp3-mediated control of gene expression with some reports suggesting a role for Foxp3 as an activator, or as a repressor, or both8–15.
Here, we investigated Foxp3-dependent mechanisms of gene regulation in Treg cells during active suppression of inflammatory responses. We explored changes in chromatin landscapes and gene expression associated with Foxp3 binding in an in vivo acute inflammatory environment induced by transient depletion of Treg cells using Foxp3DTR mice16. While a previous study of Foxp3-transfected hybridoma cells indicated that Foxp3 binding to biologically relevant targets and their regulation may be dependent on TCR-triggered activation of cells10, we found that Foxp3 binds the same set of regulatory elements in both resting and actively suppressing Treg cells. In response to inflammatory cues, however, the Foxp3 complex incorporates Polycomb-group protein Ezh2 and directs deposition of repressive chromatin modifications at Foxp3-bound loci. Our results suggest that Foxp3 acts predominantly as a repressor and mediates a novel mode of chromatin regulation, namely inflammation induced repression of poised loci pre-bound by Foxp3.
RESULTS
Characterization of in vivo activated Treg cells
We explored a role for Foxp3 at a genomic level in Treg cells actively engaged in suppression of widespread inflammatory responses which they normally control. To induce such generalized inflammation we transiently depleted Treg cells upon brief administration of diphtheria toxin (DT) into Foxp3DTR mice, expressing human DT receptor under control of the endogenous Foxp3 locus16 (Supplementary Fig. 1a). As previously described, effector CD4+ and CD8+ T cells became highly activated, expanded in numbers and produced TH1, TH2, and TH17 type cytokines upon transient Treg cell deprivation. After DT withdrawal, Treg cell numbers rebounded by day 7–10 and the inflammatory response subsided 4–5 weeks after initial DT administration (data not shown). We analyzed the activated Treg and T effector (Teff) cells on day 11. At this time point, large numbers of activated effector CD4+ and CD8+ T cells still remained and Treg cell populations were expanded (Fig. 1a, Supplementary Fig. 1b,c). These Treg cells exhibited an activated phenotype (increased expression of CTLA4, CD25, ICOS, CXCR3 and GITR) in comparison to resting Treg cells present in control Foxp3DTR mice (Fig. 1b, Supplementary Fig. 1d; data not shown). Importantly, Foxp3 was more abundantly expressed in activated versus resting Treg cells (Fig. 1c). The increased amount of Foxp3 and activation markers implied heightened suppressor function of Treg cells rebounding in the inflammatory environment of DT-treated Foxp3DTR mice. Indeed, Treg cells isolated (>99% purity) from DT-treated Foxp3DTR mice were more potent (~5 times on a per cell basis) suppressors of in vitro effector T cell proliferation than their counterparts isolated from control mice (Fig. 1d). These results indicate that activated Treg cells isolated from DT-treated Foxp3DTR mice were actively suppressing autoimmune inflammation.
Figure 1.
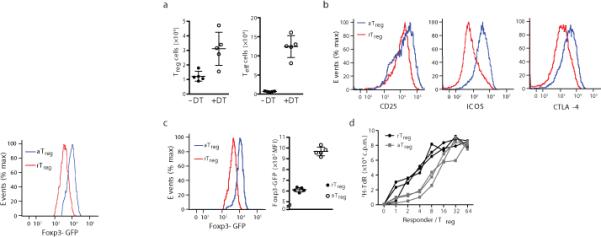
Isolation and functional characterization of in vivo activated Treg cells. (a) Expansion of Teff (CD44hiCD62Llo) and Foxp3+ Treg cell subsets in cells sorted from diphtheria toxin (DT) treated Foxp3DTR mice. Activated Treg (aTreg) and resting Treg (rTreg) cells were isolated from DT and untreated Foxp3DTR mice, respectively. (b) Flow cytometric analysis of CTLA-4, ICOS, and CD25 on aTreg cells. The results represent one of three independent experiments each with three or more mice per group. (c) Foxp3 expression is elevated in aTreg vs. rTreg cells. (d) aTreg cells are more suppressive than resting Treg cells. In vitro proliferation of responder CD4+ T cells in the presence of titrated amounts of sorted Treg cells in 72 h cultures was assessed by 3H-thymidine (3HTdR) labeling during the last 8 h. The data are shown as mean counts per minute (CPM) 3H-TdR incorporation in triplicate cultures. Cells were isolated using an Aria II FACS instrument from DT-treated and untreated Foxp3DTR mice (3 mice per group).
To explore whether this activated state of Treg cells featured a unique transcriptional program, we analyzed gene expression in highly purified activated and resting Treg cells from DT-treated and control Foxp3DTR mice, respectively (Supplementary Table 1). These transcriptional profiles were then compared to those of activated and resting conventional Foxp3– CD4+ T cells isolated from the same mice. To account for Foxp3-dependent gene expression we also analyzed the transcriptome of Treg “precursor” cells expressing a previously described Foxp3 GFP reporter null allele (Foxp3GFPKO)3. These GFP+ Foxp3GFPKO cells were isolated from heterozygous Foxp3GFPKO/WT females, which remained healthy due to the presence of competent Treg cells expressing the wild-type Foxp3 allele as the result of random X-chromosome inactivation. Foxp3GFPKO cells have received all signals required for Foxp3 expression during differentiation but lack Foxp3 protein. Transcriptome analysis revealed a number of genes differentially expressed in activated Teff and Treg cells in DT-treated Foxp3DTR mice as compared to their resting Treg and naïve CD4+ T cell counterparts in untreated control animals (Fig. 2a; Supplementary Table 2). At the same time, both resting Treg and activated Treg cells shared a set of transcriptional features distinct from those exhibited by both naive T and Teff cells. A comparison of these five cell subsets using principal component analysis (PCA) revealed that the transcriptome of activated Treg cells was roughly equidistant from those of resting Treg and activated effector T cells (Fig. 2b,c). In other words, activated Treg cells had comparable pair-wise degree of similarity to resting Treg and Teff gene expression programs, while resting Treg and Teff programs were further apart. Thus, the transcriptome of activated Treg cells had features of both resting Treg and Teff cell states. Importantly, activated Treg cells in DT-treated Foxp3DTR mice were representative of Treg cells activated under other inflammatory challenges. In this regard, comparison of gene expression changes in activated Treg versus Teff cells isolated from DT-treated Foxp3DTR mice and tumor-infiltrating Treg versus Teff cells sorted from established B16 melanoma tumors revealed a strong correlation (Supplementary Fig. 1e). These results suggest that activated Treg cells in DT-treated Foxp3DTR mice are not principally different from activated Treg cells in other biological settings.
Figure 2.
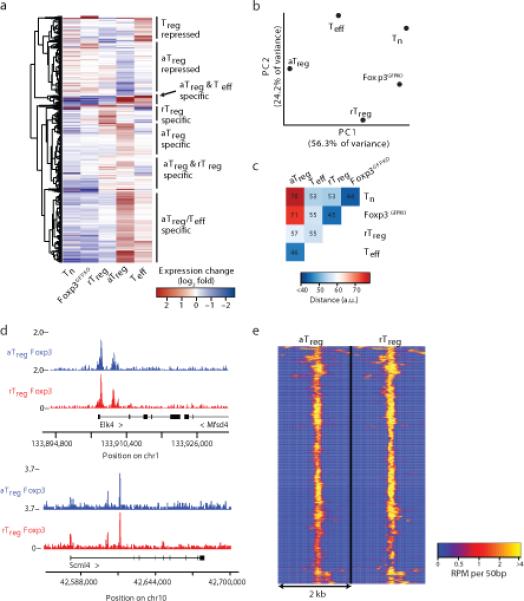
Characterization of in vivo activated Treg cell gene expression and Foxp3 chromatin localization. (a) Transcriptional profiling using Affymetrix Mouse Genome 430 2.0 arrays showed distinct gene expression clusters in aTreg, rTreg, Foxp3GFPKO (GFP+ CD4+ T cells from Foxp3GFPKO/WT mice), Teff, and Tn cells. Genes (rows) are significantly differentially expressed in aTreg cells compared to rTreg or Teff cells and hierarchically clustered based on Euclidean distance. Expression arrays were analyzed for DT treated Foxp3DTR mice (5 biological replicates), untreated Foxp3DTR mice (3 biological replicates), and Foxp3GFPKO/WT mice (3 biological replicates). (b) Principal component analysis of transcriptomes of aTreg, rTreg, Teff, Tn, and Foxp3GFPKO cells. The first and second principle components (PCs) are shown. (c) Pairwise Euclidean distance quantification of the similarity between gene expression profiles of indicated cell subsets shows similarity of activated cell types. (d) Foxp3 binds the Scml4 and Elk4 loci to a similar extent in aTreg and rTreg cells. The tracks show strand-extended read overlap in units of reads per million (RPM). (e) Genome-wide Foxp3 binding in Treg cells is similar in resting and activated states. The heatmap shows quantitative spatial binding patterns of Foxp3. The data represent an average of four Foxp3 ChIP-seq experiments for aTreg cells and two experiments for rTreg cells. Each row represents a separate binding site.
The finding that activated Treg cells had features of resting Treg and Teff cell populations raised the possibility that increased abundance of Foxp3 in activated Treg cells and cooperation with activation-induced nuclear factors enable the engagement of a unique set of enhancers that control activated Treg-specific gene expression10,17. Alternatively, Foxp3 could bind the same elements in resting and activated Treg cells, but perturb gene expression in the latter due to recruitment of activation-induced factors to the Foxp3 pre-bound sites under inflammatory conditions. To test these possibilities, we analyzed the genome-wide DNA binding sites of Foxp3 using chromatin immunoprecipitation combined with high throughput DNA sequencing (ChIP-seq) in both resting Treg and activated Treg cells (Supplementary Table 3). A comparison of these two Treg cell populations showed that nearly all identified loci were comparably occupied by Foxp3 (Fig. 2d,e). When replicates were examined independently and modeled using a negative binomial distribution18, we found no consistent differences in Foxp3 binding in resting Treg and activated Treg cells (Supplementary Fig. 2a-c). Thus, genome-wide Foxp3 ChIP-Seq analysis revealed that Foxp3 occupies the same sites in the absence of inflammation and under inflammatory conditions.
Foxp3 acts predominantly as a transcriptional repressor
To test the effect of Foxp3 binding on gene expression, we first examined the aggregate expression shift in Foxp3-bound genes in various cellular contexts. In agreement with previous reports, genes containing Foxp3 binding sites were enriched for transcripts both up- and downregulated in Foxp3+ resting Treg cells versus Foxp3– naïve T cells (Fig. 3a). These results appeared to imply that Foxp3 may facilitate activation and repression of its target genes9. However, analysis of Foxp3 target genes in activated Treg versus Teff cells suggested that Foxp3 acts predominantly as a negative regulator of transcription (Fig. 3b). Foxp3 binding intensity, as measured by read counts in ChIP-seq datasets, strongly and significantly correlated with decreased, but not increased, transcription (Supplementary Fig. 3a). It was possible that preferential downregulation of Foxp3-bound genes in activated Treg versus Teff cells was a direct result of Foxp3-mediated repression of corresponding target genes. Alternatively, Foxp3-bound genes, instead of being repressed in activated Treg cells, could have been upregulated in Teff cells as a result of a Foxp3-independent process, namely, Teff cell-specific expression of transcriptional activators with genome-wide DNA-binding patterns similar to those of Foxp3. To address these questions we examined Foxp3 target gene expression enrichment across multiple cell types, including Foxp3fl Treg cells subjected to Cre-mediated Foxp3 ablation (Fig. 3c), activated and resting Treg cells, and Foxp3GFPKO cells (Supplementary Fig. 3b). In all of these comparisons the only statistical association was with gene repression (Fig. 3d, Supplementary Fig. 3c). Repression was most pronounced when Foxp3-bound distal enhancers were located upstream or in the first intron (Supplementary Fig. 3d). Analysis of signaling pathways identified Akt response genes as repressed in a Foxp3-dependent manner (Supplementary Table 4).
Figure 3.
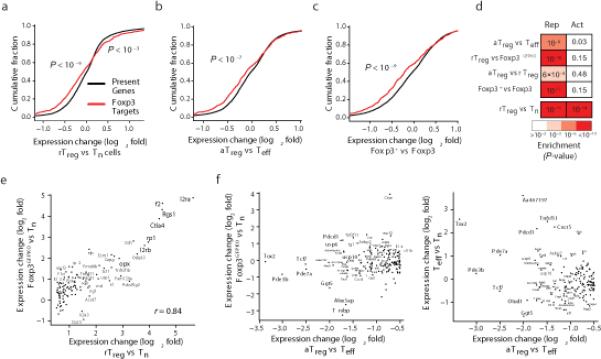
Foxp3 acts predominantly as a repressor. (a) Foxp3-bound genes are quantitatively differentially up- and downregulated in rTreg in comparison to Tn cells (p-values show one-tailed KS tests). (b, c) Foxp3-bound genes are significantly and quantitatively downregulated in aTreg vs. Teff cells (b) and Foxp3+ vs. Foxp3Δ cells (c). To generate Foxp3Δ cells, sorted Foxp3+ CD4+ T cells from Foxp3fl mice were activated in vitro and transduced with a Cre recombinase and reporter expressing retroviral vector; transduced cells were sorted using an Aria II FACS instrument5. (d) Foxp3-bound genes are exclusively enriched for downregulation across all cell-type comparisons and perturbations except for the rTreg vs. Tn comparison. The p-values shown reflect statistical significance of overlap between Foxp3-bound genes and genes up- or downregulated in the indicated cell types (hypergeometric test; see also Figure S3C). (e) Foxp3-bound genes upregulated in rTreg vs. Tn cells (x-axis) are also upregulated in a Foxp3-independent manner in Foxp3GFPKO cells (y-axis). Only significantly differentially expressed Foxp3 targets are shown (Benjamini-Hochberg corrected, q < 0.05). (f) Foxp3-bound genes that are downregulated in aTreg vs Teff cells (x-axis) require Foxp3 for their repression as they are not repressed in Foxp3GFPKO or Teff cells (y-axes). Only significantly differentially expressed Foxp3-bound genes are shown (Benjamini-Hochberg corrected, q < 0.05).
Since Foxp3 binds some Treg cell-specific genes, we wanted to understand if their high expression in Treg cells was dependent on Foxp3 or was merely a correlation. Foxp3-bound genes upregulated in resting Treg cells were in fact upregulated in a Foxp3-independent manner in GFP+ Foxp3GFPKO cells and expressed similarly to those in resting Treg cells, suggesting that these genes were targeted by trans-activating factors other than Foxp3 (Fig. 3e). This result was in contrast to Foxp3-bound genes downregulated in Treg cells, whose repression was Foxp3 dependent (Fig. 3f). Importantly, the majority of genes with decreased expression in activated Treg cells were not increased in Teff or Foxp3GFPKO T cells as compared to naïve T cells (Fig. 3f). Thus, the observed decreased expression in Foxp3-bound genes in activated Treg cells cannot be explained by their up-regulation in Teff or Treg precursor cells. These results were consistent with previous reports of Foxp3 acting as a repressor upon transient transfection with a forkhead-motif containing luciferase reporter in a heterologous cell line and other settings19–22. Thus, our analysis indicates that in both activated Treg cells and in their resting counterparts, Foxp3 acts primarily as a repressor of gene transcription.
Foxp3-bound chromatin is repressed in activated Treg cells
Despite the comparable genome-wide occupancy of regulatory sites by Foxp3, it remained possible that the effect of Foxp3 binding was different in activated vs. resting Treg cells. For example, activation- induced transcription factors could be recruited to Foxp3 pre-bound sites and cooperate with Foxp3 to regulate chromatin state. To further explore this possibility we determined whether the chromatin state of Foxp3-bound genes was similar or different in Treg cells in the presence or absence of inflammation. We employed genome-wide sequence analysis (DNase-seq) of DNase I hypersensitive sites (DHSs), which enabled a highly reliable assessment of accessibility and activity of DNA regulatory elements23. DNase-seq revealed ~85,000 DHSs with high accessibility in at least one of the cell types (Supplementary Table 5). In agreement with our recent analysis of the enhancer landscape in resting Treg cells, the majority of accessible sites in activated Treg cells were also accessible in Teff or naïve T cells, with the exception of a small set of activated Treg cell-specific DNA regulatory elements which was not significantly bound by Foxp3 (ref. 7). Also consistent with previous findings, Foxp3-bound enhancers had moderate enrichment in increased chromatin accessibility in resting Treg cells compared to naïve T cells, which is established in a Foxp3-independent fashion7.
To assess the impact of Foxp3 on chromatin accessibility under inflammatory conditions, we analyzed the changes in the DHS landscape of activated Treg and Teff cells. We identified a large number of Foxp3-bound sites that were less accessible in activated Treg cells in comparison to Teff cells (Fig. 4a). On average, Foxp3-bound sites exhibited decreased DNase accessibility (Fig. 4b, Supplementary Fig. 4a, P < 10−151, t-test). Moreover, the most repressed loci in activated Treg cells were enriched for Foxp3 binding (Fig. 4c, Supplementary Fig. 4b, P < 10−73, hypergeometric test). Consistent with the ability of Foxp3 to repress genes associated with T cell activation, Foxp3-bound loci were more accessible in Teff cells lacking Foxp3 in comparison to resting naive T cells (Fig. 4b). Interestingly, the chromatin accessibility at Foxp3-bound sites was decreased in activated compared to resting Treg cells (Fig. 4b, Supplementary Fig. 4c) suggesting that this major subset of Foxp3-bound enhancers was repressed only in activated, functionally engaged Treg cells. Supporting the functional relevance of these DNase hypersensitivity changes, transcripts of genes near Foxp3-bound loci with decreased accessibility were significantly downregulated in activated Treg versus resting Treg and Teff cells (Fig. 4d, Supplementary Fig. 4d). The observation that Foxp3-bound loci exhibit decreased accessibility in activated Treg versus Teff and activated Treg versus resting Treg cell populations argued against the possibility that decreased chromatin accessibility at Foxp3 bound sites in activated Treg cells was merely due to an overall increase in chromatin accessibility in Teff cells. These results support the functional relevance of Foxp3 binding at these loci. These results suggested that Foxp3 binding to a large number of functionally important enhancers in resting Treg cells “poised” them for repression, such that their chromatin accessibility and transcript levels were decreased upon activation of Treg cells in response to TCR and inflammatory cues.
Figure 4.
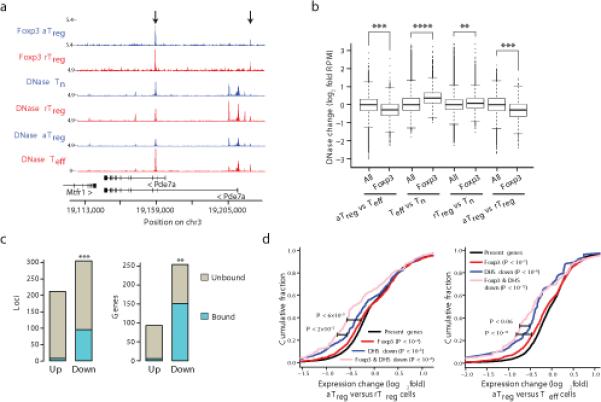
Foxp3 binds regulatory loci that are poised for repression in inflammatory environments. (a) DNase-seq and Foxp3 ChIP-seq reads mapped to Pde7a show decreased DNase-accessibility in aTreg cells. The highest quality dataset of two independent DNase-seq replicates is shown. (b) Regulatory loci bound by Foxp3 exhibit decreased accessibility in aTreg vs. Teff or rTreg cells, increased accessibility in Teff vs. Tn cells, and moderately increased accessibility in rTreg vs. Tn cells (p-values shown were derived using a standard t-test; p-values less than 10−20, 10−100, 10−200, are shown by **, ***, ****, respectively). DNase hypersensitive sites (DHSs) were identified as Foxp3-bound if 150bp DHS peaks overlapped with 150bp Foxp3 peaks. (c) Foxp3 binds a highly significant portion (in blue) of regulatory loci (left) and genes (right) with specifically decreased DNase accessibility in aTreg cells (y-axis). Hypergeometric overlap test p-value and odds ratio (OR) are shown; p-values less than 10−40, 10−70, are shown by **, ***, respectively). (d) Genes near Foxp3-bound loci with aTreg-specific decreased chromatin (DNase) accessibility (pink) are more downregulated in comparison to all Foxp3-bound genes (red) or all genes with aTreg-specific decrease in DNase accessibility (blue). The downregulation was observed in aTreg in comparison to both rTreg (left) and Teff (right) cell populations. KS test p-values in parenthesis are relative to all present genes (black) and p-values next to bars show significance of difference between respective gene sets.
PRC2 represses Foxp3-bound chromatin during inflammation
The decrease in chromatin accessibility suggested recruitment of chromatin modifiers upon activation of Treg cells in the inflammatory environment. As shown by mass-spectrometric analysis of Foxp3 partners in a bulk Treg cell population, which contains both resting and activated Treg cells, Foxp3 forms large protein complexes that include Suz12, an essential component of the polycomb repressive complex 2 (PRC2)24. The role of PRC2 in activated Treg cells was of particular interest since Ezh2, a critical component of PRC2, was significantly upregulated in activated Treg cells (Fig. 5a,b). Co-immunoprecipitation experiments showed that Ezh2 forms complexes with Foxp3 in activated Treg, but not in resting Treg cells (Fig. 5c). Since PRC2 deposits the facultative heterochromatin-associated H3K27me3 histone modification25, and is selectively associated with Foxp3 under inflammatory conditions, we explored the genome-wide distribution of H3K27me3 marks in activated Treg, resting Treg, Teff and naïve T cells using ChIP-seq analysis (Fig. 5d, Supplementary Table 6; see also Methods section). We found overall increases of H3K27me3 in response to inflammation in activated Treg as well as Teff cells compared to naïve T cells (Fig. 5e, Supplementary Fig. 5a). In remarkable concordance with the chromatin accessibility patterns revealed by DNase-seq, more than 60% of activated Treg-specific H3K27me3 marked chromatin was bound by Foxp3 (Fig. 5e,f); these loci frequently contained multiple Foxp3 binding sites (Supplementary Fig. 5b). Consistent with its repressive function, deposition of H3K27me3 at Foxp3-bound sites in activated Treg cells strongly correlated with decreased gene expression (Supplementary Fig. 5c). Importantly, the Foxp3-bound sites in activated Treg cells were specifically enriched for H3K27me3, whereas the Teff H3K27me3 landscape was randomly distributed (Fig. 5g). These observations strongly argue against the possibility that chromatin de-condensation by transcriptional activators present in Teff cells accounts for the observed activated Treg-specific H3K27me3 enrichment. In contrast to the observed widespread increase in H3K27me3 at Foxp3-bound sites under inflammatory conditions, Pde3b was the only Foxp3-bound gene significantly enriched for H3K27me3 modifications in resting Treg cells (Fig. 5h, Supplementary Fig. 5d,e).
Figure 5.
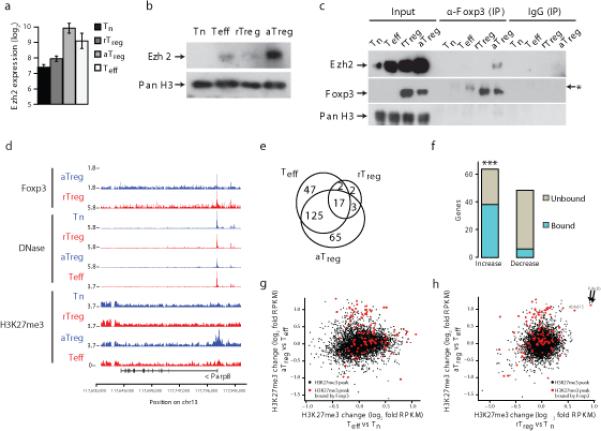
Foxp3 interacts with Ezh2 and binds loci enriched for H3K27me3 marks in aTreg cells. (a) Increased Ezh2 mRNA in aTreg cells, as measured by gene expression microarray analysis. Error bars indicate standard deviation. Array analysis was performed using cells isolated from DT treated Foxp3DTR mice (n=5), untreated Foxp3DTR mice (n=3), and Foxp3GFPKO/WT mice (n=3). (b) Ezh2 protein is upregulated in aTreg cells, as assessed by Ezh2 immunoblot analysis of lysates from indicated cell subsets. Histone H3 served as a loading control. Results are representative of two experiments. (c) Foxp3 physically interacts with Ezh2 in activated Treg cells. Foxp3 complexes were immunoprecipitated with Foxp3 antibody and probed with Ezh2 or Foxp3 specific antibodies. Lysate from aTreg cells was diluted to adjust for an increase in Foxp3 and Ezh2 protein expression in aTreg cells (as shown in Figs. 1c,5b), resulting in lower amounts of Foxp3 protein loaded in the “aTreg” lane compared to the “rTreg” lane. Histone H3 served as a loading control. A non-specific band is marked by a “*”. Results are representative of n=2 experiments. (d) The Parp8 gene locus is bound by Foxp3 and has decreased DNase-accessibility and increased H3K27me3 in aTreg cells. H3K27me3 ChIP-seq data are representative of two independent experiments. (e) The Venn diagram shows number of genes with increases in H3K27me3 relative to Tn cells. (f) Genes with aTreg-specific increases in H3K27me3-bound chromatin are highly enriched for Foxp3 binding, in contrast to genes with aTreg-specific decreases in H3K27me3-bound chromatin (hypergeometric test p-value shown, ** indicates p < 10−24). (g) aTreg cell-specific H3K27me3 sites (y-axis) are distinct from activation induced H3K27me3 sites in Teff cells (x-axis). (h). Pde3b is the only Foxp3-bound gene enriched for H3K27me3 marks in both aTreg (y-axis) and rTreg cells (x-axis). All other Foxp3-bound loci exhibit increased H3K27 marks only in aTreg cells.
Given the strong correlation between Foxp3 binding and activated Treg-specific H3K27me3 deposition, we considered the possibility that Foxp3 may be required to recruit PRC2. We tested if H3K27me3 deposition was Foxp3 dependent by performing H3K27me3 ChIP-seq using resting and activated Foxp3GFPKO cells lacking Foxp3 protein that were isolated from healthy heterozygous Foxp3GFPKO/WT females and hemizygous Foxp3GFPKO males suffering from immune mediated inflammatory syndrome (Fig. 6a, Supplementary Fig. 6a). Resting Foxp3GFPKO and resting Treg cells exhibited similar H3K27me3 landscape with the exception of H3K27me3 enrichment at the Pde3b locus in resting Treg versus Foxp3GFPKO cells, indicating its dependence on Foxp3 (Supplementary Fig. 6b,c). Activated Foxp3GFPKO cells shared inflammation-associated increases in H3K27 tri-methylation with Teff and activated Treg cells at sites not bound by Foxp3 (Supplementary Fig. 6d). In contrast, at Foxp3-bound sites Foxp3 was required for deposition of H3K27me3 marks in activated Treg cells as evidenced by paucity of these marks at corresponding sites in activated Foxp3GFPKO or Teff cells lacking Foxp3 protein (Fig. 6b). Based on quantitative assessment, we found that >75% of the Foxp3 binding loci were equally repressed in both activated Treg versus activated Foxp3GFPKO and activated Treg versus Teff comparisons (Fig. 6c). Thus, polycomb-mediated silencing of these sites was completely dependent on Foxp3. The remaining 25% of loci that were identified as repressed in activated Treg versus Teff cells were partially Foxp3-dependent, but were also marginally repressed in a Foxp3-independent fashion in Foxp3GFPKO cells. Importantly, Foxp3 binding was not associated with H3K27 demethylation, since all Treg lineage decreases in H3K27me3 were also observed in Foxp3GFPKO cells (Fig. 6d, Supplementary Fig. 6e). This finding further supports the role of Foxp3 as a repressor and as a primary determinant of H3K27 tri-methylation in activated Treg cells.
Figure 6.
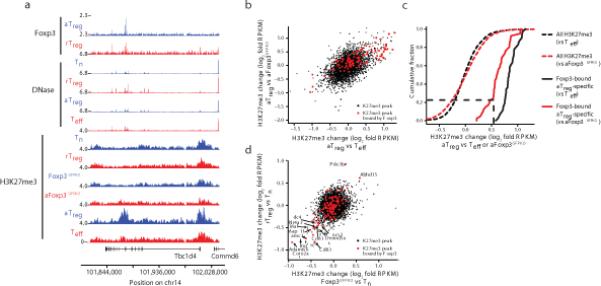
Formation of H3K27me3 marked chromatin at Foxp3-bound loci in activated Treg cells is dependent on Foxp3 protein expression. (a) The Tbc1d4 gene exemplifies the requirement for Foxp3 protein expression for H3K27 tri-methylation at Foxp3-bound sites in aTreg cells. H3K27me3 ChIP-seq data are representative of two independent replicates. (b) Foxp3 is required to increase H3K27me3 in aTreg cells in comparison to activated Foxp3GFPKO (aFoxp3GFPKO) cells. Increases in H3K27me3 in aTreg cells were similar when compared to either Teff or aFoxp3GFPKO cells. (c) Quantification of H3K27me3 at Foxp3-bound and -unbound loci in aTreg cells compared to Teff or activated Foxp3GFPKO cells. (d) Loss of H3K27me3 is independent of Foxp3. Comparison of H3K27me3 changes in rTreg vs. resting Foxp3GFPKO (x-axis) or Tn (y-axis) cells shows that decreases in H3K27me3 occur prior to expression of Foxp3 protein. RPKM: reads per kilobase per million mapped reads.
DISCUSSION
We have analyzed Foxp3 mediated regulation of gene expression and chromatin state in activated Treg cells engaged in suppression of inflammatory responses. The key distinguishing feature of our study is that we compared activated polyclonal effector and regulatory T cell populations exposed to TCR and cytokine signaling in vivo in contrast to previous analyses of resting Treg cells and naïve CD4+ T cells. The latter studies were confounded by potential selective impact of these signaling pathways on the chromatin landscape and transcriptional output of resting Treg cells in comparison to naïve T cells6,7,26. We found that Foxp3 acted predominantly as a transcriptional repressor and was required for establishment of H3K27me3 marked repressive chromatin in activated regulatory T cells.
Since deposition of H3K27me3 at a locus is mediated exclusively by PRC2 (ref. 27) and reflects a history of PRC2 recruitment, Foxp3 interaction with the PRC2 member Ezh2 exclusively in activated Treg cells, but not in their resting counterparts suggest that Foxp3 recruits the PRC2 complex to target genes and forms repressive chromatin under inflammatory conditions. It is possible that the increased expression of Foxp3 and Ezh2 under inflammatory conditions is sufficient to drive their interaction in activated Treg cells. Alternatively, activation-induced post-translational modifications of Foxp3 or Ezh2 or other PRC2 components could play a role in PRC2 recruitment. For example, Ezh2 can be phosphorylated at multiple residues by a variety of kinases activated under inflammatory conditions, including Akt, p38 MAPK, and cyclin-dependent kinases (CDK) 1 and 2. These modifications control interactions of Ezh2 with other PRC2 protein components, transcription factors, and non-coding RNAs and regulate recruitment of Ezh2 to specific target genes28–33. These putative mechanisms could also affect the specificity of Ezh2 targeting and may help explain why only a subset of Foxp3-bound sites is subject to inflammation-induced repression.
A biological role for the cooperative Foxp3- and PRC2-mediated gene repression remains unknown because its elucidation would require selective disruption of Foxp3-PRC2 interactions in activated Treg cells. Genetic ablation or knockdown of Ezh2 in Treg cells would seem an inadequate approach as loss of Ezh2 would affect many genes and result in a severe impairment of cellular function. In CD4+ T cells, Ezh2 deficiency results in impaired activation-induced proliferation34 and aberrant TH1 and TH2 differentiation35. Accordingly, chimeric mice in which all Treg cells lack Ezh2 develop fatal inflammation associated with massive T cell activation and cytokine production (S. Hemmers, Y.F., A.A. and A.Y.R., unpublished observations). However, it is unclear whether the observed loss of fitness and suppressor function by Ezh2-deficient Treg cells was due to Ezh2 requirement for Foxp3-dependent or -independent regulation of gene expression.
A number of the genes featuring enhancers repressed by Foxp3 in activated Treg cells encode components of signaling cascades operating in effector T cells. Downregulation of these genes may modulate the outcome of TCR and cytokine receptor signaling and enable Treg cell suppressive capability. For instance, strong Akt signaling impedes Treg cell generation and function36,37; under inflammatory conditions, many Akt response genes were repressed in activated Treg cells in a Foxp3-dependent manner. Thus, a major role of Foxp3 may be to uncouple activation-induced signal transduction pathways from the effector T cell gene expression program without interfering with activation-induced proliferation, elaboration of inhibitory molecules, and homing capabilities.
Our finding that Foxp3 binds enhancers that are “poised for repression” under inflammatory conditions complements previous studies that have described enhancers “poised for activation” in development and response to environmental cues38–41. Previous work has shown that lipopolysaccharide stimulation of terminally differentiated macrophages elicits activation of latent enhancers through recruitment of stimulus-activated transcription factors, which maintain increased sensitivity to subsequent stimulation42,43. Similarly, a subset of human embryonic stem cell enhancers is poised for activation during differentiation44,45. The inducible repression enhancer dynamic we describe may be employed by a number of other factors that establish DNA-interactions during cell lineage development and subsequently interact with polycomb in response to environmental cues.
ON-LINE METHODS
In vivo activation and cell isolation
Mice were bred and housed in the pathogen-free animal facility at Memorial Sloan-Kettering Cancer Center and used in accordance with institutional guidelines. The Foxp3GFPKO and Foxp3DTR mice were previously described3,16. All cells were sorted from spleens and lymph nodes. Tn (GFP–) and rTreg (GFP+) cells were taken from Foxp3DTR mice. Resting Foxp3GFPKO and activated Foxp3GFPKO cells were GFP+ cells sorted from Foxp3GFPKO/WT female and Foxp3GFPKO male mice, respectively. The aTreg and Teff cell populations were sorted from mice 10 days after day 0 and day 1 intraperitoneal injection of diphtheria toxin (DT) (Sigma). All cell populations were isolated by CD4 Dynabeads positive selection (Invitrogen) and then sorted using an Aria2 flow cytometer (BD Biosciences).
Gene expression profiling
High purity cell populations were sorted for two consecutive rounds to attain >99% purity, RNA was Trizol extracted, and cDNA libraries were hybridized to Affymetrix MOE 430 2.0 chips. Arrays were RMA normalized and genes identified as present in at least one cell population were used in subsequent analyses. Differential expression was estimated using the Bioconductor limma package with a q-value cutoff of 0.05 after Benjamini-Hochberg adjustment. Present genes were defined to be genes with above-threshold expression in any cell population.
Processing of raw sequencing data
Reads were aligned to the UCSC mm9 genome using Bowtie allowing for 2 mismatches in a 36nt seed region and uniquely aligning reads were analyzed. To remove monoclonal reads from ChIP experiments, reads with identical start position were compressed to single reads.
Genome-wide profiling of chromatin accessibility
Cells were assayed for chromatin accessibility using DNase-seq as described previously7,23. Peaks were called using the HotSpot algorithm and the union of the top 100K peaks for each cell type was taken. We analyzed DNase-sensitive sites that had at least 0.5RPM in the cell in which it was most accessible, resulting in ~87K peaks.
Differential DNase-accessibility was performed using both quantitative and qualitative approaches, similar to the analysis strategy for association of Foxp3 binding with repressed genes. For the quantitative analysis, we performed KS- and t-tests for change in accessibility of Foxp3-bound DHSs vs. genome-wide DHSs (Fig. 4c,d). Since Foxp3 tends to bind only to moderately to highly accessible chromatin, it was critical to demonstrate that change in Foxp3-bound DHSs was uniform across the entire range of absolute chromatin accessibility (Supplementary Fig. 4). To assess uniform fold-change differences, “MvA” corrected differences in log reads per million were computed and a running fold-change average is shown with respect to absolute accessibility estimated by DNase-seq RPM (Supplementary Fig. 4). We next assessed the enrichment of Foxp3 with qualitatively differentially accessible loci. To identify these loci, we used an intensity-specific variance model to estimate significance of differential expression at each DHS, as previously described46. The hypergeometric test for overlap was used to determine significance of overlap.
Genome-wide analysis of Foxp3 binding sites and H3K27 tri-methylation
Foxp3 ChIP-seq was performed as previously described7. H3K27me3 ChIP-seq was performed using a similar protocol as for Foxp3 ChIP. 1 × 10⁶ cross-linked cells were lysed and mono- and poly-nucleosomes were obtained by partial digestion of the chromatin with micrococcal nuclease (12,000 units/ml) in 100 μl for 1 min at 37 °C. Digestion was stopped with 10 μl 0.5 M EDTA and digested nuclei were resuspended in 250 μl nuclear lysis buffer with 1% SDS. After sonication H3K27me3-bound chromatin was precipitated using H3K27me3-specific antibody (Upstate 07-449). DNA isolation after de-crosslinking was performed as described7.
Foxp3 binding sites were called using SPP47 and quantified by the number of reads that aligned to a 200 bp window around peak center after a strand-specific 75-nt shift. Peaks with high input-control signal (Input RPM > 0.5) and those not enriched relative to input (P < 0.001; Poisson using a 200 bp region for comparison of ChIP to input) were excluded from subsequent analysis. Peaks were assigned to genes by proximity to gene body. Association with gene expression was correlated with peak rank to determine roughly ~1300 highly functionally enriched binding sites out of a total ~2800 binding sites7 (Supplementary Fig. 3). Difference in Foxp3 target genes was estimated using a two-sample Kolmogorov-Smirnov test (where cumulative distributions are shown) and hypergeometric overlap with discrete sets of significantly differentially expressed genes.
To analyze H3K27me3 binding sites, reads were aggregated into broad peaks by identifying 5 kb loci with greater than 12 RPM and significantly higher read count than input (using same metrics as for Foxp3 normalized to size). Peaks were merged if they were within 10 kb and had contiguous blocks with >8 RPM. This process resulted in ~5k peaks overlapping 4300 genes that were reproducible and significantly enriched above input (Supplementary Fig. 7). Subsequent quantitative analysis of these broad H3K27me3 peaks used reads per 1 kb per million (RPKM) since peaks were of variable size. Using lower thresholds for H3K27me3 peaks resulted in peaks that became increasingly correlated with input signal; a subset of control and differentially tri-methylated peaks were validated by ChIP-qPCR (Supplementary Fig. 7). Overlap enrichment statistics for Foxp3 and H3K27me3 were the same as used for DNase-seq.
Co-immunoprecipitation and immunoblot analysis
Co-immunoprecipitation was performed using nuclear complex co-IP kit (Active Motif), according to manufacturer's instructions. 5 × 10⁶ cells were washed with PBS containing phosphatase inhibitors and lysed in hypotonic buffer. Nuclei were isolated by centrifugation and digested using enzymatic shearing cocktail. Digested nuclear lysate was incubated with polyclonal affinity purified rabbit Foxp3 antibody9 overnight at 4 °C. Foxp3 immune-complexes were captured by addition of protein-A conjugated magnetic beads, thoroughly washed, and resuspended in Laemmli sample buffer for SDS-PAGE fractionation and immunoblot analysis. The following antibodies were used for immunoblotting: anti-EZH2 (BD Biosciences Cat# 612666), anti-Foxp3 (clone FJK-16s, eBioscience Cat# 14-57773-82) and anti-histone H3 (Abcam ab1791).
Supplementary Material
ACKNOWLEDGEMENTS
We would like to thank G. Loeb, S. Josefowicz, and S. Hemmers for helpful discussions. This work was supported by the Cancer Research Institute (CRI) predoctoral fellowship (J.v.d.V), NIH DK091968 grant, MSTP grant GM07739 (both R.M.S), NIH 5R37AI034206 grant (A.Y.R.) and Ludwig Cancer Center at Memorial Sloan-Kettering Cancer Center (A.Y.R.). A.Y.R. is an investigator with the Howard Hughes Medical Institute.
Footnotes
AUTHOR CONTRIBUTIONS
A.Y.R. conceived and designed the study with A.A., J.v.d.V. and R.M.S; J.v.d.V., R.M.S., A.A., and Y.F. conducted experiments; A.A. performed computational and statistical analysis of the data; J.A.S. designed DNase-seq experiments; A.A., J.v.d.V., R.M.S., and A.Y.R. wrote the manuscript.
COMPETING FINANCIAL INTERESTS
The authors declare no competing financial interests
Accession code:
ChIP-seq and array data have been deposited to GEO with accession number GSE55753.
References
- 1.Ohkura N, Kitagawa Y, Sakaguchi S. Development and maintenance of regulatory T cells. Immunity. 2013;38:414–423. doi: 10.1016/j.immuni.2013.03.002. [DOI] [PubMed] [Google Scholar]
- 2.Josefowicz S, Lu L-F, Rudensky AY. Regulatory T cells: mechanisms of differentiation and function. Annu. Rev. Immunol. 2012;30:531–564. doi: 10.1146/annurev.immunol.25.022106.141623. [DOI] [PMC free article] [PubMed] [Google Scholar]
- 3.Gavin MA, et al. Foxp3-dependent programme of regulatory T-cell differentiation. Nature. 2007;445:771–775. doi: 10.1038/nature05543. [DOI] [PubMed] [Google Scholar]
- 4.Lin W, et al. Regulatory T cell development in the absence of functional Foxp3. Nat. Immunol. 2007;8:359–368. doi: 10.1038/ni1445. [DOI] [PubMed] [Google Scholar]
- 5.Williams LM, Rudensky AY. Maintenance of the Foxp3-dependent developmental program in mature regulatory T cells requires continued expression of Foxp3. Nat. Immunol. 2007;8:277–284. doi: 10.1038/ni1437. [DOI] [PubMed] [Google Scholar]
- 6.Ohkura N, et al. T cell receptor stimulation-induced epigenetic changes and foxp3 expression are independent and complementary events required for treg cell development. Immunity. 2012;37:785–799. doi: 10.1016/j.immuni.2012.09.010. [DOI] [PubMed] [Google Scholar]
- 7.Samstein RM, et al. Foxp3 exploits a pre-existent enhancer landscape for regulatory T cell lineage specification. Cell. 2012;151:153–166. doi: 10.1016/j.cell.2012.06.053. [DOI] [PMC free article] [PubMed] [Google Scholar]
- 8.Chen C, Rowell EA, Thomas RM, Hancock WW, Wells AD. Transcriptional regulation by Foxp3 is associated with direct promoter occupancy and modulation of histone acetylation. J. Biol. Chem. 2006;281:36828–36834. doi: 10.1074/jbc.M608848200. [DOI] [PubMed] [Google Scholar]
- 9.Zheng Y, et al. Genome-wide analysis of Foxp3 target genes in developing and mature regulatory T cells. Nature. 2007;445:936–940. doi: 10.1038/nature05563. [DOI] [PubMed] [Google Scholar]
- 10.Marson A, et al. Foxp3 occupancy and regulation of key target genes during T-cell stimulation. Nature. 2007;445:931–935. doi: 10.1038/nature05478. [DOI] [PMC free article] [PubMed] [Google Scholar]
- 11.Ono M, et al. Foxp3 controls regulatory T-cell function by interacting with AML1/Runx1. Nature. 2007;446:685–689. doi: 10.1038/nature05673. [DOI] [PubMed] [Google Scholar]
- 12.Katoh H, et al. FOXP3 orchestrates H4K16 acetylation and H3K4 trimethylation for activation of multiple genes by recruiting MOF and causing displacement of PLU-1. Mol. Cell. 2011;44:770–784. doi: 10.1016/j.molcel.2011.10.012. [DOI] [PMC free article] [PubMed] [Google Scholar]
- 13.Camperio C, et al. Forkhead transcription factor FOXP3 upregulates CD25 expression through cooperation with RelA/NF-κB. PLoS One. 2012;7(10):e48303. doi: 10.1371/journal.pone.0048303. [DOI] [PMC free article] [PubMed] [Google Scholar]
- 14.Fu W, et al. A multiply redundant genetic switch ‘locks in’ the transcriptional signature of regulatory T cells. Nat. Immunol. 2012;13:972–980. doi: 10.1038/ni.2420. [DOI] [PMC free article] [PubMed] [Google Scholar]
- 15.Hossain DM, et al. FoxP3 Acts as a Cotranscription Factor with STAT3 in Tumor-Induced Regulatory T Cells. Immunity. 2013;39:1057–1069. doi: 10.1016/j.immuni.2013.11.005. [DOI] [PubMed] [Google Scholar]
- 16.Kim JM, Rasmussen JP, Rudensky AY. Regulatory T cells prevent catastrophic autoimmunity throughout the lifespan of mice. Nat. Immunol. 2007;8:191–197. doi: 10.1038/ni1428. [DOI] [PubMed] [Google Scholar]
- 17.Wu Y, et al. FOXP3 Controls Regulatory T Cell Function through Cooperation with NFAT. Cell. 2006;126:375–387. doi: 10.1016/j.cell.2006.05.042. [DOI] [PubMed] [Google Scholar]
- 18.Robinson MD, Smyth G,K. Moderated statistical tests for assessing differences in tag abundance. Bioinformatics. 2007;23:2881–2887. doi: 10.1093/bioinformatics/btm453. [DOI] [PubMed] [Google Scholar]
- 19.Schubert LA, Jeffery E, Zhang Y, Ramsdell F, Ziegler SF. Scurfin (FOXP3) acts as a repressor of transcription and regulates T cell activation. J. Biol. Chem. 2001;276:37672–37679. doi: 10.1074/jbc.M104521200. [DOI] [PubMed] [Google Scholar]
- 20.Beyer M, et al. Repression of the genome organizer SATB1 in regulatory T cells is required for suppressive function and inhibition of effector differentiation. Nat. Immunol. 2011;12:898–907. doi: 10.1038/ni.2084. [DOI] [PMC free article] [PubMed] [Google Scholar]
- 21.Tai X, et al. Foxp3 Transcription Factor Is Proapoptotic and Lethal to Developing Regulatory T Cells unless Counterbalanced by Cytokine Survival Signals. Immunity. 2013;38:1116–1128. doi: 10.1016/j.immuni.2013.02.022. [DOI] [PMC free article] [PubMed] [Google Scholar]
- 22.Haribhai D, et al. A Central Role for Induced Regulatory T Cells in Tolerance Induction in Experimental Colitis. J. Immunol. 2009;182:3461–3468. doi: 10.4049/jimmunol.0802535. [DOI] [PMC free article] [PubMed] [Google Scholar]
- 23.Thurman RE, et al. The accessible chromatin landscape of the human genome. Nature. 2012;489:75–82. doi: 10.1038/nature11232. [DOI] [PMC free article] [PubMed] [Google Scholar]
- 24.Rudra D, et al. Transcription factor Foxp3 and its protein partners form a complex regulatory network. Nat. Immunol. 2012;13:1010–1019. doi: 10.1038/ni.2402. [DOI] [PMC free article] [PubMed] [Google Scholar]
- 25.Cao R, et al. Role of histone H3 lysine 27 methylation in Polycomb-group silencing. Science. 2002;298:1039–1043. doi: 10.1126/science.1076997. [DOI] [PubMed] [Google Scholar]
- 26.Hill J, et al. Foxp3 transcription-factor-dependent and -independent regulation of the regulatory T cell transcriptional signature. Immunity. 2007;27:786–800. doi: 10.1016/j.immuni.2007.09.010. [DOI] [PubMed] [Google Scholar]
- 27.Margueron R, Reinberg D. The Polycomb complex PRC2 and its mark in life. Nature. 2011;469:343–349. doi: 10.1038/nature09784. [DOI] [PMC free article] [PubMed] [Google Scholar]
- 28.Cha TL, et al. Akt-mediated phosphorylation of EZH2 suppresses methylation of lysine 27 in histone H3. Science. 2005;310:306–310. doi: 10.1126/science.1118947. [DOI] [PubMed] [Google Scholar]
- 29.Palacios D, et al. TNF/p38α/polycomb signaling to Pax7 locus in satellite cells links inflammation to the epigenetic control of muscle regeneration. Cell Stem Cell. 2010;7:455–469. doi: 10.1016/j.stem.2010.08.013. [DOI] [PMC free article] [PubMed] [Google Scholar]
- 30.Wu SC, Zhang Y. Cyclin-dependent kinase 1 (CDK1)-mediated phosphorylation of enhancer of zeste 2 (EZH2) regulates its stability. J. Biol. Chem. 2011;286:28511–28519. doi: 10.1074/jbc.M111.240515. [DOI] [PMC free article] [PubMed] [Google Scholar]
- 31.Chen S, et al. Cyclin-dependent kinases regulate epigenetic gene silencing through phosphorylation of EZH2. Nat.Cell Biol. 2010;12:1108–1114. doi: 10.1038/ncb2116. [DOI] [PMC free article] [PubMed] [Google Scholar]
- 32.Kaneko S, et al. Phosphorylation of the PRC2 component EZH2 is cell cycle-regulated and up-regulates its binding to ncRNA. Genes Dev. 2010;24:2615–2620. doi: 10.1101/gad.1983810. [DOI] [PMC free article] [PubMed] [Google Scholar]
- 33.Wei Y, et al. CDK1-dependent phosphorylation of EZH2 suppresses methylation of H3K27 and promotes osteogenic differentiation of human mesenchymal stem cells. Nat. Cell Biol. 2011;13:87–94. doi: 10.1038/ncb2139. [DOI] [PMC free article] [PubMed] [Google Scholar]
- 34.Su IH, et al. Polycomb group protein EZH2 controls actin polymerization and cell signaling. Cell. 2005;121:425–436. doi: 10.1016/j.cell.2005.02.029. [DOI] [PubMed] [Google Scholar]
- 35.Tumes DJ, et al. The polycomb protein EZH2 regulates differentiation and plasticity of CD4(+) T helper type 1 and type 2 cells. Immunity. 2013;39:819–832. doi: 10.1016/j.immuni.2013.09.012. [DOI] [PubMed] [Google Scholar]
- 36.Haxhinasto S, Mathis D, Benoist C. The AKT-mTOR axis regulates de novo differentiation of CD4+Foxp3+ cells. J. Exp. Med. 2008;205:565–574. doi: 10.1084/jem.20071477. [DOI] [PMC free article] [PubMed] [Google Scholar]
- 37.Sauer S, et al. T cell receptor signaling controls Foxp3 expression via PI3K, Akt, and mTOR. Proc. Natl. Acad. Sci. USA. 2008;105:7797–7802. doi: 10.1073/pnas.0800928105. [DOI] [PMC free article] [PubMed] [Google Scholar]
- 38.Creyghton M, et al. Histone H3K27ac separates active from poised enhancers and predicts developmental state. Proc. Natl. Acad. Sci. USA. 2010;107:21931–21936. doi: 10.1073/pnas.1016071107. [DOI] [PMC free article] [PubMed] [Google Scholar]
- 39.Bernstein BE, et al. A bivalent chromatin structure marks key developmental genes in embryonic stem cells. Cell. 2006;125:315–326. doi: 10.1016/j.cell.2006.02.041. [DOI] [PubMed] [Google Scholar]
- 40.Zhu J, et al. Genome-wide chromatin state transitions associated with developmental and environmental cues. Cell. 2013;152:642–654. doi: 10.1016/j.cell.2012.12.033. [DOI] [PMC free article] [PubMed] [Google Scholar]
- 41.Vahedi G, et al. STATs shape the active enhancer landscape of T cell populations. Cell. 2012;151:981–993. doi: 10.1016/j.cell.2012.09.044. [DOI] [PMC free article] [PubMed] [Google Scholar]
- 42.Ghisletti S, et al. Identification and Characterization of Enhancers Controlling the Inflammatory Gene Expression Program in Macrophages. Immunity. 2010;32:317–328. doi: 10.1016/j.immuni.2010.02.008. [DOI] [PubMed] [Google Scholar]
- 43.Ostuni R, et al. Latent Enhancers Activated by Stimulation in Differentiated Cells. Cell. 2013;152:157–171. doi: 10.1016/j.cell.2012.12.018. [DOI] [PubMed] [Google Scholar]
- 44.Rada-Iglesias A, et al. A unique chromatin signature uncovers early developmental enhancers in humans. Nature. 2011;470:279–283. doi: 10.1038/nature09692. [DOI] [PMC free article] [PubMed] [Google Scholar]
- 45.Lin C, Garruss A, Luo Z, Guo F, Shilatifard A. The RNA Pol II elongation factor Ell3 marks enhancers in ES cells and primes future gene activation. Cell. 2013;152:144–156. doi: 10.1016/j.cell.2012.12.015. [DOI] [PMC free article] [PubMed] [Google Scholar]
- 46.Arvey A, Agius P, Noble WS, Leslie C. Sequence and chromatin determinants of cell-type-specific transcription factor binding. Genome Res. 2012;22:1723–1734. doi: 10.1101/gr.127712.111. [DOI] [PMC free article] [PubMed] [Google Scholar]
- 47.Kharchenko PV, Tolstorukov MY, Park P. J. Design and analysis of ChIP-seq experiments for DNA-binding proteins. Nat. Biotechnol. 2008;26:1351–1359. doi: 10.1038/nbt.1508. [DOI] [PMC free article] [PubMed] [Google Scholar]
Associated Data
This section collects any data citations, data availability statements, or supplementary materials included in this article.