

Abstract
Accurate assessment of a woman’s risk to develop specific subtypes of breast cancer is critical for appropriate utilization of chemopreventative measures, such as with tamoxifen in preventing estrogen-receptor positive breast cancer. In this context, we investigate quantitative measures of breast density and parenchymal texture, measures of glandular tissue content and tissue structure, as risk factors for estrogen-receptor positive (ER+) breast cancer. Mediolateral oblique (MLO) view digital mammograms of the contralateral breast from 106 women with unilateral invasive breast cancer were retrospectively analyzed. Breast density and parenchymal texture were analyzed via fully-automated software. Logistic regression with feature selection and was performed to predict ER+ versus ER− cancer status. A combined model considering all imaging measures extracted was compared to baseline models consisting of density-alone and texture-alone features. Area under the curve (AUC) of the receiver operating characteristic (ROC) and Delong’s test were used to compare the models’ discriminatory capacity for receptor status. The density-alone model had a discriminatory capacity of 0.62 AUC (p=0.05). The texture-alone model had a higher discriminatory capacity of 0.70 AUC (p=0.001), which was not significantly different compared to the density-alone model (p=0.37). In contrast the combined density-texture logistic regression model had a discriminatory capacity of 0.82 AUC (p<0.001), which was statistically significantly higher than both the density-alone (p<0.001) and texture-alone regression models (p=0.04). The combination of breast density and texture measures may have the potential to identify women specifically at risk for estrogen-receptor positive breast cancer and could be useful in triaging women into appropriate risk-reduction strategies.
Keywords: Digital Mammography, Breast Percent Density (PD%), Parenchymal Texture, Breast Cancer Risk, Receptor
1. INTRODUCTION
The personalization of breast cancer screening recommendations based on an individual woman’s risk for breast cancer is becoming increasingly important for clinical practice and patient care1, 2. The National Cancer Institute’s (NCI’s) risk assessment tool, often referred to as the Gail model3, is one of the most commonly utilized breast cancer risk assessment tools and has been used to establish guidelines for offering customized breast cancer screening recommendations for women at an elevated risk of developing breast cancer4. For example, the American Cancer Society (ACS) recommends that women with more than 20%–25% lifetime risk of breast cancer also be screened with breast magnetic resonance imaging, which has been shown to detect mammographically occult breast cancers with higher sensitivity than with screening mammography5. Furthermore, such models have also been utilized in preventive, risk-reduction strategies for woman at risk of developing specific sub-types of breast cancer, such as an estrogen-receptor positive (ER+) breast cancer6. As a result, tamoxifen, a selective estrogen receptor modulator (SERM) chemoprevention agent shown to reduce the risk of breast cancer by up to 48%7, has been recommended for use in women with more than 1.67% 5-year Gail risk6. However, while well calibrated at the general-population level, the Gail model has been shown to only have a modest discriminatory accuracy at the individual level8, therefore being limited for individualized clinical decision making. As such, it is estimated that of the 10 million US women eligible for SERM chemoprevention only about 25% would actually benefit9, exposing a considerable fraction of the population to substantial side effects.
Previous studies have identified several image-derived biomarkers associated with a woman’s individual risk of developing breast cancer. Specifically, breast percent density (PD%), the relative amount of mammographically-opaque fibroglandular tissue, has been consistently shown to be a strong risk factor for breast cancer10. In addition, parenchymal texture descriptors which describe localized properties of the parenchymal tissue patterns as seen mammographically have also been shown to be associated with breast cancer, and may contain complementary information about cancer risk (Figure 1)11. However, while most studies have focused on the relationship between breast density and texture and a woman’s overall risk for developing cancer, few have investigated the discriminatory capacity of these features in determining a woman’s risk for developing specific sub-types of breast cancer. Therefore, in the context of identifying sub-type specific biomarkers, the purpose of this study is to investigate whether fully-automated measures of breast density and whole-breast parenchymal texture are associated with estrogen-receptor positive (ER+) breast cancer. Ultimately, sub-type specific risk assessment could help better guide chemopreventative interventions for breast cancer.
Fig. 1.
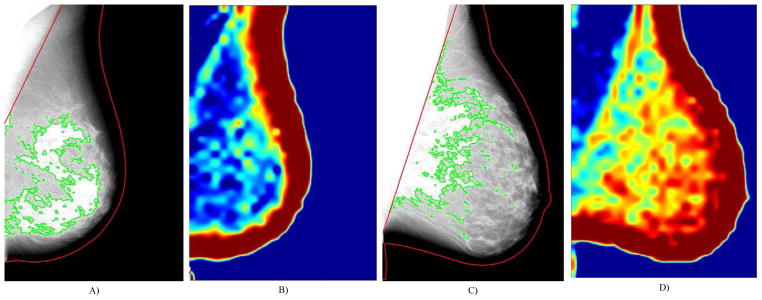
Breast density segmentations (A, C) and entropy texture maps (B, D) from raw (i.e., “For Processing”), contralateral mammograms of women diagnosed with ER+ (A–B) and ER− breast cancer (C–D). These women have approximately equal breast percent density scores (PD=23%) but different parenchymal patterns of the entropy texture measure (B and D).
2. METHODS
2.1 Study population and image dataset
In this IRB-approved, HIPAA-compliant retrospective study, we identified a cohort of 106 women over 40 years of age with unilateral primary invasive breast cancer with known estrogen receptor (ER) status from a previously completed multimodality breast imaging trial at our institution (National Institutes of Health P01 CA85484; PI: M. Schnall). For each woman, we obtained their raw (i.e., “For Processing”) full-field digital mammograms (Senographe 2000D and DS; GE Healthcare, Chalfont St Giles, UK) for analysis. In this study, we analyzed the mediolateral-oblique (MLO) view mammogram of the contralateral (i.e., cancer-unaffected) breast as a surrogate of inherent tissue properties predisposing women to have a higher risk for developing ER sub-type specific breast cancer12.
2.2 Breast density and parenchymal texture feature extraction
Absolute area density, non-dense area, and PD% were estimated using fully-automated, validated software previously developed by our group13. The algorithm first segments the breast region of a mammogram via an automated thresholding technique to remove the air-region followed by a straight-line Hough transform to delineate and remove the region of the mammogram containing pectoral muscle. The algorithm then clusters the pixels within the breast region into groups of similar intensity via an adaptive, multi-class fuzzy c-means clustering algorithm. Lastly, these sub-regions of the breast are classified as being either dense or non-dense (i.e., fatty), with the dense clusters being merged into a final dense-tissue segmentation. The absolute dense tissue area of the segmentation can be then be used to obtain PD%:
| (1) |
where |MD| and |MB| are the area of the breast segmentation and dense tissue segmentation. Example breast density segmentations for two women with approximately equal PD% estimates are provided in figures 1A and 1C.
Whole breast parenchymal texture analysis was performed using our validated lattice-based approach14. Briefly, using the breast mask generated by the density segmentation algorithm above, a lattice of sampling points is overlaid on the breast region. At each lattice-point, a 63-pixel-square window is analyzed to extract a series of 19 first-order histogram15, run-length16, gray-level co-occurrence17, fractal18 and structure19 features (previously also shown to be robust to image-detector effects20). The average of value of each texture feature within the breast tissue region of a given mammogram was used as the aggregate score of that texture descriptor within the breast. The texture features, as well as their individual correlations to area breast density estimates, are provided in Table 1. Sample texture maps of the co-occurrence matrix entropy texture measure are shown for two women in figures 1B and 1D.
Table 1.
Pearson correlations between the parenchymal texture and breast density measures. Correlation values marked with an ‘*’ indicate statistically significant associations at the α=0.05 level.
| Texture Measure | Dense Area | Non-dense Area | Area Percent Density |
|---|---|---|---|
| 5th Percentile | 0.07 | 0.23* | −0.13 |
| 95th Percentile | −0.44* | −0.63* | 0.21* |
| Cluster Shade | −0.20* | −0.31* | 0.10 |
| Correlation | 0.24* | −0.04 | 0.14 |
| Edge Radius | −0.16 | −0.31* | 0.16 |
| Energy | −0.04 | −0.09 | 0.00 |
| Entropy | −0.28* | −0.41* | 0.18 |
| Fractal Dimension | 0.17 | 0.59* | −0.38* |
| Grey Level Non-uniformity | 0.00 | 0.20* | −0.22* |
| Haralick Correlation | −0.23* | −0.50* | 0.23* |
| High Gray Level Run Emphasis | −0.36* | −0.54* | 0.21* |
| Inertia | −0.48* | −0.67* | 0.22* |
| Inverse Difference Moment | 0.22* | 0.24* | −0.09 |
| Kurtosis | −0.16 | −0.16 | 0.02 |
| Local Binary Pattern | −0.08 | 0.14 | −0.19 |
| Maximum Value | −0.45* | −0.64* | 0.21* |
| Minimum Value | 0.17 | 0.35* | −0.15 |
| Skewness | −0.26* | −0.88* | 0.49* |
| Standard Deviation | −0.45* | −0.67* | 0.24* |
2.3 Statistical analysis
The association between the 19 texture measures and the 3 breast density estimates, namely absolute dense area, absolute non-dense (i.e., area adipose) and area percent density, was assessed using Pearson’s correlation. To estimate the joint discriminatory capacity of the breast density and texture features to distinguish between women with ER+ and ER− breast cancer, logistic regression analysis with backward stepwise feature selection using standard entry (p<0.05) and exit (p>0.10) criterion was performed. A model considering of all the image-derived measures was compared to a baseline model consisting of only the three area density measures and a second model consisting of only the texture measures. In this analysis, all area density measures were log-transformed and all texture measures were z-scored. Area under the curve (AUC) of the receiver operating characteristic (ROC) and Delong’s test were used to compare model performance in distinguishing between women with ER+ versus ER− cancer.
3. RESULTS
The texture and breast density measures have different strengths of associations between them. Non-dense area and skewness have the strongest association with a Pearson correlation of r=−0.88 (p<0.001). In contrast, the kurtosis, energy and local binary pattern texture features are not significantly correlated with any of the three breast density measures. The complete list of correlations between the breast density and parenchymal texture measures are provided in Table 1. In terms of the performance of the imaging measures to distinguish between women with ER+ versus ER− cancer, the density-alone model had a discriminatory capacity of 0.62 AUC (p=0.05). The texture-alone model had a higher discriminatory capacity of 0.70 AUC (p=0.001), which was not statistically different compared to the density- alone model (p=0.37). In contrast the combined density-texture logistic regression model had a discriminatory capacity of 0.82 AUC (p<0.001), which was statistically significantly higher than both the density-alone (p<0.001) and texture-alone models (p<0.04). In the combined model, the absolute dense, non-dense, and PD% density measures were retained after feature-selection (p<0.05), as were also the energy, local skewness, local standard deviation, local binary pattern, edge radius, inverse difference moment, entropy, cluster-shade and inertia texture features (p<0.05) (i.e., a total of 12 out of the 22 density and texture features combined). The ROC curves of the three models are provided in figure 2.
Fig. 2.

Receiver operating characteristic performance of the logistic regression models compared to classify ER cancer status.
4. DISCUSSION
Our study demonstrates a novel application of parenchymal texture analysis, showing that subtype-specific breast cancer risk assessment may be feasible using fully-automated measures of parenchymal texture combined with breast density. We found that certain measures of the parenchymal texture pattern, namely the kurtosis, energy and local binary pattern features, have no correlation with area breast density measures, thus indicating that they may be capturing different properties of the breast parenchymal tissue. Specifically in the context of sub-type specific breast cancer risk assessment, texture measures may be useful in capturing differences of underlying endogenous hormonal tissue exposure21 and other biological factors which may be potentially related to a woman’s risk of developing different sub-types of cancer as well as her risk to develop cancer in general. Furthermore, we also found that breast density and texture measures may independently contribute to measuring a woman’s risk to develop sub-type specific breast cancers. Future larger studies will be focused on investigating the capacity of these imaging features to distinguish between sub-type specific risk in the general population using independent sample validation.
5. CONCLUSION
In this work, we demonstrate that the combination of breast density and parenchymal texture measures may have the potential to identify women specifically at risk for estrogen-receptor positive breast cancer. Ultimately, sub-type specific breast cancer risk assessment models may help to better guide chemoprevention for women at high-risk of breast cancer.
Acknowledgments
This work was supported in by an American Cancer Society Grant (No. RSGHP-CPHPS-119586), and the National Institutes of Health (R01 CA161749 and 1U54CA163313-01). The authors would also like to thank Dr. Mitchell D. Schnall for allowing access to the clinical trial data used in this work, and Dr. Andrew D.A. Maidment and Ms. Kathleen Thomas for facilitating access to the imaging data and study information included in our analysis.
References
- 1.Kerlikowske K. Evidence-based breast cancer prevention: the importance of individual risk. Ann Intern Med. 2009;151(10):750–2. doi: 10.7326/0003-4819-151-10-200911170-00012. [DOI] [PubMed] [Google Scholar]
- 2.Gail MH. Personalized estimates of breast cancer risk in clinical practice and public health. Stat Med. 2011;30(10):1090–104. doi: 10.1002/sim.4187. [DOI] [PMC free article] [PubMed] [Google Scholar]
- 3.Gail MH, Brinton LA, Byar DP, Corle DK, Green SB, Schairer C, Mulvihill JJ. Projecting individualized probabilities of developing breast cancer for white females who are being examined annually. J Natl Cancer Inst. 1989;81(24):1879–86. doi: 10.1093/jnci/81.24.1879. [DOI] [PubMed] [Google Scholar]
- 4.Lehman CD, Blume JD, Weatherall P, Thickman D, Hylton N, Warner E, Pisano E, et al. Screening women at high risk for breast cancer with mammography and magnetic resonance imaging. Cancer. 2005;103(9):1898–905. doi: 10.1002/cncr.20971. [DOI] [PubMed] [Google Scholar]
- 5.Saslow D, Boetes C, Burke W, Harms S, Leach MO, Lehman CD, Morris E, et al. American Cancer Society guidelines for breast screening with MRI as an adjunct to mammography. CA Cancer J Clin. 2007;57(2):75–89. doi: 10.3322/canjclin.57.2.75. [DOI] [PubMed] [Google Scholar]
- 6.Thomsen A, Kolesar JM. Chemoprevention of breast cancer. Am J Health Syst Pharm. 2008;65(23):2221–8. doi: 10.2146/ajhp070663. [DOI] [PubMed] [Google Scholar]
- 7.Vogel VG. Preventing breast cancer in high-risk women, 2008. Oncology (Williston Park) 2008;22(6):666–73. discussion 679, 682–684. [PubMed] [Google Scholar]
- 8.Rockhill B, Spiegelman D, Byrne C, Hunter DJ, Colditz GA. Validation of the Gail et al. model of breast cancer risk prediction and implications for chemoprevention. J Natl Cancer Inst. 2001;93(5):358–66. doi: 10.1093/jnci/93.5.358. [DOI] [PubMed] [Google Scholar]
- 9.Fisher B, Costantino JP, Wickerham DL, Cecchini RS, Cronin WM, Robidoux A, Bevers TB, et al. Tamoxifen for the prevention of breast cancer: current status of the National Surgical Adjuvant Breast and Bowel Project P-1 study. J Natl Cancer Inst. 2005;97(22):1652–62. doi: 10.1093/jnci/dji372. [DOI] [PubMed] [Google Scholar]
- 10.Boyd NF, Guo H, Martin LJ, Sun L, Stone J, Fishell E, Jong RA, et al. Mammographic density and the risk and detection of breast cancer. N Engl J Med. 2007;356(3):227–36. doi: 10.1056/NEJMoa062790. [DOI] [PubMed] [Google Scholar]
- 11.Li H, Giger ML, Lan L, Bancroft Brown J, MacMahon A, Mussman M, Olopade OI, Sennett C. Computerized analysis of mammographic parenchymal patterns on a large clinical dataset of full-field digital mammograms: robustness study with two high-risk datasets. J Digit Imaging. 2012;25(5):591–8. doi: 10.1007/s10278-012-9452-z. [DOI] [PMC free article] [PubMed] [Google Scholar]
- 12.Chen Y, Thompson W, Semenciw R, Mao Y. Epidemiology of contralateral breast cancer. Cancer Epidemiol Biomarkers Prev. 1999;8(10):855–61. [PubMed] [Google Scholar]
- 13.Keller BM, Nathan DL, Wang Y, Zheng Y, Gee JC, Conant EF, Kontos D. Estimation of breast percent density in raw and processed full field digital mammography images via adaptive fuzzy c-means clustering and support vector machine segmentation. Med Phys. 2012;39(8):4903–17. doi: 10.1118/1.4736530. [DOI] [PMC free article] [PubMed] [Google Scholar]
- 14.Zheng Y, Wang Y, Keller BM, Conant E, Gee JC, Kontos D. A fully-automated software pipeline for integrating breast density and parenchymal texture analysis for digital mammograms: parameter optimization in a case-control breast cancer risk assessment study. 86701B-86701B-7. [Google Scholar]
- 15.Huo Z, Giger ML, Wolverton DE, Zhong W, Cumming S, Olopade OI. Computerized analysis of mammographic parenchymal patterns for breast cancer risk assessment: feature selection. Med Phys. 2000;27(1):4–12. doi: 10.1118/1.598851. [DOI] [PubMed] [Google Scholar]
- 16.Manduca A, Carston MJ, Heine JJ, Scott CG, Pankratz VS, Brandt KR, Sellers TA, et al. Texture features from mammographic images and risk of breast cancer. Cancer Epidemiol Biomarkers Prev. 2009;18(3):837–45. doi: 10.1158/1055-9965.EPI-08-0631. [DOI] [PMC free article] [PubMed] [Google Scholar]
- 17.Gibbs P, Turnbull LW. Textural analysis of contrast-enhanced MR images of the breast. Magn Reson Med. 2003;50(1):92–8. doi: 10.1002/mrm.10496. [DOI] [PubMed] [Google Scholar]
- 18.Li H, Giger ML, Olopade OI, Lan L. Fractal analysis of mammographic parenchymal patterns in breast cancer risk assessment. Acad Radiol. 2007;14(5):513–21. doi: 10.1016/j.acra.2007.02.003. [DOI] [PubMed] [Google Scholar]
- 19.Ojala T, Pietikainen M, Maenpaa T. Multiresolution gray-scale and rotation invariant texture classification with local binary patterns. Pattern Analysis and Machine Intelligence, IEEE Transactions on. 2002;24(7):971–987. [Google Scholar]
- 20.Wang Y, Keller BM, Zheng Y, Acciavatti RJ, Gee JC, Maidment AD, Kontos D. Texture feature standardization in digital mammography for improving generalizability across devices. 867026-867026-8. [Google Scholar]
- 21.Daye D, Keller B, Conant EF, Chen J, Schnall MD, Maidment AD, Kontos D. Mammographic parenchymal patterns as an imaging marker of endogenous hormonal exposure: a preliminary study in a high-risk population. Acad Radiol. 2013;20(5):635–46. doi: 10.1016/j.acra.2012.12.016. [DOI] [PMC free article] [PubMed] [Google Scholar]