Abstract
Responses of units in the central nucleus of the inferior colliculus of the guinea pig were recorded with tungsten electrodes. The set of data presented here is limited to high stimulus levels. The effect of changing the modulation frequency and the modulation depth was explored for acoustic and laser stimuli. The selected units responded to sinusoidal amplitude modulated (AM) tones, AM trains of clicks, and AM trains of laser pulses with a modulation of their spike discharge. At modulation frequencies of 20 Hz, some units tended to respond with 40 Hz to the acoustic stimuli, but only at 20 Hz for the trains of laser pulses. For all modes of stimulation the responses revealed a dominant response to the first cycle of the modulation, with decreasing number of action potential during successive cycles. While amplitude modulated tone bursts and amplitude modulated trains of acoustic clicks showed similar patterns, the response to trains of laser pulses was different.
Keywords: infrared neural stimulation, cochlea, amplitude modulation, inferior colliculus, guinea pig
1. INTRODUCTION
Amplitude and frequency modulation of acoustical signals are important features in acoustic communication. For example, the pitch of complex sounds is one of the most fundamental features of hearing. Hypotheses have been presented of how the brain extracts pitch from complex acoustic signals. Based on previous studies, these signals appear to be processed in the midbrain. In particular, it has been studied extensively how neural units in the inferior colliculus respond to amplitude and frequency modulated sounds. The role of the inferior colliculus has been emphasized in this role. It receives ascending and descending neural inputs from many different sources. Ascending inputs, for example, include connections with the cochlear nucleus, the superior olivary complex (SOC), and nuclei of the lateral lemniscus (NLL). For the design of neural prostheses that use either electrical current or photons to stimulate the neurons, it is even more important to understand the processing of complex sound signal. The aim of this study is to determine the differences and similarities of responses to acoustical and infrared neural stimulation in the central nucleus inferior colliculus (ICC), which will lead to better understanding of the neural processing in a normal functioning auditory system and during the use of prostheses. For cochlear prostheses it would be important to determine whether similar response patterns can be evoked, or whether the neural cochlear degeneration in the cochlear significantly affects the ability to code information. Here, we intend to compare the responses recorded in the ICC to acoustic sinusoidal tones, with ICC responses to acoustic trains of clicks, and ICC responses to trains of laser pulses. Amplitude modulated trains of optical pulses from a laser were used to stimulate the cochlea and the responses obtained in the central nucleus of the ICC were compared with the response obtained with acoustical stimulation. The analysis explored the effects of modulation depth and modulation frequency on the responses obtained in the ICC.
2. METHODS
Pigmented guinea pigs (200–1500 g) of either sex were used in the experiments. Care and use of animals were carried out within guidelines of the NIH Guide for the Care and Use of Laboratory Animals and were approved by the Animal Care and Use Committee of Northwestern University.
2.1 Animal procedures
As described before, animals were anesthetized with urethane 1.3 g/kg i.p.. Urethane injections were supplemented with ketamine (44 mg/kg) and xylazine (5 mg/kg) at the beginning of surgical procedures. Anesthesia in all guinea pigs was maintained by supplements of ketamine (44 mg/kg) and xylazine (5 mg/kg) along with saline solution (0.5 ml). Depth of anesthesia was assessed every 15 minutes with a paw withdrawal reflex. Core body temperature was maintained at 38°C with a thermostatically controlled heating pad. After the animal was anesthetized, a tracheotomy was made and a plastic tube (1.9 mm outer diameter, 1.1 mm inner diameter, Zeus Inc., Orangeburg, SC) was secured into the trachea. The tube was connected to an anesthesia system (Hallowell EMC, Pittsfield, MA). The animals were ventilated on oxygen throughout the length of the experiment. Next, the animal was placed in a stereotatic head holder (Stoelting, Kiel, WI). Once the head was secured with the ear bars, a custom-made boom was attached to the holder to affix a stabilizer post to the skull using 1.5 mm cortex screws (veterinary orthopedic implants, St Augustine, FL) and methyl methacrylate (Teets, Diamond Springs, CA). After the methyl methacrylate cured, the left ear bar was removed to allow for better surgical access and unobstructed pathway for auditory stimulus presentation with the Beyer DT770Pro speaker. A c-shaped skin incision was made behind the left ear lobe and the cervicoauricular muscles were removed. The cartilaginous outer ear canal was exposed and cut for acoustic stimulus presentation. The left bulla was exposed and opened approximately 2×3 mm with a motorized drill (World Precision Instruments, Sarasota, FL). The basal turn of the cochlea was identified and a cochleostomy was created with a 0.5 mm Buckingham footplate hand drill (Richards Manufacturing Co., Memphis, TN) or with the motorized drill and a 1 mm drill bit. The optical fiber was inserted through the opening of the cochlear wall. To measure compound action potentials (CAPs), a silver ball electrode was placed on the round window with a reference in the tissue near the neck. For ICC recordings a single channel tungsten electrode was placed in the right (contralateral) ICC. To access the ICC, the right temporalis muscle was reflected, and an approximate 5×5-mm opening was made in the right parietal bone just dorsal to the parietal/temporal suture and just rostral to the tentorium [2]. A small incision in the dura mater was made and the electrode was advanced through the occipital cortex in steps of 5–10 µm with an inchworm motor (6000 ULN, Burleigh Instruments, Fishers, NY). The electrode was inserted into the ICC on a dorsolateral to ventromedial trajectory at approximately 45° off the parasagittal plane in the coronal plane. Using this trajectory, the electrode array passed through the central nucleus of the ICC approximately orthogonal to its isofrequency laminae [2–4]. At each measurement site the best frequency of the unit was identified using tone bursts. A series of up to 80 different amplitude modulated signals were used to stimulate the cochlea while the neural responses of the units were recorded.
2.2 Stimuli delivered to the cochlea
As described above, the cochlea was stimulated with AM tone bursts, AM trains of acoustic clicks, and AM trains of laser pulses. Evoked neural responses were recorded from identified units in the inferior colliculus.
Tone bursts:
Sinusoidal tone bust with a 5 ms rise and fall time and a carrier frequency equivalent to the best frequency of the selected units in the ICC were modulated in amplitude. The modulation frequency increased in 5 steps per octave, starting at 40 Hz. The driving voltage was fed to an audio amplifier to drive the Beyer DT770Pro headphone, which was coupled to the outer ear canal of the animal.
Trains of acoustic stimuli
Sequences of acoustic clicks (100 µs) were delivered to the outer ear canal at a rate of 2 Hz. The sequences or trains of clicks were 100–200 ms long with a repetition rate of the clicks at 200 Hz. The amplitude of the clicks was modulated with sinusoidal signals at 20, 40, and 80 Hz. For each data point 20 pulse trains were presented.
Laser
Cochlear stimulation was achieved with diode lasers (Lockheed Martin Aculight Corp., Bothell, WA). The laser was coupled to the angle-polished or flat-polished optical fibers (Ocean Optics Inc., Dunedin, FL) with core diameter of 200 µm. The radiation wavelength was 1862 nm and the pulse duration was 100 µs. The pulse energy of the laser was controlled directly by varying the current to the laser diode and was between 0 and 127 µJ/pulse at the tip of the optical fiber in air. Sequences of laser pulses were delivered via the optical fiber to the auditory neurons at a rate of 2 Hz. The sequences were 100–200 ms long with a repetition rate of the laser pulses at 200 Hz. The radiant energy of the laser pulses was modulated with a sinusoid at 20, 40, and 80 Hz. For each data point 20 pulse trains were presented.
3. RESULTS
3.1 Sinusoidal tone bust
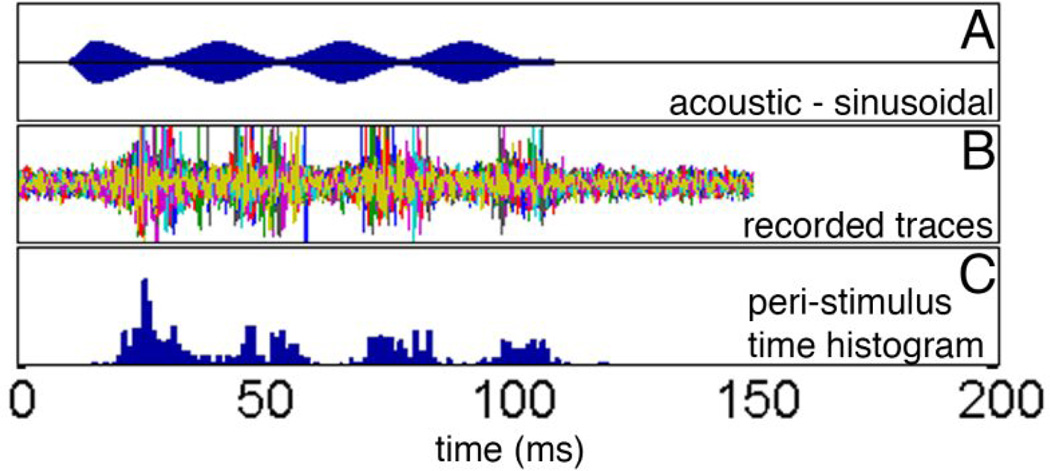
After a stable unit in the ICC has been identified, the best frequency of the unit was determined with acoustic tone bursts. The best frequency of the unit was then used as the carrier frequency for the stimulus that was modulated with a sinusoid (Figure 1A). In the example shown in Figure 1A, the carrier frequency was 11 kHz and the modulation frequency was 40 Hz. Neural responses from each unit were recorded for each stimulus presentation. The plot of responses from 20 successive stimulus presentation is shown in Figure 1B. The selected unit responded with a delay of about 10 ms to each of the stimuli (Figure 1B). At 40 Hz stimulation rate the selected unit responded at a given phase of the stimulus. The number of events and the timing are quantified in a peri-stimulus time histogram (PSTH, Figure 1C). It is apparent that the response to the first modulation maximum was the strongest. In successive cycles the responses dropped if compared to the first maximum by about 50% but remained stable over the subsequent stimulus cycles (Figure 1C).
Figure 1.
A shows the amplitude-modulated stimulus which was delivered by a BeyerDT770 headphone. The carrier is a 11 kHz tone, the modulation frequency was 40 Hz. The responses to 20 stimulus presentation are shown in B. Each color presents a single response. Action potentials were identified and the times between the stimulus onset and the occurrence of the action potentials were determined. C shows the peri-stimulus time histogram for the acoustic stimulation.
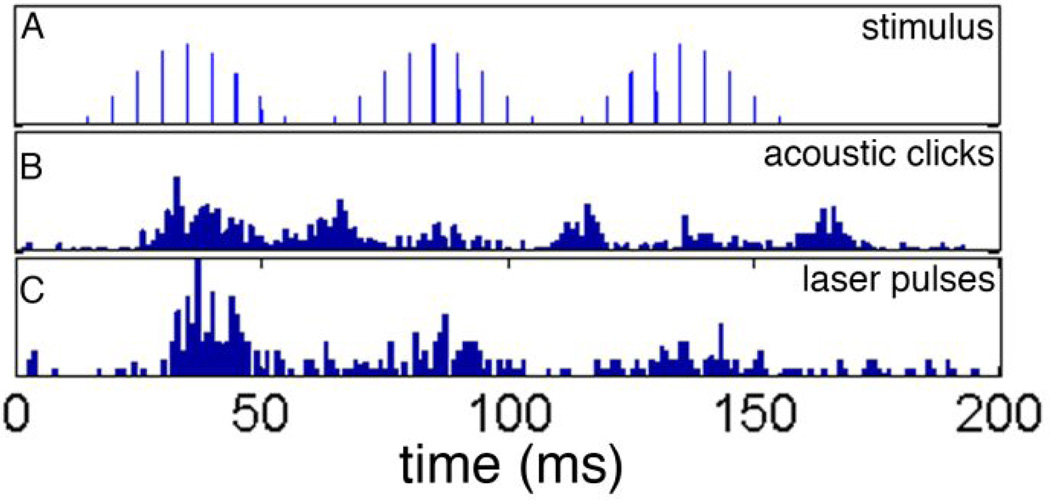
The same unit, which was used for Figure 1, was used for Figure 2. Responses were evoked with trains of acoustic clicks and trains of laser pulses. The modulation frequency was 20 Hz, the modulation depth was 100%, and the rate of the carrier was 200 Hz. Trains of stimuli were presented at a rate of 2 Hz. The top trace of the figure (Figure 2A) depicts the timing and the level of the stimuli, acoustic or optical. Figure 2B shows the PSTH, which was constructed from responses to AM trains of acoustic clicks. At 20 Hz modulation frequency, the selected unit responded with twice of the modulation frequency. This was not the case for stimulation with the laser (Figure 2C). The unit only responded at one given phase during the stimulus cycle.
Figure 2.
A shows the stimulus. For acoustic stimulation it is a train of amplitude modulated clicks delivered with a BeyerDT770. For INS it is a train of laser pulses delivered with a 200 µm optical fiber. B shows the peri-stimulus time histogram for the acoustic stimulation. C shows the response to trains of laser pulses. The modulation frequency was 20 Hz, the carrier frequency was 200 Hz.
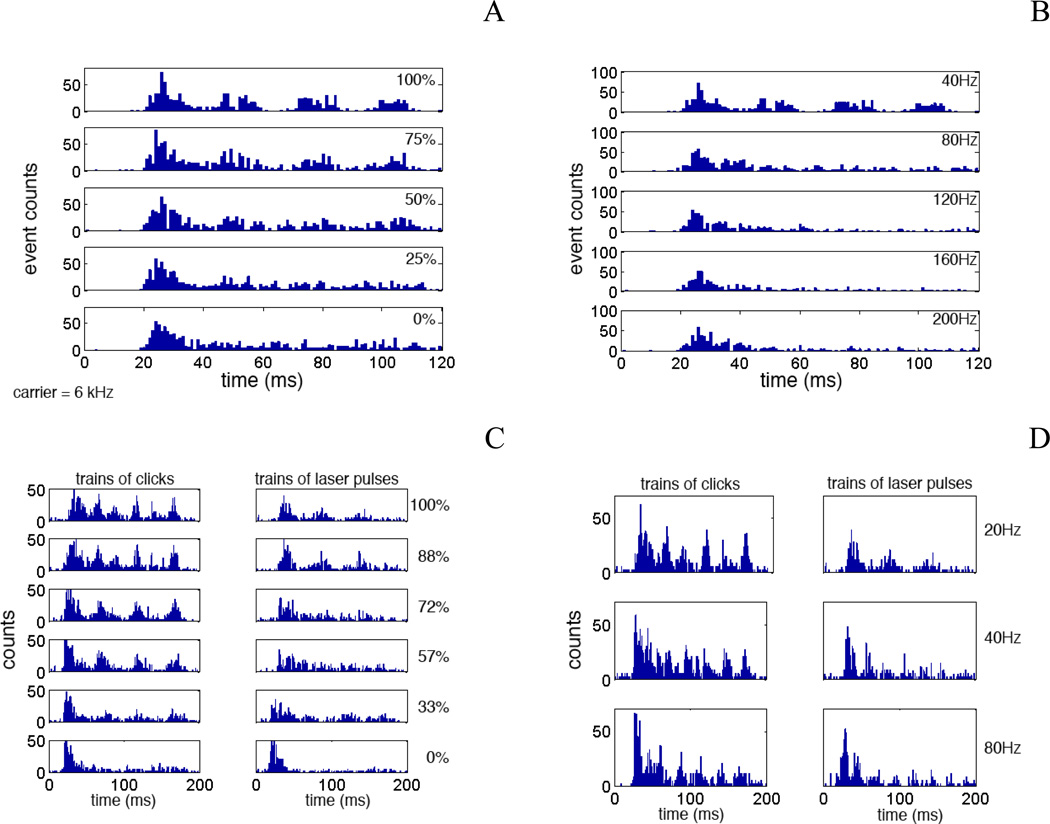
Response properties of two additional units are shown in Figures 3 and 4. In Figure 3, the best frequency of the unit was 6 kHz. This frequency was selected as the carrier frequency for the tone bursts. The responses to the tone bursts which were modulated with 40 Hz at different modulation depths are presented in Figure 3A. The strongest response correlated with the first cycle of the modulation. Subsequent cycles decreased in response strength. At modulation depths below 50% only the initial response could be seen (Figure 3A). The responses to AM tone bursts with modulation frequencies between 40 and 200 Hz at a modulation depth of 100% are presented in Figure 3B. Again, the responses to the first cycle of the modulation were the strongest. Responses to subsequent modulation cycles could be seen for 40 and 80 Hz but not for frequencies above 80 Hz. The strength to the first cycle of the modulation decreased with increasing modulation frequency by about 15% (Figure 3B). The responses to trains of acoustic clicks and trains of laser pulses are shown in Figure 3C and D. In the left panel of Figure 3C the modulation depth of the acoustic stimulus was changed. The repetition rate of the carrier is 200 Hz and the modulation frequency was 20 Hz. At high stimulus levels and at modulations depth of 88 and 100%, the unit responded at twice the modulation frequency. For lower modulation depth the unit response correlated with the modulation frequency. Below 33% modulation depth only the initial response could be seen. In the right panel of Figure 3C the modulation depth of the optical stimulus was changed. Again, the repetition rate of the carrier is 200 Hz and the modulation frequency was 20 Hz. In contrast to acoustical stimulation, for all modulation depths the unit response correlated with the modulation frequency. Moreover, the modulation disappeared at a modulation depth of 72% versus 33% for acoustical stimuli.
Figure 3.
A and B show the PSTHs constructed from neural reponses from untis in the ICC in reponse to acosutical stimualtion with a sinusoid. In A the modulation depth was changed from 100% to 0%. The initial response can be seen in all traces. No response to mdoulation can be seen at 25% modulation depth. Repsonse occurs once per stimulus cycle. In B the modulation frequency was changed from 40 to 200 Hz. The mdoulation depth was kept at 100%. Modulation threshold was at about 40 Hz. For modulation frequencies above 40 Hz only a response at the onset of the tone burst could be recorded. C shows the response of the unit to trains of AM modulated acoustic clicks (left column) and to trains of laser pulses (right column). While two responses can be recorded for the acoustic clicks it is not the case for INS. In both cases lower modulation depth only gives an initial response. D shows the responses of the same unit to trains of AM modulated acoustic clicks (left column) and to trains of laser pulses (right column). Acosutic stimuation resulted in two responses per cycle for 20 and 40 Hz. This was not the case for INS. The response decreases from the first to the second modulation peak and remains constant for subsequent peak for acoustic stimuation. For INS the drop in response strength continued decreasing with increasing of modualtion cycles.
Figure 4.
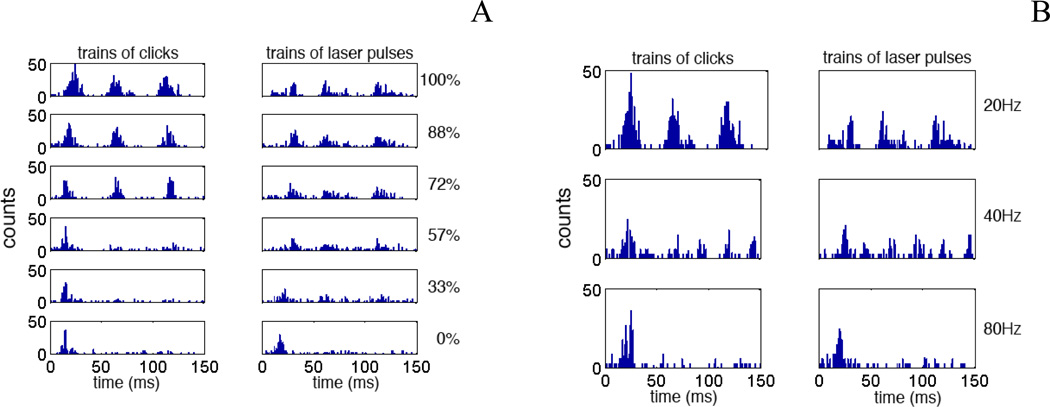
A and B show the PSTHs constructed from the response of a different unit of the ICC to trains of AM modulated acoustic clicks (left column) and to trains of laser pulses (right column). In A the modulation depth has been changed from 100% to 0%. The initial response can be seen in all traces. Little response to mdoulation can be seen at 33% modulation depth. Repsonse occurs once per stimulus cycle. B Acosutic stimulation and INS resulted a single response per cycle for 20, 40 and 80 Hz.
Figure 3D compares the effect of the modulation frequency on the unit responses. While the acoustic stimuli evoked a response twice the modulation frequency at low modulation frequencies this was not the case for INS. Again the first response dominated and the response strength decreased with number of modulations cycles of the modulation.
The responses obtained from another unit to trains of acoustic clicks and trains of laser pulses are shown in Figure 4A and B. In the left panel of Figure 4A the modulation depth of the acoustic stimulus was changed. Again, the rate of the carrier was 200 Hz and the modulation frequency was 20 Hz. Different to the unit in Figure 3, this unit only responded at a modulation depth above 57%. Although the response to the acoustic stimulus was much stronger when compared to the response to the laser, the laser had a lower modulation threshold (33%, Figure 4A, right panel). Again the first response dominated. The response strength did not decrease over several modulation cycles as has been shown in the other two examples. Figure 4B compares the effect of the modulation frequency on the unit responses. Again the first response dominated and the response strength decreased with number of modulations cycles of the modulation. Only the initial response could be seen for modulation frequencies above 40 Hz. For the unit presented in Figure 4 the responses were comparable.
4. DISCUSSION
The responses to amplitude-modulated tones found in this study are similar to those that have been previously published in the literature [5–13]. The units responded to the amplitude modulation with a neural discharge, which was synchronous to the modulation waveform of the sound. For stimulus levels above stimulation threshold all of the units in this study revealed a dominant onset response. With increasing modulation depth the units started to respond to all cycles of the modulation waveform. However, the strength of the response decreased for later cycles. This is work in progress and the number of recorded units is too small to determine the maximum of the modulation transfer function. Trains of acoustic clicks evoked similar responses as the amplitude modulated tones. All units showed a dominant response at the beginning of the train of clicks. At modulation depths above 33% for most of the units the neural responses followed the modulation waveform of the train of clicks. At modulation frequencies up to 40 Hz and for modulation depths of 88% and more some of the units showed two responses per cycle. This behavior has been described previously for amplitudemodulated signals [13–16].
The results were different for trains of laser pulses. Although for trains of acoustic clicks some units responded twice during the stimulus cycle, such as shown in the example in Figure 3, the same unit did not show the same behavior if stimulated with trains of laser pulses that were identical to the train of acoustic clicks. For laser pulses the units responded synchronous to the modulation waveform of the pulse train. Trains of laser pulses had a strong onset response at the beginning of the pulse train. However, the occurrence of the spikes was more spread out than it was observed for the trains of clicks. Furthermore, the responses to the second and third subsequent cycle of the modulation decreased systematically. For the examples presented here, the units could not follow modulation frequencies above 80 Hz. More units are needed to construct a reliable modulations transfer function.
Previous works has shown that amplitude modulated (AM) signals are transmitted by the timing and the rate of nerve action potentials (APs). Responses to AM signal have been studied in the cat. The studies demonstrate that the cochlea acts as a low pass filter for AM signals with a cut-off frequency of about 630 Hz [11]. Responses to AM signals depend on several factors, including modulation depth, modulation frequency, and stimulus level.
4.1 Summary
Experiments that compare responses of units in the central nucleus of the ICC to sinusoidal amplitude modulated tones with amplitude modulated trains of acoustic clicks and amplitude modulated trains of laser pulses showed that responses to acoustical stimuli are similar, but differ to trains of laser pulses. From the results of the limited number of units available it can be concluded that timing of the responses is more accurate for acoustical stimulation and that modulation is represented better for acoustical stimulation. Still, it can be shown that in general amplitude modulated INS stimuli are able to produce similar response patterns. Further experiments are required to further quantify the trends seen in the initial study.
ACKNOWLEDGMENTS
This project has been funded with federal funds from the National Institute on Deafness and Other Communication Disorders, R01 DC011855-01A1 and by Lockheed Martin Aculight.
REFERENCES
- 1.Goyal V, et al. Acute damage threshold for infrared neural stimulation of the cochlea: functional and histological evaluation. Anatomical record. 2012;295(11):1987–1999. doi: 10.1002/ar.22583. [DOI] [PMC free article] [PubMed] [Google Scholar]
- 2.Richter C-P, et al. Spread of cochlear excitation during stimulation with optical radiation: Inferior colliculus measurements. J Neural Eng. 2011;8(5):056006. doi: 10.1088/1741-2560/8/5/056006. [DOI] [PMC free article] [PubMed] [Google Scholar]
- 3.Snyder RL, Bierer JA, Middlebrooks JC. Topographic spread of inferior colliculus activation in response to acoustic and intracochlear electric stimulation. J Assoc Res Otolaryngol. 2004;5(3):305–322. doi: 10.1007/s10162-004-4026-5. [DOI] [PMC free article] [PubMed] [Google Scholar]
- 4.Snyder RL, Middlebrooks JC, Bonham BH. Cochlear implant electrode configuration effects on activation threshold and tonotopic selectivity. Hear Res. 2008;235(1–2):23–38. doi: 10.1016/j.heares.2007.09.013. [DOI] [PMC free article] [PubMed] [Google Scholar]
- 5.Geis HR, Borst JG. Intracellular responses of neurons in the mouse inferior colliculus to sinusoidal amplitude-modulated tones. Journal of neurophysiology. 2009;101(4):2002–2016. doi: 10.1152/jn.90966.2008. [DOI] [PubMed] [Google Scholar]
- 6.Tan ML, Borst JG. Comparison of responses of neurons in the mouse inferior colliculus to current injections, tones of different durations, and sinusoidal amplitude-modulated tones. Journal of neurophysiology. 2007;98(1):454–466. doi: 10.1152/jn.00174.2007. [DOI] [PubMed] [Google Scholar]
- 7.Sinex DG, et al. Responses of chinchilla inferior colliculus neurons to amplitude-modulated tones with different envelopes. Journal of the Association for Research in Otolaryngology : JARO. 2002;3(4):390–402. doi: 10.1007/s101620020026. [DOI] [PMC free article] [PubMed] [Google Scholar]
- 8.Shaddock Palombi P, Backoff PM, Caspary DM. Responses of young and aged rat inferior colliculus neurons to sinusoidally amplitude modulated stimuli. Hearing research. 2001;153(1–2):174–180. doi: 10.1016/s0378-5955(00)00264-1. [DOI] [PubMed] [Google Scholar]
- 9.Krishna BS, Semple MN. Auditory temporal processing: responses to sinusoidally amplitude-modulated tones in the inferior colliculus. Journal of neurophysiology. 2000;84(1):255–273. doi: 10.1152/jn.2000.84.1.255. [DOI] [PubMed] [Google Scholar]
- 10.Condon CJ, White KR, Feng AS. Neurons with different temporal firing patterns in the inferior colliculus of the little brown bat differentially process sinusoidal amplitude-modulated signals. Journal of comparative physiology. A, Sensory, neural, and behavioral physiology. 1996;178(2):147–157. doi: 10.1007/BF00188158. [DOI] [PubMed] [Google Scholar]
- 11.Brugge JF, Blatchley B, Kudoh M. Encoding of amplitude-modulated tones by neurons of the inferior colliculus of the kitten. Brain Res Brain Res Protoc. 1993;615(2):199–217. doi: 10.1016/0006-8993(93)90030-q. [DOI] [PubMed] [Google Scholar]
- 12.Reimer K. Coding of sinusoidally amplitude modulated acoustic stimuli in the inferior colliculus of the rufous horseshoe bat, Rhinolophus rouxi. Journal of comparative physiology. A, Sensory, neural, and behavioral physiology. 1987;161(2):305–313. doi: 10.1007/BF00615250. [DOI] [PubMed] [Google Scholar]
- 13.Rees A, Moller AR. Stimulus properties influencing the responses of inferior colliculus neurons to amplitude-modulated sounds. Hearing research. 1987;27(2):129–143. doi: 10.1016/0378-5955(87)90014-1. [DOI] [PubMed] [Google Scholar]
- 14.Rees A, Palmer AR. Neuronal responses to amplitude-modulated and pure-tone stimuli in the guinea pig inferior colliculus, and their modification by broadband noise. J Acoust Soc Am. 1989 doi: 10.1121/1.397851. [DOI] [PubMed] [Google Scholar]
- 15.Joris PX, Schreiner CE, Rees A. Neural processing of amplitude-modulated sounds. Physiological reviews. 2004;84(2):541–577. doi: 10.1152/physrev.00029.2003. [DOI] [PubMed] [Google Scholar]
- 16.Snyder RL, Schreiner CE. Auditory neurophonic responses to amplitude-modulated tones: transfer functions and forward masking. Hearing research. 1987;31(1):79–91. doi: 10.1016/0378-5955(87)90215-2. [DOI] [PubMed] [Google Scholar]


