Abstract
A large number of growth factors and drugs are known to act in a biphasic manner: at lower concentrations they cause increased division of target cells, whereas at higher concentrations the mitogenic effect is inhibited. Often, the molecular details of the mitogenic effect of the growth factor are known, whereas the inhibitory effect is not. Hepatoctyte Growth Factor, HGF, has recently been recognized as a strong mitogen that is present in the microenvironment of solid tumors. Recent evidence suggests that HGF acts in a biphasic manner on tumor growth. We build a multi-species model of HGF action on tumor cells using different hypotheses for high dose-HGF activation of a growth inhibitor and show that the shape of the dose-response curve is directly related to the mechanism of inhibitor activation. We thus hypothesize that the shape of a dose-response curve is informative of the molecular action of the growth factor on the growth inhibitor.
Keywords: Cancer Modeling, Stem Cells, Coupled Dynamical Modeling, Cell Signaling, Nonlinear Biological Growth Control
1. INTRODUCTION
In development and tissue regeneration post-injury, a large number of growth factors have been found to elicit a biphasic response from the tissue: at lower concentrations the growth factor exerts a mitogenic or cell size growth effect, and at higher concentrations this effect is abrogated and cells quiesce or differentiate.(1, 2) For example, a long list of endogenous and exogenous agents display a biphasic dose-response curve with respect to neurite outgrowth both in vitro and in vivo, including Nerve Growth Factor (NGF), Fibroblast Growth Factor (FGF), Vascular Endothelial Growth Factor (VEGF), and adrenocorticotropic hormone (ACTH).(3, 4) Purported mechanisms for the biphasic dose response include presence of a high affinity and a low affinity receptor,(5–8) receptor internalization at high growth factor concentration,(9) and/or concentration-dependent biphasic receptor response via activation of opposing pathways.(10)
During skeletal muscle injury, dormant satellite myogenic stem cells are activated to enter the cell cycle by low concentrations of Hepatocyte Growth Factor, HGF, which is released from extracellular stores (as well as produced by spleen, liver, and the satellite cells themselves) after injury.(11, 12) But, at concentrations of greater than 10 ng/ml, HGF inhibits satellite cell division,(13, 14) and it was shown that this inhibition is due to increased myostatin (a TGFβ family member) production at higher levels of HGF.(10) As with the growth factors involved in neurite outgrowth, while the mitogenic action of HGF is well understood (HGF binds to its cognate c-Met receptor, whose activation results in translocation of β-catenin into the nucleus, where it acts as a transcription factor of canonical Wnt gene products(15)), the molecular nature of the inhibitory effect of HGF at high concentrations has not yet been established. Yamada et al. provided two hypotheses: that differential activation of c-Met is the cause of proliferation arrest, as evidenced by requirement of phosphatase SHP2 for the arrest, which is recruited by actived c-Met, and/or the presence of as yet unidentified low affinity receptors for HGF.(10, 13, 16)
We have recently found that culture of tumor spheroids derived from Colon Cancer Initiating Cells (CCICs), a primary colon cancer cell line,(17, 18) in presence of increasing concentrations of HGF, also has a biphasic effect on tumor growth.(19) Based on the research from Yamada et al. as well as findings that addition of HGF at a concentration of 40 ng/ml induces expression of several members of the TGFβ family in an in vitro liver organoid culture,(20) we have developed a simple model of biphasic HGF action on tumor growth where HGF stimulates canonical Wnt signal at low concentrations and TGFβ signal at higher doses. We show that the shape of the resulting dose-response curve of the model is dependent on the assumption of linearity (or non-linearity) of the effect of HGF on TGFβ production, hence demonstrating that the shape of the dose-response curve can give insight into the molecular nature of the biphasic response.
2. MATHEMATICAL MODEL
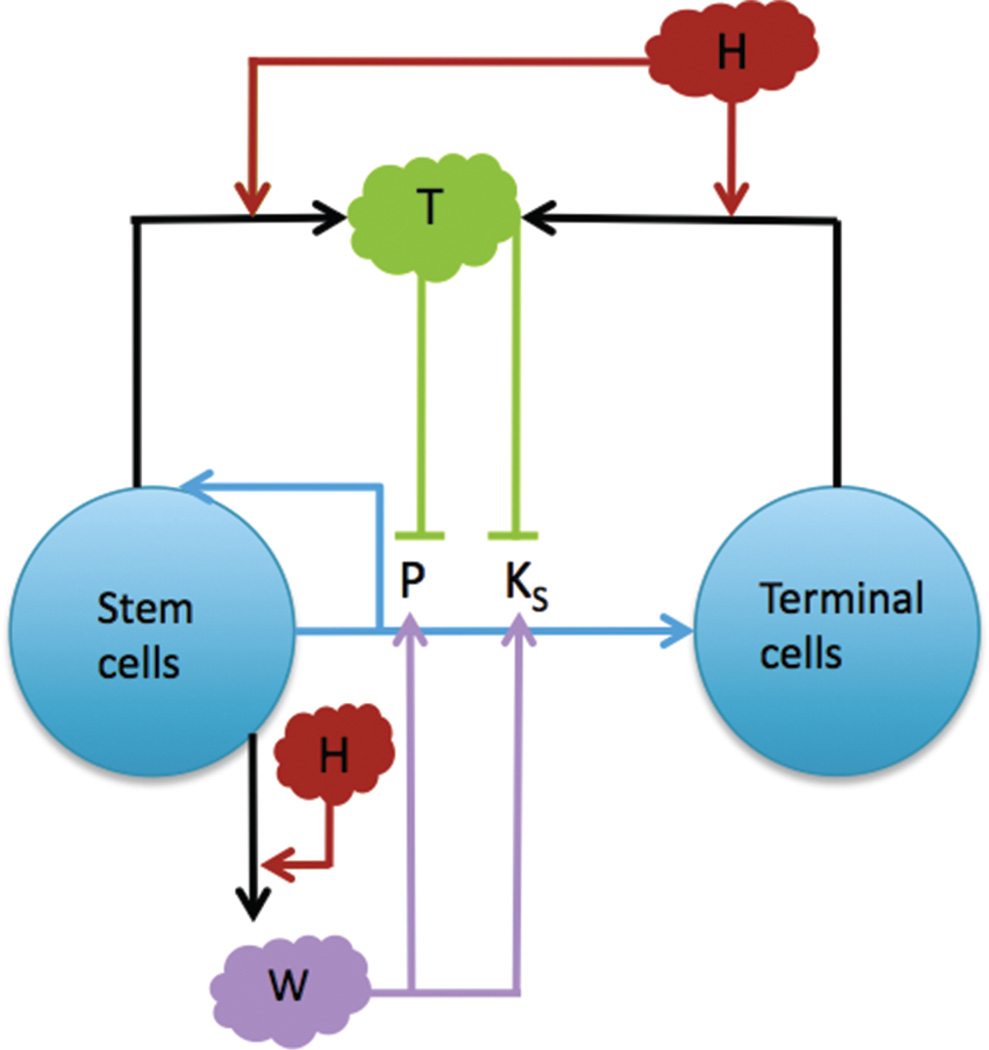
The mathematical model is specific to our experimental system, namely of HGF action on tumor cells, in order to optimize parametrization. Nevertheless, the model is simple enough that it can represent a more general system of a growth factor action on a tissue in a non-monotonic fashion. In this study, we develop a single-scale, spatially homogeneous model of HGF action on a multi-species tumor which consists of a coupled system of nonlinear ordinary differential equations representing changes in stem and terminal cell tumor species, as well as positive regulators (W) and negative regulators of tumor growth (T), as summarized in Figure 1 and discussed in the remainder of the section.
Fig. 1.
A multispecies model of tumor signaling. Tumor tissue is composed of two cell types: cancer stem cells (S), and terminally differentiated cells (TC). Stem cells have a probability of self renewal P, differentiate into TCs with probability 1−P, and divide at a rate KS. P and KS are promoted by W signals produced by the stem cells and inhibited by T, which are produced by S and TCs in response to high H, which represents HGF. H acts by both increasing production of W (at low concentrations) and T (at high concentrations). Adapted from [22], H. Youssefpour, et al.; J. Theor. Biol. 304, 39 (2011). © 2011.
2.1. Tumor Cell Species
We characterize tumor cell dynamics using the cell lineage hypothesis.(21, 22) It has been shown that tumor cells progress through lineage stages where the ability to self-renew is gradually lost.(23, 24) We consider a simplified lineage with cancer stem cell (S) and terminal cell (TC) species that make up the viable fraction of the tumor. Stem cells self-renew, i.e., form new stem cells upon division, with a probability P. We note that in our continuum model, results from asymmetric or symmetric stem cell division are identical, thus we do not make a distinction between these mechanisms of self-renewal. Change in species concentration is a function of the fraction of daughter cells that either remain after division (2P −1) in the case of stem cells, with the factor of ‘2’ accounting for the production of two daughter cells from each parent cell at each cell division, or the fraction of cells that differentiate, 2(1−P), in the case of terminal cells, and the cell division rate of each species,
| (1) |
| (2) |
where KS, TC are the stem and differentiated cell division rates, respectively. We discuss the dependence of KS on various growth factors below, and assume KTC to be constant, since terminal cells have less variable and lower division rates than CSCs.(25) We set KTC = 0.1, as it falls below the lowest observed CCIC division rate of 0.13, which was observed in a mixed (i.e., CSC and TC) population of CCICs.(19) Moreover, we assume that nutrient and oxygen concentrations are not limiting, which is applicable to an experimental cell culture system with proper media, and hence necrosis and apoptosis are negligible.
2.2. Stem Cell Self-Renewal Rate and Division Rate
It has been shown that microenvironmental feedback on self-renewal in a tissue cell lineage is necessary for robust control of lineage progression.(21) Current data shows that elements of such a control system are also present in cancer cell lineages, although often in a dysregulated manner. Indeed, the Wnt/β-catenin system, which involves stem cell-produced glycoproteins from the Wnt family which cause nuclear translocation and activation of transcription factor β-catenin, and is associated with increased cell proliferation and self-renewal in normal tissues, has been shown to be overactivated in several types of tumors, including glioma, meduloblastoma, colon cancer, and hepatocellular carcinoma.(26–28) These factors are represented by W in the model. Moreover, it has been shown across several tissues and in both normal and early cancerous tissue that growth factors, most notably those from the TGFβ superfamily, are produced that feedback on to the stem cells to reduce rates of cell proliferation and self-renewal.(29–31) We model the effect of this class of factors using T. Hence, P and KS are modeled as follows,
| (3) |
| (4) |
| (5) |
where Pmin and Pmax are minimum and maximum rates of self-renewal, respectively, and KSmin and KSmax are the minimum and maximum rates of stem cell division, respectively. The functions MP and MKS represent the feedback of W and T on P and KS, respectively. We set Pmin = 0.2 and Pmax = 1.0 to represent the possible extremes of P, and KSmin = 0.1 and KSmax = 1.0 as we have found that CCICs have division rates of approximately 0.15 to 0.5 in culture.(19) The upper limit is set to 1.0 since our findings were based on growth rates of CCICs that may have been differentiating, hence the division rates of the stem cells would have to be slightly greater than the aggregated division rate. ξP, KS represent the positive effect of W on P and KS, respectively, and ψP, KS represent the inhibitory effect of T on P and KS, respectively. We set ξP = 1.0 and ψP = 0.5. These values were derived by Youssefpour et al. in a model of this system that includes, in addition to Eqs. (1)–(5), generalized diffusion and convection terms for the cell species.(22) We set ξKS = 0.01 and ΦKS = 0.5, which were derived using an extension of the Youssefpour model to parametrize growing CCICs in culture.(19)
2.3. Growth Factor Concentration
A hallmark of colorectal cancer is disruption and over-activation of the Wnt/β-catenin signaling pathway, often through inactivation of the cytoplasmic β-catenin binding protein APC, or through activating mutations in β-catenin itself.(32) Moreover, it has been shown that several distinct downstream factors of the β-Catenin signal, including Phospholipase D and BMI1, act as activators of the Wnt/β-catenin pathway, creating a positive feedback loop that is nonlinear due to the multiple feedback mechanisms on the pathway.(33–35) We model this aspect of the W auto regulation using a modified Michaelis–Menten equation, in order to account for signal saturation. Additionally, HGF, acting through its CSC-expressed cognate receptor c-Met, results in translocation of β-catenin to the nucleus, and hence also potentiates Wnt signal. Moreover, as discussed in the introduction, there is evidence that HGF also acts on T at high concentrations,(10, 20) although the mechanism by which it does so is currently unknown. Therefore, we model changes to W and T as follows,
| (6) |
| (7) |
where sλH represents the feedback response of W on H, λPW1 is the strength of the autocrine positive feedback response of W, λPW2 is the Michaelis–Menton constant for W, νDW, DT are the decay rates for W and T, respectively, and gi (H) is the positive feedback function of H on T, which becomes increasingly nonlinear with increasing i (see below). λH, λPW1, and λPW2 are estimated to fit a maximum peak of the dose response curve to approximately 1000%. The value of 1000% is derived from the following observation: in the original experiments with CCICs, the observed maximum growth rate was found to be approximately 2000%,(19) but we have found that this growth rate was dependent on initial spheroid size, and when normalized for average spheroid size, the predicted maximum growth rate is approximately 1000% (unpublished observations). Currently, in vitro decay rates for W and T are unavailable, and hence we set, as a first approximation, νDW = νDT = 1.0 and note that since calculation of λH, λPW1, 2 are dependent on ambient W and T, a change in νDW or νDT would necessitate a change in λH and λPW1, 2 to match the tumor growth rate, hence the output in S and TC would be similar to the results for νDW = νDT = 1.0.
The effect of H on T is modeled using three different functions, each which differ by (1) the degree of the nonlinearity of H and (2) the modulating factor, which is set to allow the maximum peak growth to be similar between the different functions. We note that, in nature, i need not be an integer, but nevertheless, as i increases, we will show that the post-peak curvature of the dose-response curve will increase, hence while it may not be possible to determine the specific i of the growth factor from the dose-response curve alone, it will be possible to determine the qualitative degree of nonlinearity of action of the negative growth regulator. Therefore, our choice of i act as representative values of the (non-)linear effect of the negative growth regulator. For this study, we set g1(H) = 5−3H, g2(H) = 3−4H2, and g3(H) = 2−5H3. We summarize all parameter values in Table I.
Table I.
| Parameter | Description | Value |
|---|---|---|
| KTC | TC mitosis rate | 0.1 |
| Pmin | Min. CSC self-renewal rate | 0.2 |
| Pmax | Max. CSC self-renewal rate | 1.0 |
| KSmin | Min. CSC mitosis rate | 0.1 |
| KSmax | Max. CSC mitosis rate | 1.0 |
| ξP | Pos. feedback response of P | 1.0 |
| ψP | Neg. feedback response of P | 0.5 |
| ξKS | Pos. feedback response of KS | 0.01 |
| ψKS | Neg. feedback response of KS | 0.5 |
| λPW1 | Pos. feedback response of W | 1 |
| λPW2 | M–M constant for W | 1 |
| λH | H feedback response of W | 2 |
| νD(W, T) | Decay rates for W and T, respectively | 1 |
2.4. Quasi-Steady State Growth Factor Concentration
In order to analyze the dynamics, we reduced the system by assuming quasi-steady state concentrations for W and T. Setting the time derivatives to 0 in Eqs. (6) and (7) allowed us to solve for W in terms of S and H, and for T in terms of H, S and TC. In the case of W, we obtained the cubic function 0 = − W3 +W2S(2H +1) − W +2H, and in the case of T, we have 0 = g(H)(CS +TC) − T. The real solution to the first equation was calculated using the MATLAB symbolic solver,
| (8) |
For the second equation, we obtain:
| (9) |
3. RESULTS
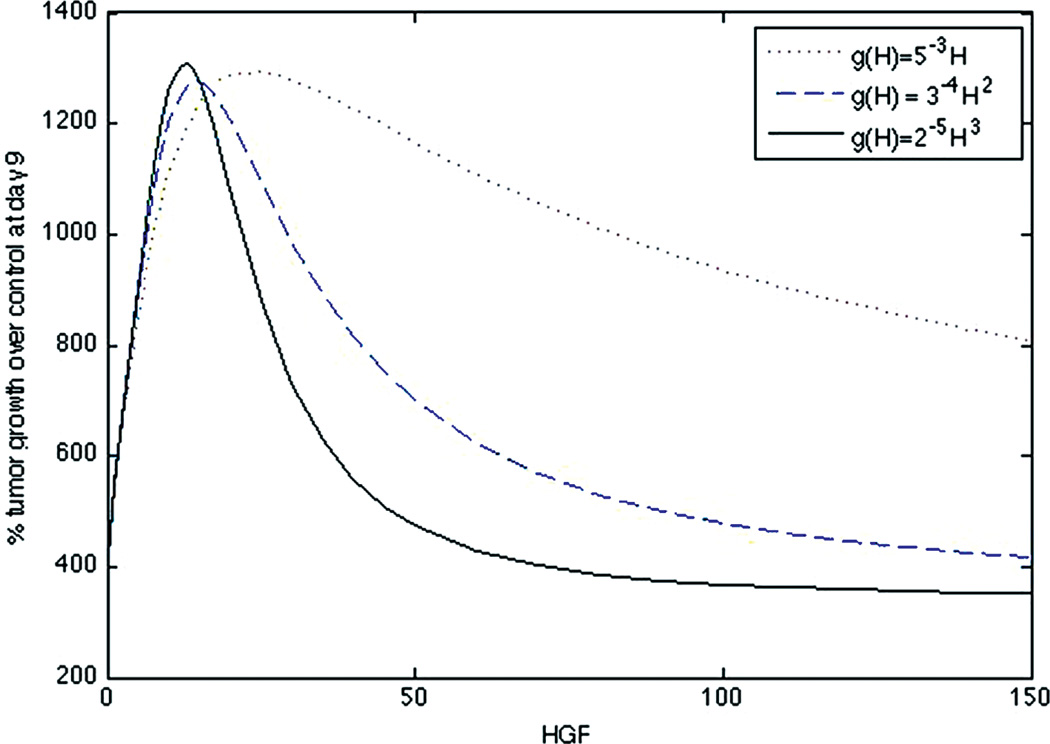
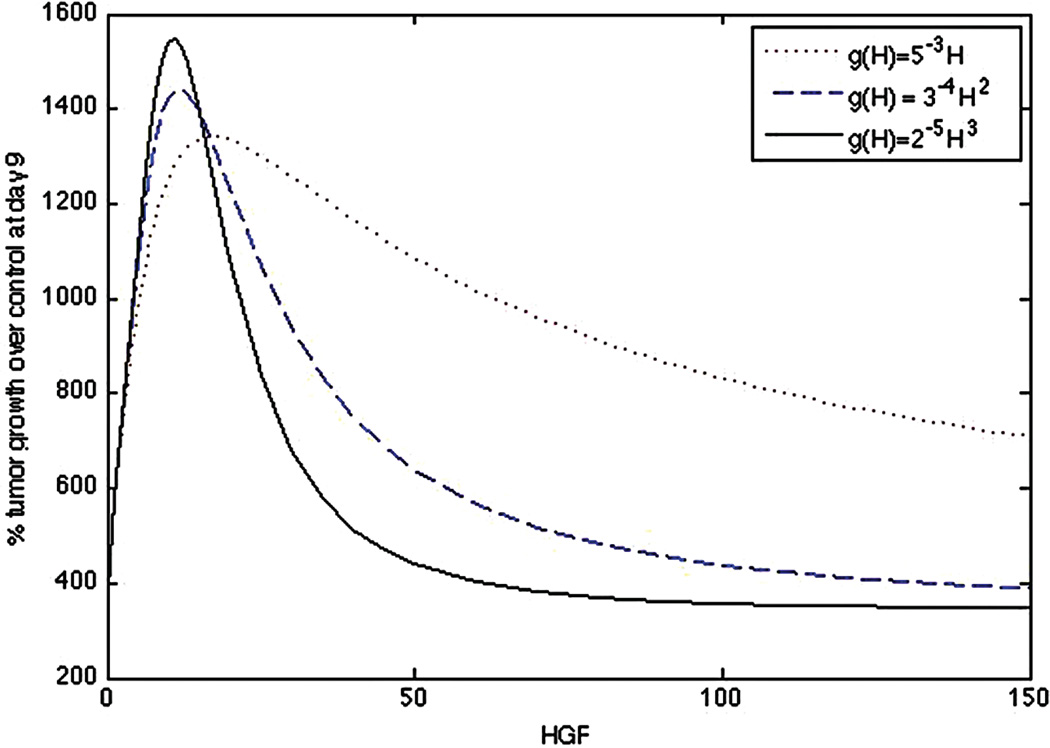
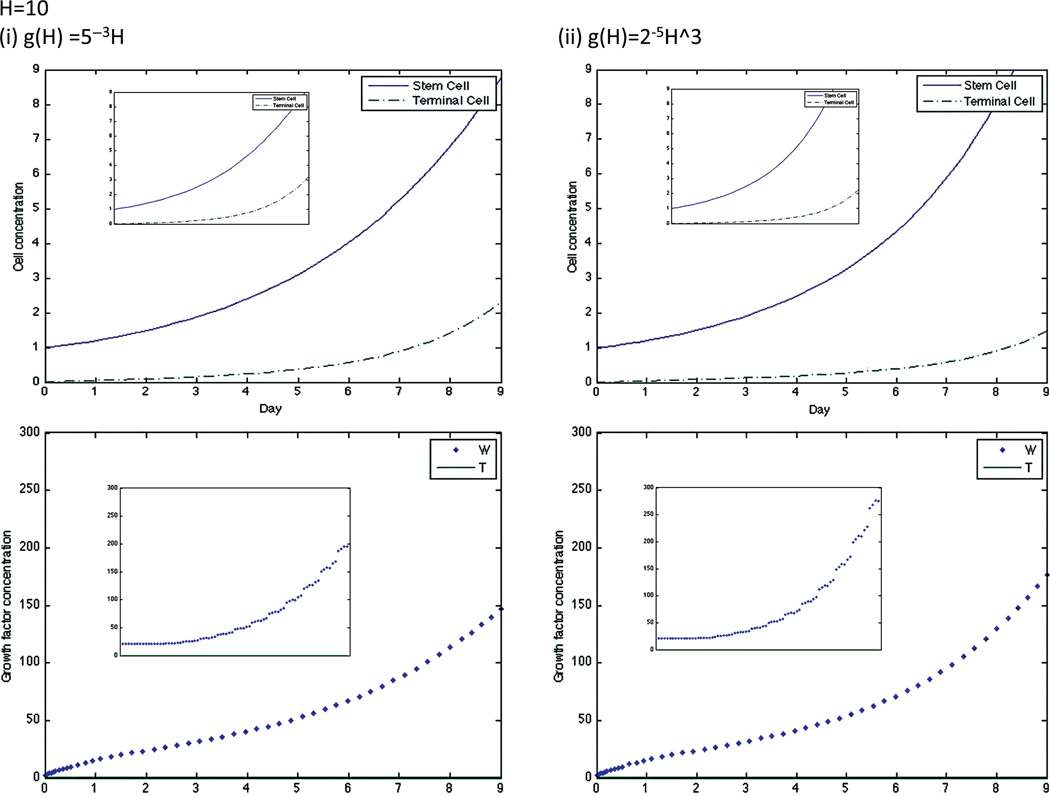
The equations were numerically solved in MATLAB using MATLAB’s standard solver for ordinary differential equations, ode45. Initial conditions were set to model a CCIC culture system. Since CCICs are composed of stem cells derived from primary colon tumors,(17) we set S = 1 and TC = 0, where 1 simulation cell corresponds to 10 biological cells, which is the average number of cells initially in each experiment.(19) Since stem cells produce W but not T, we set 2.0=W ≫ T =0.01 as initial conditions, with units for all growth factors in ng/ml. We chose the specific value of 2.0 for W as double to the decay rate so that it does not artificially decay to zero, and 0.01 for T to account for any background levels of the growth factor. The simulation was run over various H values (H is assumed to be constant throughout the simulation). The simulation was run from t = 0 to t = 9, where t represents the number of days of the simulation. The dose-response curve for % tumor growth at day 9 in increasing concentrations of HGF for the full system is found in Figure 2 and for the quasi-steady state system in Figure 3. Note that growth curves for the original and quasi-steady state model are not identical, indeed at very low, but non-zero, concentrations of H, the curve for nonlinear g overestimates cellular growth. This is because if g(H) = 2−5H3, then T = g(H)(S+TC) is very small at low H, and its effect is negligible on P and Ks, resulting in increased growth and proliferation of stem cells, and thus rapid production of W (Fig. 4 (ii)), therefore the assumption that W is in a quasi-steady state at this concentration of H is not accurate.
Fig. 2.
Dose-response curve of original system (Eqs. (1)–(7)) for a linear g(H) = 5−3H, quadratic g(H) = 3−4H2, and cubic g(H) = 2−5H3.
Fig. 3.
Dose-response curve of quasi-steady state system (Eqs. (1)– (5), (8), (9)) for a linear g(H) = 5−3H, quadratic g(H) = 3−4H2, and cubic g(H) = 2−5H3.
Fig. 4.
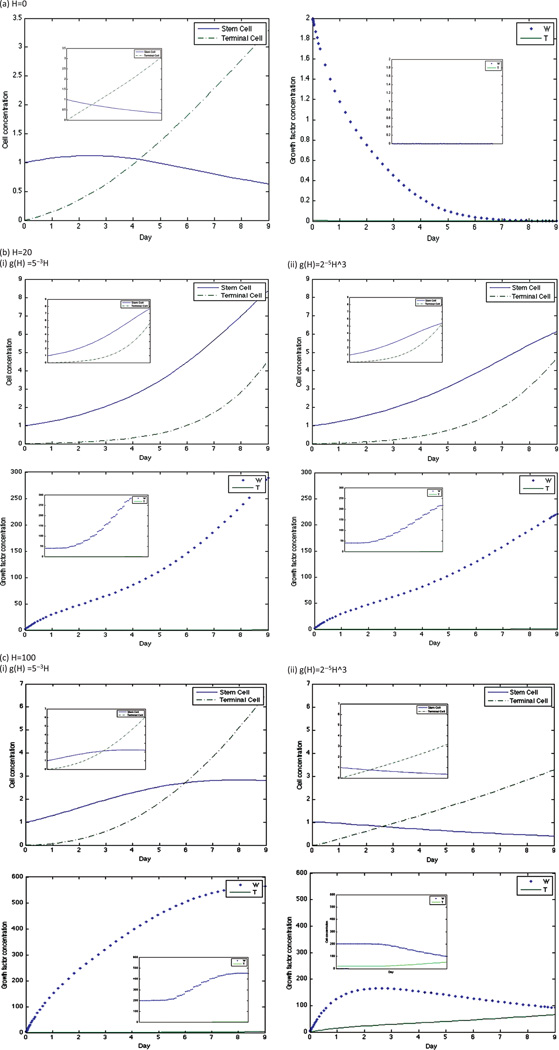
Dynamics of stem cell, terminal cell, W, and T concentrations in the original model for linear and cubic g and at H = 10. The graph insets for each simulation are the dynamics of the same factor in the quasi-steady state model.
Nevertheless, the stem cell, terminal cell, W, and T dynamics are very similar between the two models at both H = 0 and higher values of H (Fig. 5). The peak of both curves occurs at approximately H = 20, and at this HGF concentration, stem cell concentrations increase throughout the simulation in both models. Therefore, since our analysis is concentrated on curve behavior in control conditions and after the growth peak is attained, we assume that the quasi-steady state system provides a good approximation of the cell numbers.
Fig. 5.
Dynamics of stem cell, terminal cell, W, and T concentrations in the original model for linear and cubic g and at concentrations of (a) H =0, (b) H = 20, and (c) H = 100. The graph insets for each simulation are the dynamics of the same factor in the quasi-steady state model.
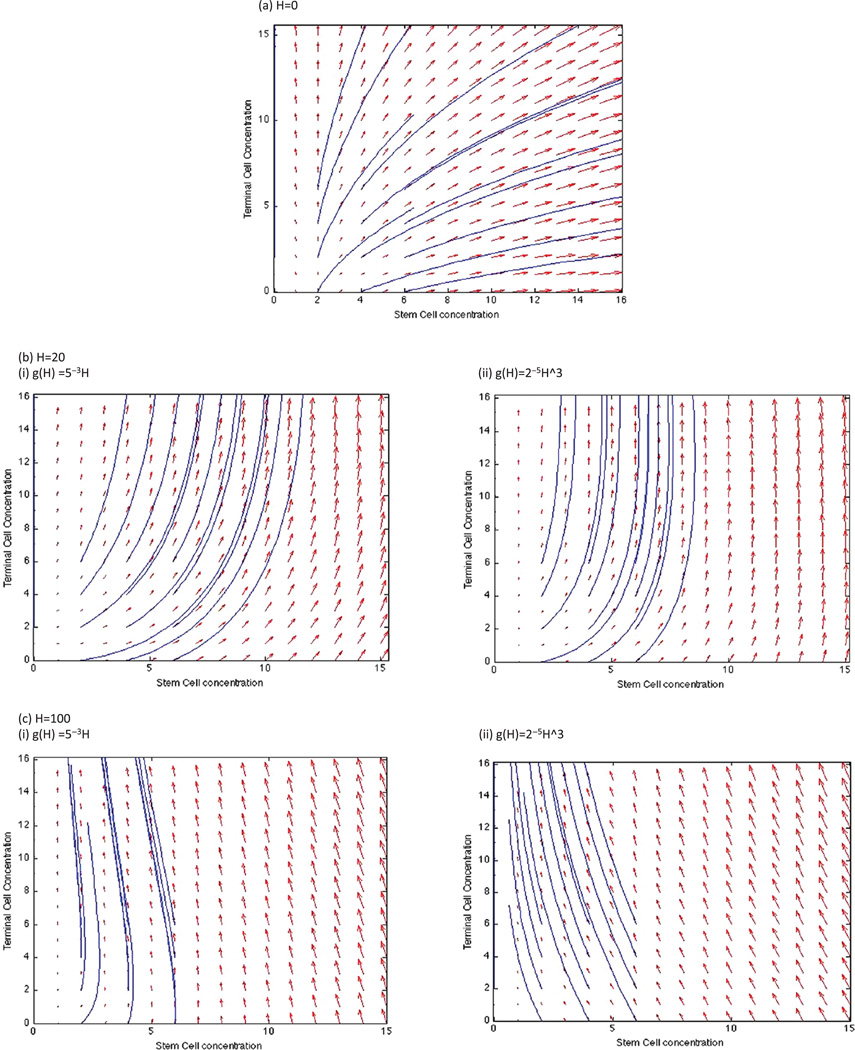
A phase plane analysis of stem and terminal cell dynamics shows that at a concentration of H = 100, stem cell concentrations tend to 0 over time while terminal cell concentrations increase, whereas at H = 20, both stem and terminal cell concentrations increase independent of initial conditions (Figs. 6(b), (c)). Interestingly, there is a divergence of stem cell response for H = 0, at initial concentrations of less than 2, the stem cell concentration tends to 0, whereas at higher initial concentrations, stem cell concentrations also increase over time. This occurs due to a higher production of W at the initial time points that potentiates the stem cell populations. Therefore, if initial concentrations of stem cells is high, the growth peak would move left on the dose-response curve due to the increase in stem cell growth.
Fig. 6.
Phase planes of stem and terminal cell dynamics for the quasi-steady state system at (a) H = 0, (b) H = 20, with linear and cubic g(H), and (c) H = 100, with linear and cubic g(H). Solutions are plotted for initial conditions ranging from 0–6 stem and terminal cells (each).
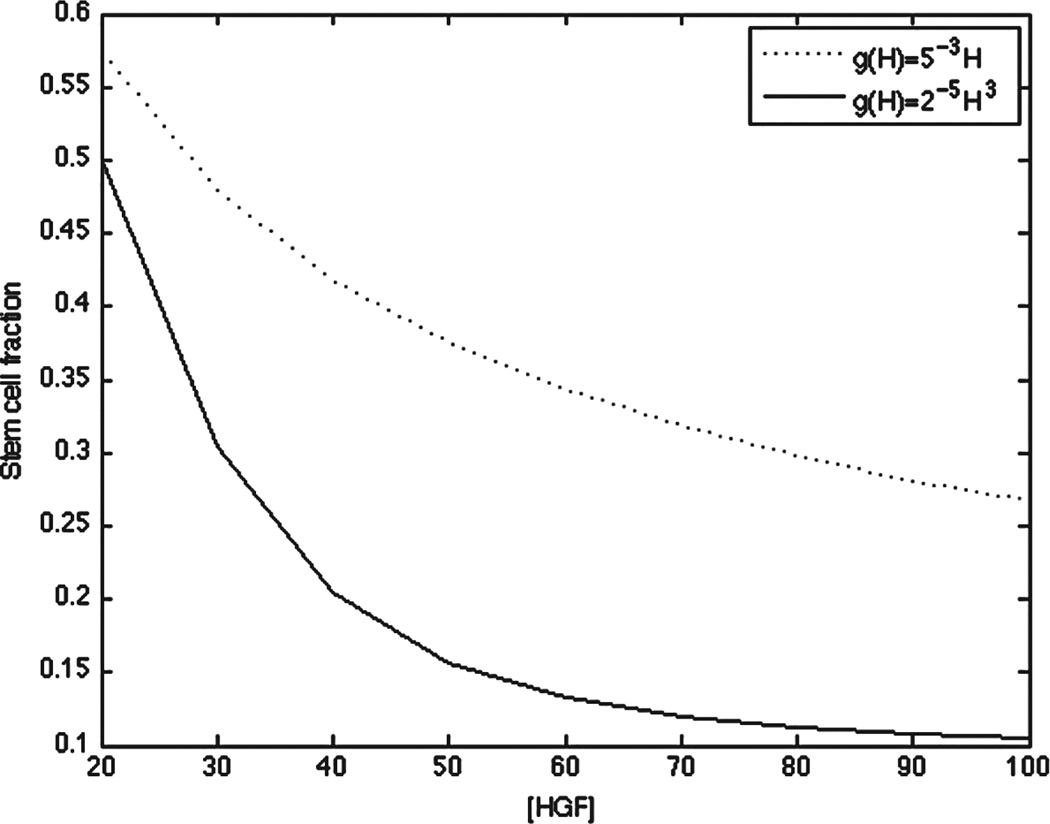
To investigate whether a different choice of g resulted in different relative fractions of stem versus terminal cells at concentrations of H after the peak growth phase, we plotted the stem cell fraction at linear and cubic g at the final time point over concentrations of H ranging from 20–100. Indeed, a cubic g resulted in a nonlinear decrease in stem cell fraction after the peak growth phase, whereas a linear g resulted in a more linear decrease in the stem cell fraction, consistent with the the action of T on stem cell self-renewal (Fig. 7).
Fig. 7.
Stem cell fraction at t = 9 and 20 ≤ H ≤ 100 for the quasisteady state system at linear and cubic g(H).
4. DISCUSSION
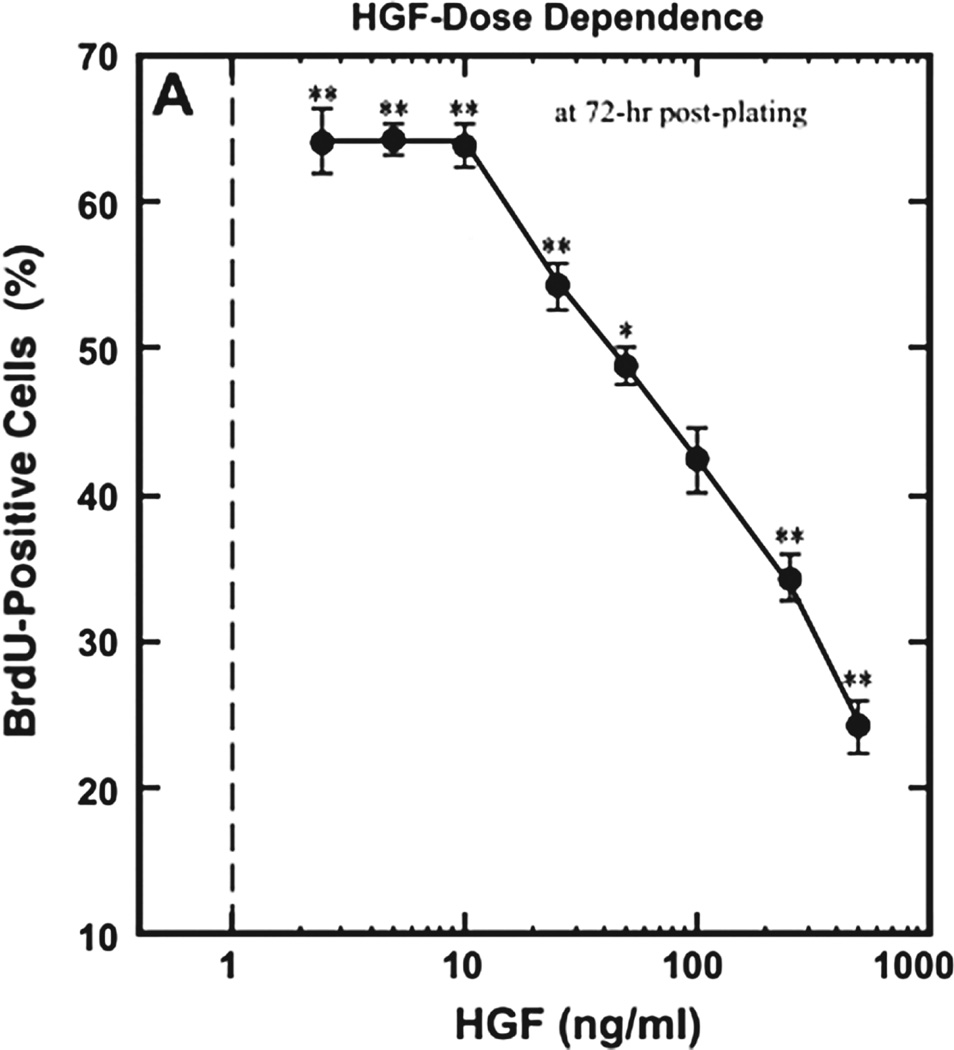
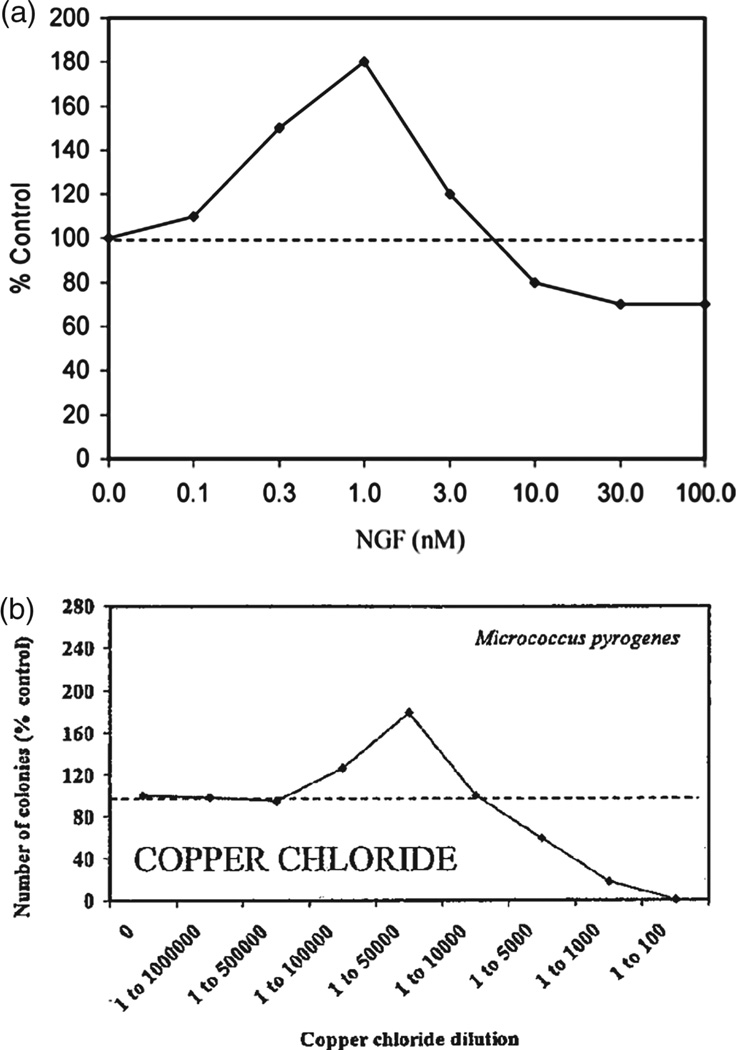
In this study, we analyze the relationship between the mechanism of growth factor-mediated activation of a growth inhibitor at high concentrations and the shape of a biphasic dose-response curve of tissue growth in response to increasing concentrations of growth factor. Since the molecular nature of the inhibitor activation is often unknown, the shape of an experimental growth curve can serve as an aid in generating hypotheses of growth factor action. For example, if the curve post-peak segment (CPPS) displays low curvature (i.e., is near linear), then most likely there is no synergy of inhibitor activation by the growth factor. For example, in the Yamada et al. study on HGF effect on muscle satellite cell proliferation, the CPPS is linear (Fig. 8). Therefore, we hypothesize that either HGF acts via biphasic activation of c-Met, or via a low-affinity growth receptor to stimulate myostatin production. On the other hand, if the CPPS shows high curvature, then we hypothesize that the growth factor increases expression of the growth inhibitor in a non-linear fashion. Experimental examples of such growth curves include NGF action on neurite outgrowth and copper chloride action on bacterial colony formation (Fig. 9). In biological signaling, a nonlinear signal is often indicative of activation of multiple downstream effectors.(36, 38) Hence, a nonlinear CPPS may be indicative of pleiotropic action of the growth factor on growth inhibition.
Fig. 8.
Example of a linear dose-response curve: BrdU, a thymidine analogue, is incorporated into newly synthesized DNA of replicating cells, and can be detected using anti-BrdU antibodies. Hence, it acts as a marker of cell proliferation. The dose-response curve of BrdU uptake by satellite muscle cells in response to increasing HGF shows a linear post-peak decline in BrdU-positive cells with increasing HGF. Reprinted with permission from [10], M. Yamada, et al.; Am. J. Physiol. Cell Physiol. 298, C465 (2010). © 2010, American Physiological Society.
Fig. 9.
Examples of non-linear dose-response curves, (a) effect of NGF on neuronal outgrowth in dorsal root ganglion neurons of rat lumbar region. Reprinted with permission from [3], E. J. Calabrese; Crit. Rev. Toxicol. 38, 391 (2008). © 2008, Informa Healthcare, (b) effect of copper chloride on growth of Micrococcus Pyrogenes bacterial cultures. Reprinted with permission from [39], E. J. Calabrese and L. A. Baldwin; Crit. Rev. Toxicol. 31, 353 (2001). © 2001, Informa Healthcare.
Moreover, we also show that nonlinear activation of an inhibitor results in a nonlinear decline in the stem cell fraction in the cell population with increasing H after the peak growth concentration (Fig. 7). Experimental establishment of this relationship requires use of a CSC marker such as CD133, which is specific to colon CSCs,(40) and can serve to provide evidence that the growth antagonist acts on P and KS, hence further substantiating details of the mathematical model. Additionally, use of a CSC marker can give insight into the predictions of the phase plane analysis, specifically that peak growth is dependent on the steady state of CSCs: peak growth occurs at H concentration where CSC populations increase during the entire time course of the experiments (i.e., do not tend towards the alternative steady state of 0) (Fig. 6). A simplification of the current model to make it amenable to analytical analysis may also be used to confirm the stability results.
5. CONCLUSIONS
Our simple model of HGF action on cell proliferation in a multi-species colon cancer models serves to establish the hypothesis that a shape analysis of a dose-response curve can inform molecular mechanism of growth factor action. Moreover, the model can be extended to include different hypotheses on activator induction by the growth factor, or in cases where the growth curve is monotonic, the shape analysis can be performed on the pre-peak curve segment or the entire curve, respectively. Generation of experimental dose-response curves and subsequent curve shape analysis using a system where the molecular mechanism of action of a growth factor on the phenotypic output is known can be used to test the model predictions.
Acknowledgments
The authors gratefully acknowledge support from the National Institutes of Health through grant P50GM076516 for a Center of Excellence in Systems Biology at the University of California, Irvine, as well as support from the National Cancer Institute of the National Institutes of Health under Award Number p30CA062203. John S. Lowengrub also acknowledges partial support from the National Science Foundation, Division of Mathematical Sciences. Anna Konstorum gratefully acknowledges support from predoctoral Training Grant T32HD060555 from the Eunice Kennedy Shriver National Institute of Child Health and Human Development (NIH/NICHD). The authors also gratefully acknowledge the reviewers for their helpful suggestions to improve the manuscript.
References and Notes
- 1.Calabrese EJ. Environ. Pollut. 2005;138:378. doi: 10.1016/j.envpol.2004.10.001. [DOI] [PubMed] [Google Scholar]
- 2.Saunier EF, Akhurst RJ. Curr. Cancer Drug Targets. 2006;6:565. doi: 10.2174/156800906778742460. [DOI] [PubMed] [Google Scholar]
- 3.Calabrese EJ. Crit. Rev. Toxicol. 2008;38:391. doi: 10.1080/10408440801981981. [DOI] [PubMed] [Google Scholar]
- 4.Zhang L, Jiang H, Hu Z. Stem Cells Dev. 2011;20:1723. doi: 10.1089/scd.2010.0370. [DOI] [PubMed] [Google Scholar]
- 5.Hol EM, Gispen WH, Bar PR. Peptides. 1995;16:979. doi: 10.1016/0196-9781(95)00017-e. [DOI] [PubMed] [Google Scholar]
- 6.Krall JA, Beyer EM, MacBeath G. PLoS One. 2011;6:e15945. doi: 10.1371/journal.pone.0015945. [DOI] [PMC free article] [PubMed] [Google Scholar]
- 7.Xu X, Thomas ML. Endocrine. 1995;3:661. doi: 10.1007/BF02746342. [DOI] [PubMed] [Google Scholar]
- 8.Calabrese EJ. Crit. Rev. Toxicol. 2013;43:580. doi: 10.3109/10408444.2013.808172. [DOI] [PubMed] [Google Scholar]
- 9.Sondell M, Lundborg G, Kanje M. J Neurosci. 1999;19:5731. doi: 10.1523/JNEUROSCI.19-14-05731.1999. [DOI] [PMC free article] [PubMed] [Google Scholar]
- 10.Yamada M, Tatsumi R, Yamanouchi K, Hosoyama T, Shiratsuchi S, Sato A, Mizunoya W, Ikeuchi Y, Furuse M, Allen RE. Am. J. Physiol. Cell Physiol. 2010;298:C465. doi: 10.1152/ajpcell.00449.2009. [DOI] [PMC free article] [PubMed] [Google Scholar]
- 11.Sheehan SM, Tatsumi R, Temm-Grove CJ, Allen RE. Muscle Nerve. 2000;23:239. doi: 10.1002/(sici)1097-4598(200002)23:2<239::aid-mus15>3.0.co;2-u. [DOI] [PubMed] [Google Scholar]
- 12.Suzuki S, Yamanouchi K, Soeta C, Katakai Y, Harada R, Naito K, Tojo H. Biochem. Biophys. Res. Commun. 2002;292:709. doi: 10.1006/bbrc.2002.6706. [DOI] [PubMed] [Google Scholar]
- 13.Li J, Reed SA, Johnson SE. Exp. Cell Res. 2009;315:2284. doi: 10.1016/j.yexcr.2009.04.011. [DOI] [PMC free article] [PubMed] [Google Scholar]
- 14.Tatsumi R, Hattori A, Ikeuchi Y, Anderson JE, Allen RE. Mol. Biol. Cell. 2002;13 doi: 10.1091/mbc.E02-01-0062. [DOI] [PMC free article] [PubMed] [Google Scholar]
- 15.Banumathy G, Cairns P. Cancer Biol. There. 2010;10:658. doi: 10.4161/cbt.10.7.13247. [DOI] [PMC free article] [PubMed] [Google Scholar]
- 16.Tatsumi R, Sankoda Y, Anderson JE, Sato Y, Mizunoya W, Shimizu N, Suzuki T, Yamada M, Rhoads RP, Jr, Ikeuchi Y, Alle RE. Am. J. Physiol. Cell Physiol. 2009;297:C238. doi: 10.1152/ajpcell.00161.2009. [DOI] [PubMed] [Google Scholar]
- 17.Ricci-Vitiani L, Lombardi DG, Pilozzi E, Biffoni M, Todaro M, Peschle C, De Maria R. Nature. 2007;445:1111. doi: 10.1038/nature05384. [DOI] [PubMed] [Google Scholar]
- 18.Shaheen SS, Pate KT, Anderson S, Dizon D, Edwards RA, Waterman ML, Lipkin SM. Cancer Res. 2010;70:1469. doi: 10.1158/0008-5472.CAN-09-2557. [DOI] [PMC free article] [PubMed] [Google Scholar]
- 19.Konstorum A, Sprowl SA, Lander AD, Waterman ML, Lowengrub JS. Proc. ICAND. 2014;2012:295. [Google Scholar]
- 20.Michalopoulos GK, Bowen WC, Mule K, Luo J. Gene Expr. 2003;11:55. doi: 10.3727/000000003108748964. [DOI] [PMC free article] [PubMed] [Google Scholar]
- 21.Lander AD, Gokoffski KK, Wan FY, Nie Q, Calof AL. PLoS Biol. 2009;7:e15. doi: 10.1371/journal.pbio.1000015. [DOI] [PMC free article] [PubMed] [Google Scholar]
- 22.Youssefpour H, Li X, Lander AD, Lowengrub JS. J. Theor. Biol. 2011;304:39. doi: 10.1016/j.jtbi.2012.02.030. [DOI] [PMC free article] [PubMed] [Google Scholar]
- 23.Reya T, Morrison SJ, Clarke MF, Weissman IL. Nature. 2001;414:105. doi: 10.1038/35102167. [DOI] [PubMed] [Google Scholar]
- 24.Blainpain C, Simons BD. Nat. Rev. Mol. Cell Biol. 2013;14:489. doi: 10.1038/nrm3625. [DOI] [PubMed] [Google Scholar]
- 25.Yamashita T, Wang XW. Clin Invest. 2013;123:1911. doi: 10.1172/JCI66024. [DOI] [PMC free article] [PubMed] [Google Scholar]
- 26.Gong A, Huang S. Cancer Res. 2012;72:5658. doi: 10.1158/0008-5472.CAN-12-0953. [DOI] [PMC free article] [PubMed] [Google Scholar]
- 27.Anastas JN, Moon RT. Nat Rev. Cancer. 2013;13:11. doi: 10.1038/nrc3419. [DOI] [PubMed] [Google Scholar]
- 28.Holland JD, Klaus A, Garratt AN, Birchmeier W. Curr. Opin Cell Biol. 2013;25:254. doi: 10.1016/j.ceb.2013.01.004. [DOI] [PubMed] [Google Scholar]
- 29.Haramis AP, Begthel H, van den Born M, van Es J, Jonkheer S, Offerhaus GJ, Clevers H. Science. 2004;303:1684. doi: 10.1126/science.1093587. [DOI] [PubMed] [Google Scholar]
- 30.Skeen VR, Paterson I, Paraskeva C, Williams AC. Curr. Pharm Des. 2012;18:3874. doi: 10.2174/138161212802083734. [DOI] [PubMed] [Google Scholar]
- 31.Massague J. Cell. 2012;134:215. [Google Scholar]
- 32.Pinto D, Clevers H. Biol. Cell. 2005;97:185. doi: 10.1042/BC20040094. [DOI] [PubMed] [Google Scholar]
- 33.Kang DW, Lee SH, Yoon JW, Park WS, Choi KY, Min Do S. Cancer Res. 2010;70:4233. doi: 10.1158/0008-5472.CAN-09-3470. [DOI] [PubMed] [Google Scholar]
- 34.Kim D, Rath O, Kolch W, Cho KH. Oncogene. 2007;26:4571. doi: 10.1038/sj.onc.1210230. [DOI] [PubMed] [Google Scholar]
- 35.Cho JH, Dimri M, Dimri GP. J. Biol. Chem. 2012;288:3406. doi: 10.1074/jbc.M112.422931. [DOI] [PMC free article] [PubMed] [Google Scholar]
- 36.Bottinger EP, Bitzer M. J. Am. Soc. Nephrol. 2002;13:2600. doi: 10.1097/01.asn.0000033611.79556.ae. [DOI] [PubMed] [Google Scholar]
- 37.van Amerongen R, Nusse R. Development. 2009;136:3205. doi: 10.1242/dev.033910. [DOI] [PubMed] [Google Scholar]
- 38.Nadji R, Holcombe RF, Waterman ML. J. Carcinog. 2011;10:5. doi: 10.4103/1477-3163.78111. [DOI] [PMC free article] [PubMed] [Google Scholar]
- 39.Calabrese EJ, Baldwin LA. Crit. Rev. Toxicol. 2001;31:353. doi: 10.1080/20014091111730. [DOI] [PubMed] [Google Scholar]
- 40.Catalano V, Di Franco S, Lovino F, Dieli F, Stassi G, Todaro M. Expert Opin Ther Targets. 2012;16:259. doi: 10.1517/14728222.2012.667404. [DOI] [PubMed] [Google Scholar]


