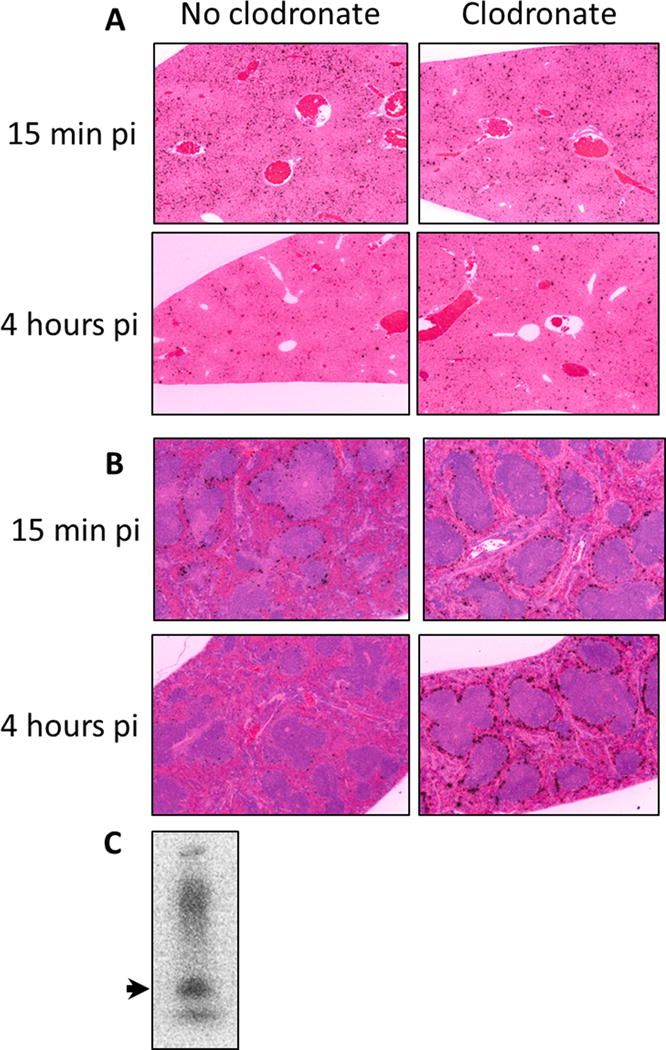
Figure 3.

Microautoradiography of A) liver or B) spleen sections from mice injected with 125I-AEF. Tissues harvested either 15 min or 4 h post-injection were fixed, paraffin embedded and sectioned before dipping slides in autoradiographic emulsion. Slides were developed and counter stained with H&E for tissue visualization (Original magnification 50×). Black silver grains designate sites of 125I decays. Panel C shows the autoradiographic pattern of radioiodinated AEF profile on SDS-PAGE. The arrow points to the mobility of SAA.
