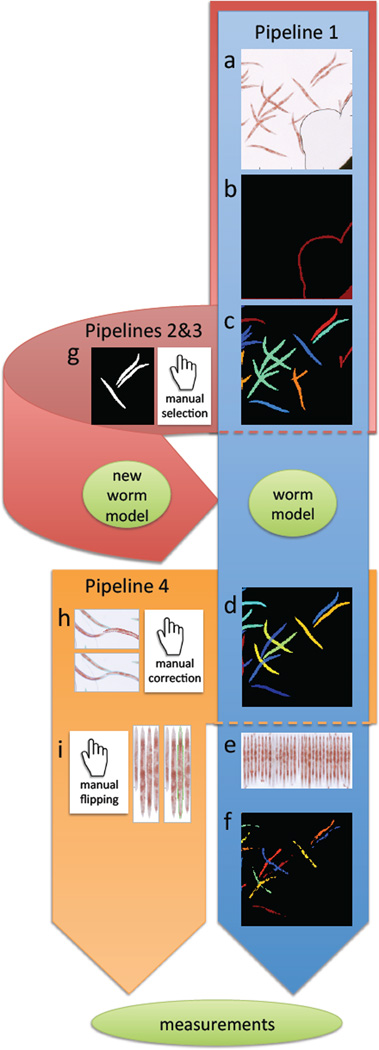
Figure 2.
Overview of image analysis pipelines. Pipeline 1 in the tutorial (blue), is fully automated, and consists of the following steps: a) Load input images from qORO assay (here showing only part of full well for better visualization of worms). b) Pre-process to remove artifacts such as bubbles and well edges. c) Detect worms and clusters of worms. Individual worms/worm clusters are randomly colored. d) Delineate individual worms by model-based worm untangling (this step is called “segmentation”). Here, each individual worm has a unique (and arbitrary) color. e) Digitally straighten worms and align them to a simple worm atlas for measurement of stain distribution. f) Detect fatty regions within worms. Once worms and fatty regions are identified, a large number of measurements are extracted from individual worms, such as the intensity of stain, fat stain distribution, fat region size, worm width, etc. All measurements are exported to a spreadsheet or database for further exploration and analysis. Pipeline 2 and 3: If the provided default worm model does not fit the input data (e.g. due to a different image resolution, worm age range, or different worm strain), a new worm model can be built using the pipelines 2 an 3 in the tutorial (pink) by g) manual selection of non-touching worms that build up a training set for a new model. Pipeline 4: For low-throughput experiments, it is possible to manually curate segmentation results using pipeline 4 in the tutorial (orange) by h) manual editing of the output from step (d) of the blue pipeline to correct errors, and i) manual flipping of digitally straightened worms so that they all align with their heads or tails up (in cases where the orientation of fat within the worm is important for the study). The same set of measurements as described in part (f) above can be extracted from such manually-edited segmentation results.

