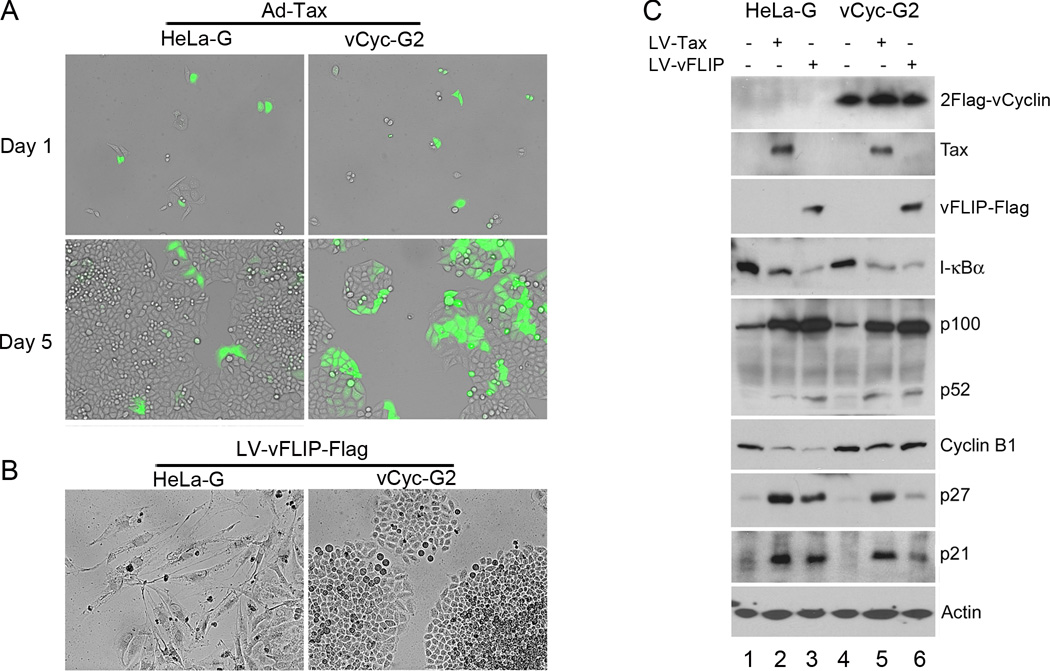
Figure 5. KSHV vCyclin prevents vFLIP- and HTLV-1 Tax-induced G1 arrest/senescence.
(A) Phase contrast and fluorescent photographs of HeLa-G and vCyc-G2 cells transduced with Ad-Tax. Cells were transduced with Ad-Tax at an MOI of 1 to achieve approximately 30–50% transduction, and then plated sparsely as single cells. Photographs were taken at day 1 and day 5 after Ad-Tax transduction as indicated. GFP-positive cells were Ad-Tax-transduced. GFP-negative cells were un-transduced and served as internal controls. (B) Phase contrast photographs of HeLa-G and vCyc-G2 cells transduced with LV-vFLIP-Flag-neo and selected for 6 days with G418. (C) HeLa-G (lanes 1–3) and vCyc-G2 (lanes 4–6) were transduced with LV-neo (lanes 1 and 4), LV-Tax-Neo (Tax, lanes 2 and 5), and LV-vFLIP-Flag-neo (vFLIP, lanes 3 and 6) respectively as in Fig 1. After selection in G418-containing media for 4 days, the transduced cells were harvested and subjected to immunoblot analysis using the indicated antibodies. The relative levels of I-κBα (1; 0.29; 0.14; 1; 0.29; 0.16), p52 (1; 22; 20; 18), cyclin B1 (1; 0.29; 0.16; 1; 0.65; 0.88), p27 (1, 8.3; 6.3; 1; 5.8; 1.5) and p21 (1; 7.2; 6.8; 1; 6.1; 2.2) in each lanes (lanes 1–6) were determined as in Fig. 1B except that the final normalization was against the control lanes 1 (HeLa-G control) and 4 (HeLa-G/vCyc-G2) respectively.

