Abstract
Genetic alterations in human cancers and murine models indicate that Rb and p53 have critical tumor suppressive functions in retinoblastoma, a tumor of neural origin, and neuroendocrine tumors including small cell lung cancer and medullary thyroid cancer (MTC). Rb inactivation is the initiating lesion in retinoblastoma and current models propose that induction of apoptosis is a key p53 tumor suppressive function. Genetic studies in mice, however, indicate that other undefined p53 tumor suppressive functions are operative in vivo. How p53 loss cooperates with Rb inactivation to promote carcinogenesis is also not fully understood. In the current study, genetically engineered mice were generated to determine the role of Rb and p53 in MTC pathogenesis and test the hypothesis that p53 suppresses carcinogenesis by inhibiting mTOR signaling. Conditional Rb ablation resulted in thyroid tumors mimicking human MTC, and additional p53 loss led to rapid tumor progression. p53 suppressed tumorigenesis by inhibiting cell cycle progression, but did not induce apoptosis. On the contrary, p53 loss led to increased apoptosis that had to be overcome for tumor progression. mTOR activity was markedly increased in p53 deficient tumors and rapamycin treatment suppressed tumor cell growth identifying mTOR inhibition as a critical p53 tumor suppressive function. Rapamycin treatment did not result in AKT/MAPK activation providing evidence that this feedback mechanism operative in other cancers is not a general response to mTORC1 inhibition. Together, these studies provide mechanistic links between genetic alterations and aberrant signaling pathways critical in carcinogenesis, and identify essential Rb and p53 tumor suppressive functions in vivo.
Keywords: p53, Rb, medullary thyroid cancer, mTOR
INTRODUCTION
The tumor suppressive pathways centered on p53 and the retinoblastoma (Rb) protein are deregulated in the vast majority of human cancers providing strong evidence that Rb and p53 cooperate to suppress carcinogenesis. p53 mutations are the most common genetic event in human cancer but the critical p53 tumor suppressive functions operative in vivo are still not entirely defined (1). Additionally, how p53 loss cooperates with Rb inactivation to promote carcinogenesis is not fully understood. Activation of p53 occurs in response to a wide variety of stress signals and drives several potential cellular outcomes including cell cycle arrest, senescence, differentiation and apoptosis (2, 3). Current models propose that apoptosis is a key mechanism by which p53 eliminates cancer cells. Challenging this notion is the observation that mice expressing p53 mutant proteins deficient in driving apoptosis are protected from tumor development, indicating that p53 has other in vivo functions critical for suppressing tumorigenesis (4). Studies in cultured cells demonstrate that p53 is capable of inhibiting mTOR signaling to shut down growth of cells under stress, thus identifying mTOR inhibition as a potential novel mechanism by which p53 suppresses cancer (5, 6).
Genetic alterations in human cancers and murine models indicate that Rb and p53 have critical roles in suppressing retinoblastoma, a tumor of neural origin, and the neuroendocrine tumors small cell lung cancers (SCLC) and medullary thyroid cancers (MTC). Rb inactivation is the initiating genetic lesion in human retinoblastoma and p53 suppresses retinoblastoma development in mice (7, 8). Although the p53 gene is intact in human retinoblastomas, molecular studies reveal that the p53 tumor surveillance pathway is activated in human retinogenesis after Rb loss leading to apoptosis and cell cycle exit (7, 8). This p53 dependent response is suppressed during retinoblastoma progression by several mechanisms including CDKN2A gene deletions and increased MDM2 or MDMX expression. Strong evidence supporting cooperative roles for Rb and p53 in suppressing SCLC also exists in both mice and humans. Rb and p53 gene mutations are detected in >80% of human SCLC providing evidence that loss of these tumor suppressors is critical, if not essential, for SCLC development (9). Moreover, persons with Rb germline mutations have a 15 fold increased risk for developing SCLC. In mice, combined Rb and p53 loss targeted to the lung epithelium results in metastatic SCLC (10). Finally, genetic Rb ablation in multiple murine models results in MTC. It remains unclear, however, if p53 cooperates with Rb to suppress MTC pathogenesis (11-13). p53 loss was reported to cooperate with Rb loss in MTC development based upon increased MTC incidence in combined germline Rb+/−/p53+/− as compared to Rb+/− mice (11). In contrast, Williams, et al. reported no additional effect of germline p53 loss on MTC development in Rb+/− mice (13). Genetic backgrounds were similar in the two studies and therefore strain does not account for the differing results.
MTC are aggressive radiation and chemotherapy resistant neuroendocrine tumors (14-17). Surgery offers the only curative approach and no effective therapy exists for distant metastatic disease. The observed poor outcomes in this disease are thus largely due to frequent presentation with metastatic disease and persistent or relapsing disease after surgery (15, 16). The tyrosine kinase inhibitor, vandetanib, was recently shown to prolong progression free survival in progressive MTC (18). Despite this advancement, no treatment has been shown to improve overall survival, stressing the need for novel therapies. The discovery of vandetanib as an effective targeted therapy provides proof of principle that defining molecular mechanisms driving MTC pathogenesis holds promise for developing effective treatments. Determining cause-effect relationships between genetic alterations and aberrant molecular signaling also hold promise for developing biomarkers and patient stratification algorithms to optimize therapy response.
Germline oncogenic RET mutations occur in nearly all patients with hereditary MTC; however, tumors in these patients are monoclonal suggesting that additional somatic alterations are required to promote tumorigenesis (14). In support of this notion, expression of the frequently detected RET M918T mutation in murine models leads to C-cell hyperplasia but not MTC indicating that RET deregulation is not sufficient for MTC development (19). The secondary events and the genetic alterations promoting sporadic MTC that comprise ~75% of cases remain unknown. The incidence of RET mutations in sporadic MTC varies greatly among reported series leaving the pathogenesis of up to two thirds of cases unclear (14-18, 20). Studies exploring other molecules in the RET signaling cascade have likewise yielded varying mutation rates further highlighting the need to identify causative genetic events in MTC (14, 20-22). Despite the knowledge void in MTC genetics, it is of clinical significance that mTOR signaling is functionally activated in 50-100% of cases (21, 23, 24). Oncogenic RET can induce mTOR activation explaining the positive correlation between RET mutations and mTOR activation in hereditary MTC. mTOR activation however is also detected in sporadic MTC lacking RET mutations indicating alternate, as yet undefined, mechanisms to induce mTOR signaling. In the current study, mouse models were used to demonstrate that Rb and p53 have distinct and cooperative roles in MTC pathogenesis. Mechanistic studies reveal that p53 suppresses MTC progression by inhibiting cell cycle progression and mTOR activation. Surprisingly, p53 loss resulted in increased apoptosis that needed to be overcome for tumor progression. Pharmacological inhibition of mTORC1 signaling decreased MTC cell growth in the absence of feedback AKT or MAPK activation shown to limit rapamycin effectiveness in other cancers (25) providing rationale for exploring mTOR pathway inhibition as a therapeutic strategy for MTC.
RESULTS
Rb ablation targeted to the thyroid results in a uniformly penetrant model of human MTC
A genetically engineered mouse model was developed to target Cre recombinase mediated Rb gene ablation under control of the surfactant protein C (SPC) promoted reverse tetracycline transactivator (Fig. 1a; (26)). Treatment with doxycycline throughout gestation resulted in Rb ablation throughout the lung epithelium as well as in a subset of thymic and thyroid cells, consistent with previous reports (27). Double transgenic mice homozygous for floxed Rb alleles (designated Rb ablated) developed pulmonary neuroendocrine hyperplasia as previously described and uniformly developed thyroid tumors (Fig. 1b, n=29) (26). No thyroid tumors were detected in littermate controls lacking the Cre transgene (designated control; n=11) indicating that Rb loss was required for thyroid tumor initiation. Epithelial cell hyperplasia and/or microscopic nodules were detected in all Rb ablated thyroids analyzed at 4 months of age (n=10) with subsequent growth resulting in tumors with an average maximum dimension of 6.0 mm by 7-10 months of age (n=22; Fig. 2e). The thyroid tumors were phenotypically indistinguishable from human MTC being comprised of malignant cells with fine to moderately coarse nuclear chromatin; a characteristic and diagnostic feature of neuroendocrine tumors (Fig. 1b). The tumors expressed calcitonin similar to that seen in human MTC (Fig. 1b). Rb gene recombination was confirmed demonstrating that the tumors arose from Rb deficient cells (Fig. 1c). These studies demonstrate that Rb loss is sufficient to induce thyroid tumors that phenotypically mimic human MTC. Moreover, the thyroid phenotype is fully penetrant by four months of age making this a valuable model to study Rb mediated tumorigenesis.
Figure 1. Conditional Rb ablation in the thyroid results in medullary thyroid carcinoma (MTC).
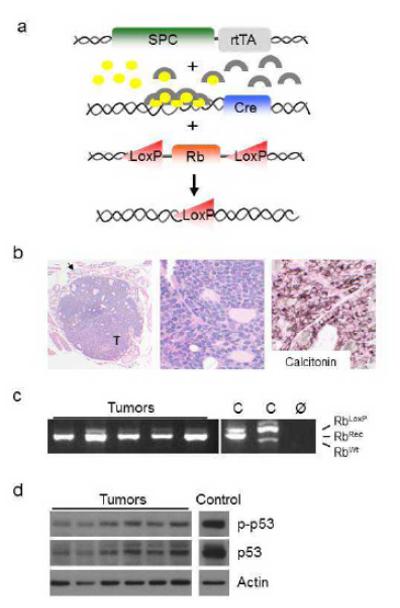
(a) Rb ablation was targeted to the lung and a subset of thyroid cells by generating mice containing 1) the reverse tetracycline transactivator (rtTA) under control of the human surfactant protein C (SPC) promoter, 2) Cre recombinase under control of the tet operator and minimal CMV promoter, and 3) floxed (LoxP) Rb alleles. Doxycycline treatment (circles) activates rtTA (arches) which induces Cre recombinase expression resulting in floxed Rb gene recombination. (b) Mice with conditional Rb ablation developed thyroid tumors (T) that mimic human MTC by morphology (H&E staining) and calcitonin expression as assessed by immunohistochemistry. An arrow indicates normal thyroid tissue surrounding the tumor. Representative images from 8-9 month old Rb ablated mice. (c) Rb recombination (RbRec) was detected in MTC derived DNA by PCR analysis. Floxed (RbLoxP), RbRec and wild type Rb (RbWt) bands are indicated. C and Ø represent positive and negative no DNA controls, respectively. (d) Activated, phosphorylated p53 and total p53 protein were detected in Rb ablated tumors by Western blot analysis. Blots were reprobed for actin as a loading control.
Figure 2. p53 loss promotes Rb deficient MTC progression.
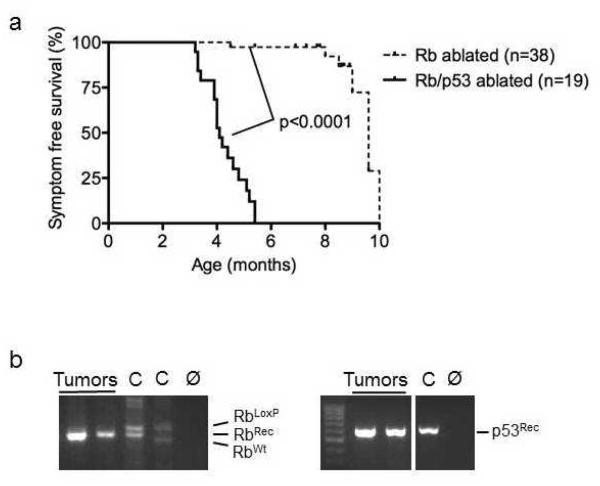
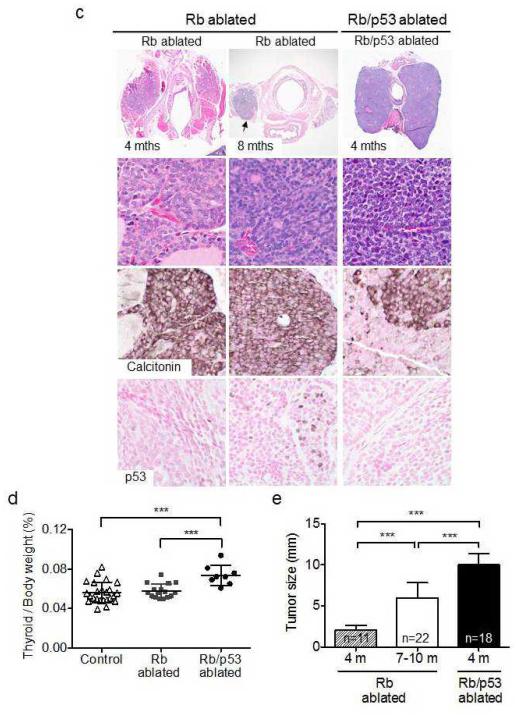
(a) p53 loss was associated with a marked reduction in symptom free survival of Rb ablated mice as indicated by curves showing the percentage of Rb ablated and Rb/p53 ablated mice that had MTC at the time of death, when moribund, or after losing ≥ 10% body weight. Median survival for Rb and Rb/p53 ablated mice was 9.6 and 4.1 months, respectively. (b) Rb (RbRec) and p53 (p53Rec) recombination was detected in MTC derived DNA by PCR analysis. RbLoxP, RbRec. RbWt and p53Rec bands are indicated. C and Ø represent positive and negative no DNA controls, respectively. (c) Mice with combined Rb/p53 ablated thyroids developed tumors similar to that seen after Rb ablation alone. The thyroid tumors mimicked human MTC by morphology (H&E stained low and high power images are shown) and calcitonin expression as assessed by immunohistochemistry. p53 was detected by immunohistochemistry in all Rb ablated tumors tested (n=3 and 16 at 4 and 7-9 months, respectively) with variable numbers of p53 positive cells in individual tumors. No p53 was detected in Rb/p53 ablated tumors (n=5). Arrows indicate tumors. (d) Thyroid to body weight ratios in 9 week old mice were significantly increased after combined Rb/p53 ablation as compared to Rb ablation alone and Rb/p53 proficient controls. (e) Rb/p53 ablated tumors were significantly larger than Rb ablated tumors in mice at 4 months and 7-10 months of age. Data are represented as mean ± SD. ***p<0.001.
p53 loss promotes Rb deficient tumor progression
Activated p53 was detected in Rb deficient thyroid tumors leading to the hypothesis that the oncogenic stimulus induced by Rb loss leads to a p53 response that suppresses carcinoma progression (Figs. 1d and 2c). To directly test this hypothesis, p53 was conditionally ablated in Rb deficient thyroids by generating double transgenic mice with floxed Rb and p53 alleles (designated Rb/p53 ablated). Tumors were detected in 15/16 (93%) Rb/p53 ablated thyroids but not in littermate controls lacking the Cre transgene (n=13). The mice also developed pulmonary neuroendocrine carcinomas (data not shown). p53 ablation in Rb deficient thyroid tumors resulted in dramatic MTC progression and a median survival of 4 months (Fig. 2a, c). The tumor promoting effect of p53 loss was evident by 9 weeks of age (Fig. 2d) with the effect being even more dramatic at 4 months when Rb/p53 deficient thyroids were five times larger than Rb deficient thyroids (Fig. 2e). Rb/p53 ablated tumors were comprised of cells with recombined Rb and p53 alleles, and were phenotypically similar to Rb deficient MTC including staining positive for calcitonin and no identifiable histopathologic evidence of differences in tumor grade (Fig. 2b-c). These data directly demonstrate that although p53 loss is not sufficient to initiate neuroendocrine tumorigenesis, p53 plays a critical role in suppressing Rb deficient cancer progression.
p53 loss enhances Rb deficient tumor progression by promoting cell growth despite increased cell death
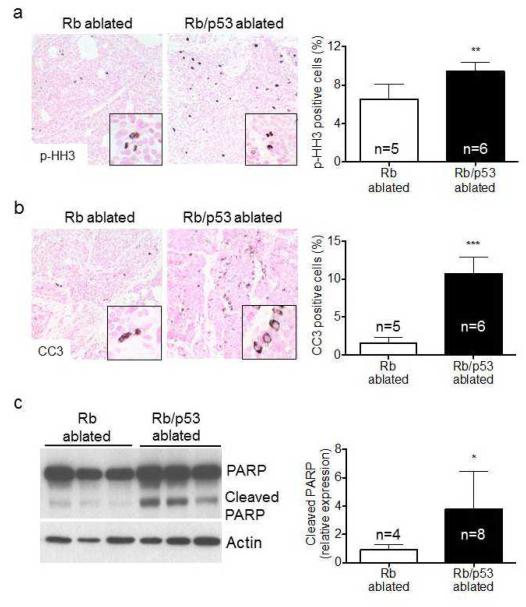
Cell proliferation and death were compared between Rb and Rb/p53 ablated thyroid tumors to determine mechanisms accounting for the dramatic p53 dependent suppression of MTC progression. p53 loss resulted in a significant increase in cell cycle progression (Fig 3a). Notably, p53 loss did not promote cell survival but rather led to increased apoptotic cell death as indicated by a significant increase in cleaved caspase-3 positive tumor cells in Rb/p53 as compared to Rb ablated tumors (Fig. 3b). Additionally, cleaved PARP levels were higher in combined Rb/p53 deficient tumors as compared to Rb loss alone (Fig. 3c). These data identify enhanced cellular proliferation as an underlying mechanism promoting MTC progression after p53 loss. Moreover, the data directly demonstrate that the established apoptotic function of p53 is not responsible for p53 mediated suppression of MTC progression. In contrast, increased cell death resulting from p53 loss must be overcome to result in the dramatic p53 dependent tumor progression seen in Rb deficient tumors.
Figure 3. p53 loss stimulates MTC cell proliferation and apoptosis.
(a) Cell proliferation was determined by percentage of tumor cells positive for the mitotic marker, phosphorylated histone H3 (p-HH3) by immunohistochemistry. The percentage of p-HH3 positive cells was significantly increased in Rb/p53 as compared to Rb ablated tumors. Apoptotic cell death was assessed by immunohistchemistry for cleaved caspase-3 (CC3) (b) and Western blot analysis for cleaved PARP (c). Both CC3 positive cells and cleaved PARP were significantly increased in Rb/p53 compared to Rb ablated tumors. Western blots were reprobed for actin as a loading control. Quantification of cleaved PARP is represented as relative densitometric values of cleaved PARP normalized to actin. Data are represented as mean ± SD. *p<0.05, **p<0.01 and ***p<0.001.
p53 loss results in mTOR pathway activation
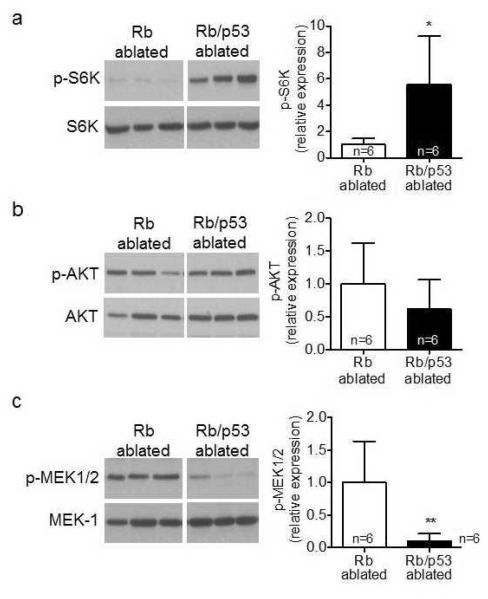
p53 mediated suppression of the IGF-1/AKT/mTOR pathway was recently identified as a novel mechanism to negatively regulate cell growth in culture (5, 6). To determine whether p53 suppressed this growth stimulatory pathway in vivo, expression of activated signaling molecules was determined in Rb and Rb/p53 ablated thyroid tumors. p53 loss resulted in marked mTOR pathway activation as indicated by increased expression of the downstream mTORC1 target, phosphorylated S6 kinase (p-S6K) (Fig. 4a). In contrast, phosphorylated AKT (p-AKT) levels were similar in Rb and Rb/p53 ablated tumors and p53 loss resulted in decreased phosphorylated MEK (p-MEK) levels (Fig. 4b-c). These data demonstrate that p53 loss results in mTOR pathway activation during tumor progression in vivo in the absence of increased AKT signaling and coincident with downregulated MAPK signaling.
Figure 4. p53 loss results in mTOR pathway activation in Rb deficient MTC.
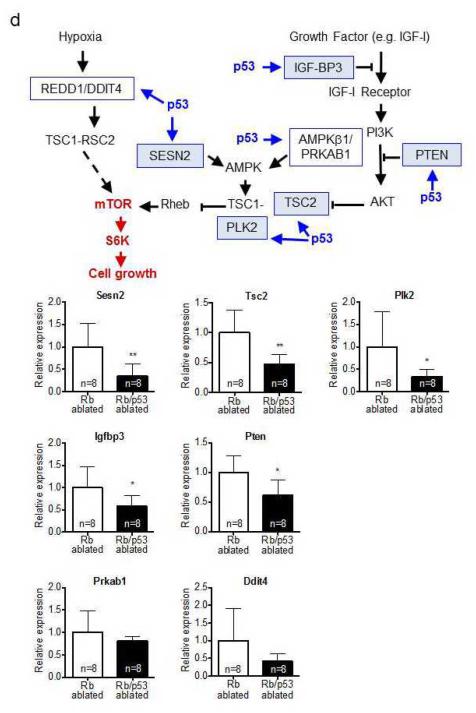
Activated, phosphorylated forms of S6 kinase (p-S6K), AKT (p-AKT) and MEK (p-MEK1/2) as well as corresponding total protein levels (S6K, AKT and MEK-1) were compared between Rb and Rb/p53 ablated thyroid tumors by Western blot analysis. (a) p-S6K was significantly increased in Rb/p53 as compared to Rb ablated tumors despite similar total S6K levels. (b) p-AKT and total AKT levels were similar in Rb and Rb/p53 ablated tumors. (c) p-MEK was significantly decreased in Rb/p53 as compared to Rb ablated tumors despite similar total MEK levels. Quantification is represented as relative densitometric values of phosphorylated:total protein ratios. (d) p53 loss in Rb deficient MTC results in decreased expression of mTOR pathway inhibitors. Schematic diagram illustrating previously identified p53 target genes (blue outlined boxes) known to repress mTOR signaling. Activation is indicated in blue and suppression in red. Quantitative RT-PCR showed significantly reduced expression of Sesn2, Tsc2, Plk2, Igfbp3 and Pten (blue shaded boxes), but not Ddit4 and Prkab1 (unshaded boxes), in Rb/p53 as compared to Rb ablated MTC. Data are represented as mean ± SD. *p<0.05, **p<0.01.
p53 transcriptionally induces multiple genes that repress IGF-1/AKT/mTOR pathway signaling (Fig. 4d) (5, 28). Examination of these p53 targets in Rb and Rb/p53 deficient MTC revealed that p53 loss was associated with decreased expression of the mTOR pathway inhibitors, sestrin 2 (Sesn2), tuberous sclerosis 2 (Tsc2), polo-like kinase 2 (Plk2), insulin-like growth factor binding protein 3 (Igfbp3) and phosphatase and tensin homolog (Pten) (Fig. 4d). In contrast, the p53 target genes DNA-damage-inducible transcript 4 (Ddit4) and protein kinase AMP-activated, beta 1 non-catalytic subunit (Prkab1) were not significantly changed in Rb/p53 as compared to Rb ablated tumors demonstrating that p53 loss led to selective downregulation of a subset of p53 target genes. mTOR activation in Rb/p53 deficient MTC was present in the absence of AKT activation indicating that physiologically relevant p53 targets critical for suppressing MTC progression are likely downstream of AKT. Sestrin 2, TSC2 and PLK2 inhibit mTOR signaling downstream of AKT identifying these molecules as potential mediators of p53 dependent tumor suppression in vivo. These data provide evidence that p53 positively regulates mTOR pathway inhibitors in vivo, and directly demonstrate that p53 suppresses mTOR pathway signaling in the context of tumor progression.
p53 loss is required for establishing Rb deficient MTC cells in culture and p53 expression in Rb/p53 deficient MTC cells suppresses cell growth and mTOR pathway activity
Rb and Rb/p53 ablated thyroid tumors were explanted to propagate tumor cells in culture (Supplemental Table and Fig. S1). MTC cell cultures were efficiently established from Rb/p53 ablated explanted tumors after 1.5-2.3 months in culture. Rb and p53 gene recombination was detected in all cell cultures demonstrating that the cultured cells were derived from MTC (Fig. S1). In contrast to Rb/p53 ablated tumors, only one of 13 Rb ablated explanted tumors resulted in an established MTC cell culture and this occurred after an extended culture period of 9.4 months. Cells grew from four additional Rb ablated tumors after 8-11 months in culture but no or partial Rb gene recombination was detected in the resultant cells despite uniform Rb recombination in the original explanted tumors indicating that the cultures were not pure MTC tumor cells (Supplemental Table and Fig. S1). Interestingly, cells established from the one Rb ablated tumor had p53 allelic loss (Fig. S2). These data provide evidence that p53 loss is required for establishing Rb deficient MTC cell cultures and support the in vivo results showing that p53 loss in Rb deficient tumors results in a more aggressive phenotype.
Rb and p53 are established regulators of cellular differentiation, and differentiation control was identified as a key p53 family tumor suppressor activity (2). Thus, the effects of Rb and combined Rb/p53 loss on MTC differentiation were assessed in thyroid tumors and cultured cells. High calcitonin and synaptophysin expression was detected in Rb deficient tumors (Fig. S1). Additional loss of p53 was associated with a significant decrease in calcitonin expression but no change in expression of the more general neuroendocrine marker, synaptophysin. Minimal or no calcitonin and synaptophysin expression was detected in combined Rb/p53 deficient MTC cultured cells. These data indicate that MTC propagation in culture and p53 loss is associated with decreased cellular differentiation.
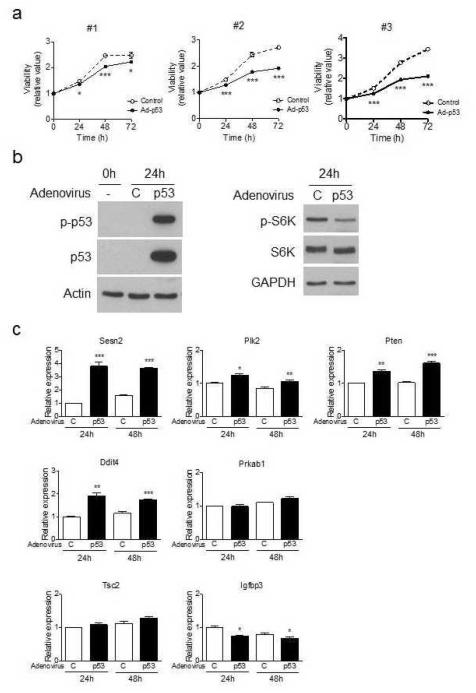
Expression of p53 in three independently derived Rb/p53 deficient MTC cell cultures from tumors that developed in three different mice inhibited cell growth (Fig. 5a). Moreover, p53 expression suppressed mTOR pathway activation and resulted in increased expression of mTOR pathway inhibitors, including Sesn2, Plk2 and Pten identified as candidate mediators linking p53 and mTOR in vivo (Figs. 5b-c and 4d). These data provide further evidence that p53 suppression of mTOR signaling is critical for inhibiting tumor cell growth.
Figure 5.
p53 expression inhibits cell growth and decreases mTOR pathway activity in Rb/p53 deficient MTC cells
(a) Cell growth was significantly decreased by 24 hours and sustained to 72 hours after infection with p53 adenovirus (Ad-p53) as compared to control virus in three independently derived MTC cell cultures (#1, #2, #3) derived from three different mice as assessed by WST-1 assays. Results are representative of two independent experiments. Data are represented as mean ± SD (n=4 wells/group). (b) Expression of activated p53 phosphorylated at serine 15 (p-p53) and total p53 (p53) protein was associated with decreased p-S6K protein levels as compared to cells infected with control adenovirus (C) 24 hours after infection of cell culture #2. No change was detected in total S6K levels. Blots were reprobed for actin or GAPDH as loading controls. Results are representative of two independent experiments. (c) p53 expression in Rb/p53 deficient MTC cells resulted in increased expression of mTOR pathway inhibitors. Quantitative RT-PCR showed significantly increased expression of Sesn2, Plk2, Pten and Ddit4, no change in Tsc2 and Prkab1 expression, and decreased expression of Igfbp3 in p53 expressing MTC culture #2 cells as compared to cells infected with control virus (C). Data are represented as mean ± SD (n=3 wells/group). *p<0.05, **p<0.01 and ***p<0.001.
mTOR pathway inhibition by rapamycin suppresses Rb/p53 deficient tumor cell growth
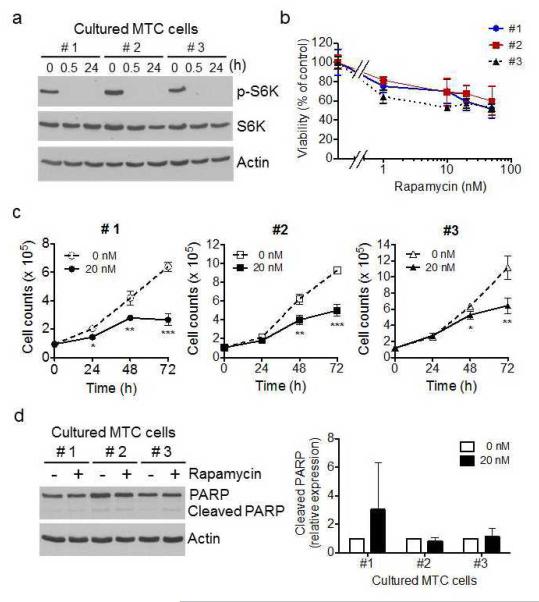
Rapamycin treatment of MTC cells resulted in dramatic inhibition of p-S6K and inhibited cell growth in a dose-dependent manner in all three independently derived Rb/p53 deficient MTC cell cultures (Fig. 6a-b). Time course experiments demonstrated statistically significant decreases in cell growth by 48 and 72 hours after rapamycin treatment in all three cell cultures by both cell counts and WST-1 assays (Fig. 6c and data not shown). No evidence of rapamycin induced apoptosis was detected by cleaved-PARP expression (Fig. 6d). These studies demonstrate that mTOR pathway activation resulting from p53 loss functions to stimulate tumor cell growth. Moreover, rapamycin is effective in suppressing p53 dependent mTOR pathway activation resulting in decreased tumor cell growth.
Figure 6. mTOR pathway inhibition by rapamycin suppresses Rb/p53 deficient MTC cell growth.
The effect of rapamycin on Rb/p53 deficient MTC cell growth was assessed in three independently derived MTC cell cultures (#1, #2 and #3) generated from three different mice. (a) Western blot analysis for S6K phosphorylation demonstrated dramatic mTOR signaling inhibition by 0.5 hours (h) after 20 nM rapamycin treatment that was sustained at 24 hours in all three cell cultures. Total S6K levels were similar at all time points. Blots were reprobed for actin as a loading control. Results are representative of three independent experiments. (b) MTC cell cultures were inhibited by rapamycin in a dose dependent manner as assessed by WST-1 assays performed after 72 hours of rapamycin treatment. Results are representative of three independent experiments. Data are represented as mean ± SD (n=6 wells/group). (c) MTC cell growth was significantly decreased by 48 hours after treatment with 20 nM rapamycin (20 nM) as compared to vehicle controls (0 nM) in all three cell cultures as assessed by cell counts in time-course experiments. Results are representative of two independent experiments. Data are represented as mean ± SD (n=3 wells/group). (d) Cleaved PARP levels were similar in cultured MTC cells treated for 24 hours with 20 nM rapamycin and vehicle controls by Western blot analysis. Results are representative of three independent experiments. Quantification of cleaved PARP is represented as relative densitometric values of cleaved PARP normalized to actin. Data are represented as mean ± SD. *p<0.05, **p<0.01 and ***p<0.001.
mTOR pathway inhibition in MTC tumor cells does not induce MAPK or AKT pathway activation
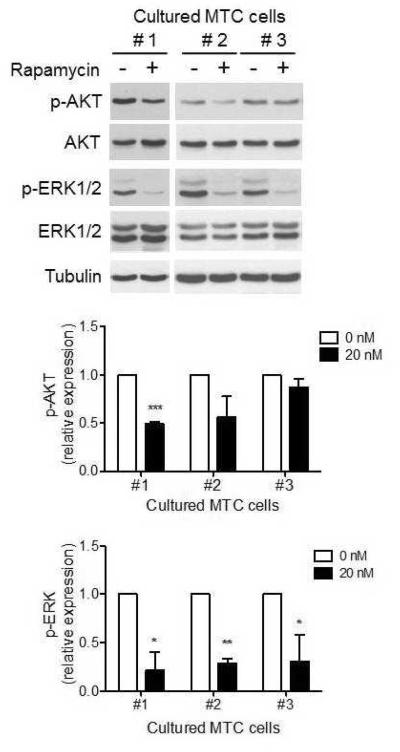
mTORC1 inhibition was previously shown to induce MAPK pathway activation leading to the conclusion that tumor cells evade a therapeutic response to rapamycin by upregulating AKT and MAPK signaling (25). To determine whether feedback induction of kinase pathway signaling is tumor type specific or represents a general response, rapamycin treated MTC cells were assessed for MAPK and AKT pathway activation. In contrast to prior reports, MAPK activation was not detected in MTC cells as assessed by p-ERK levels (Fig. 7). In fact, rapamycin treatment resulted in a significant decrease in MAPK signaling in all three cell cultures. AKT pathway signaling was more variable with one culture showing a significant decrease in p-AKT levels and the other two cultures showing no significant change (Fig. 7). Importantly, however, AKT activation was not increased after rapamycin treatment in any of the three independently derived cell cultures. Thus, rapamycin treatment of MTC tumor cells is not associated with MAPK or AKT pathway activation. Instead, inhibition of mTORC1 pathway signaling led to MAPK downregulation. These data indicate that MAPK pathway activation after mTORC1 inhibition is tumor cell type specific and does not represent a general tumor response.
Figure 7. Rapamycin inhibition of mTOR signaling in Rb/p53 deficient MTC cells does not lead to MAPK or AKT pathway activation.
p-AKT was decreased or unchanged in three independently derived MTC cell cultures treated with 20 nM rapamycin (20 nM) for 24 hours compared to vehicle controls (0 nM) as assessed by Western blot analysis. p-ERK1/2 levels were significantly decreased in all three cell cultures. Total AKT (AKT) and ERK (ERK1/2) levels were similar in rapamycin treated and controls. Western blots were reprobed with tubulin as a loading control. Quantification is represented as relative densitometric values of phosphorylated:total protein ratios. Results are representative of three independent experiments. Data are represented as mean ± SD. *p<0.05, **p<0.01 and ***p<0.001.
DISCUSSION
Rb and p53 have distinct and cooperative evolutionarily conserved roles in suppressing carcinogenesis in mice and humans. The critical role for Rb in neuroendocrine cell function and tumorigenesis is striking. A major defect in germline Rb-/- mice is ectopic cell proliferation and death in neural tissues. In addition, Rb+/− and conditional Rb ablated mice develop a remarkable spectrum of neuroendocrine tumors in multiple organs (11-13). The neuroendocrine tumor spectrum is extended to additional organs with combined Rb/p53 loss (11, 13). The current studies extend these reports by demonstrating that Rb loss induces a p53 dependent response critical for suppressing tumor progression. Rb ablation resulted in consistent MTC development with uniform latency providing evidence that Rb loss is sufficient for tumor initiation. In contrast, p53 loss is not sufficient for tumor initiation ((13) and data not shown) but data herein directly demonstrate that p53 plays a critical and prominent role in suppressing tumor progression by inhibiting cell cycle progression and suppressing mTORC1 activity. The critical and selective role for Rb and p53 in suppressing neuroendocrine carcinogenesis is further demonstrated in the lung epithelium which is comprised of neuroendocrine as well as multiple non-neuroendocrine cell types. Rb loss is sufficient to selectively induce neuroendocrine hyperplasia and additional loss of p53 results in highly aggressive SCLC (10, 26, 29). These findings in mice recapitulate the genetics in human disease. Together, these data provide robust evidence that Rb and p53 play critical evolutionally conserved roles in suppressing neuroendocrine carcinogenesis.
The data presented herein directly demonstrate that Rb and p53 cooperate to suppress the aggressive neuroendocrine thyroid carcinoma, MTC. The prevalence of Rb and p53 alterations in human MTC is unclear. The Rb gene has not been directly assessed in MTC; however comparative genomic hybridization detected losses of chromosome 13q wherein the Rb gene resides (30-32). Immunohistochemical analyses resulted in varying results. Holm, et al. detected Rb expression in 46 MTC whereas more recent smaller case series reported loss of Rb staining in 20-50% of cases (33-35). Genetic assessment of the p53 gene in MTC resulted in no detected mutations in earlier reports (36-38), whereas more recent studies report p53 mutations and deletions in up to 44% of cases (39, 40). Given the differing published results, a systematic analysis of Rb and p53 status in MTC is necessary to clarify their role in human MTC. Regardless of the genetic alteration, however, the mTOR pathway is functionally activated in the vast majority of cases (21, 23, 24). mTOR pathway activation drives cancer growth by activating lipid and protein biosynthesis needed for robust tumor expansion (41). mTOR is a serine/threonine protein kinase that functions in two distinct complexes, mTORC1 and mTORC2, that regulate discrete sets of cellular responses. Protein synthesis is the best characterized process controlled by mTORC1 (42). Phosphorylated S6, a primary mTORC1 effector, was detected in 49/51 (96%) of human MTC (24). Some of the pS6 positive tumors did not express p-AKT and did not have RET mutations indicating that mTOR activation was induced by other mechanisms (21, 24). The current studies identify p53 loss as an alternate mechanism to activate mTOR signaling in vivo. Moreover, the data demonstrate that p53 loss and mTOR activation are associated with dramatic tumor progression. Interesting, pS6 was upregulated in 22/23 (96%) lymph node metastases as compared with autologous matched primary MTC supporting a similar role for mTOR activation in human MTC progression (24).
p53 suppresses tumor progression by inhibiting cellular proliferation and mTOR pathway signaling. Mechanistic studies underlying p53 dependent phenotypes in the current studies reveal that p53 suppresses MTC progression by inhibiting cell cycle progression. Similarly, p53 loss results in increased proliferation in murine models of retinoblastoma and activation of the p53 tumor surveillance pathway in human retinogenesis after Rb loss leads to cell cycle exit (7, 8). Surprisingly, p53 induction did not induce an apoptotic response in the current studies but rather p53 loss was associated with increased apoptosis. This finding is in contrast to the lack of effect of p53 loss on apoptosis in murine retinoblastoma and the promotion of apoptosis induced by activation of the p53 tumor surveillance pathway in human retinogenesis (7, 8).
The discovery that p53 loss promotes tumor cell growth by enhancing mTOR pathway signaling has therapeutic implications. Reactivation of wild type p53 in p53 null or mutant tumors is sufficient to induce tumor stasis or regression: however, targeting p53 therapeutically has been challenging and has not yet impacted patient care (43). An alternate approach is to identify mechanisms by which p53 loss promotes tumor growth and target these downstream pathways. The mTOR pathway represents one such downstream pathway. The current studies demonstrate that targeting mTORC1 in p53 deficient MTC suppresses tumor cell growth. Similarly, inhibition of mTOR signaling in human MTC cell lines suppresses proliferation, motility and tumorigenicity (21, 24, 44, 45). Moreover, tumor responses were seen in two patients with progressive metastatic MTC treated with the mTOR inhibitor, everolimus (44). Tumor cell growth was suppressed by cell cycle inhibition in the absence of apoptosis consistent with mTORC1 inhibitors being primarily cytostatic, rather than cytotoxic, and thus inducing disease stabilization as opposed to regression (24, 41, 44, 45). Clinical successes resulting from mTORC1 targeting drugs include substantial benefit in treatment of renal cell carcinoma, mantle cell lymphoma, pancreatic neuroendocrine tumors and benign tumors arising from TSC1 and TSC2 mutations (41, 46). In other instances, rapalogs have shown only modest efficacy in tumors wherein benefits were expected based upon insights into mTOR pathway signaling. The effectiveness of rapamycin treatment was shown to be impaired by the unintended activation of feedback loops that drive mitogenic signaling through AKT, RAS/MAPK and mTORC2 activation (41, 42). This discovery provided rationale for ongoing clinical trials combining mTOR, PI3K, AKT and MEK inhibitors (47). Interestingly, mTORC1 inhibition by rapamycin in the current studies did not result in feedback activation of AKT or MAPK signaling. These results highlight the need to carefully consider tumor specific crosstalk interactions in the mTOR pathway in order to design the most effective combination therapies while avoiding unnecessary toxicities.
In summary, the current studies demonstrate that Rb and p53 have distinct roles in suppressing MTC. Conditional Rb, but not p53, loss in the thyroid is sufficient for tumor initiation with a long latency, whereas combined Rb and p53 ablation results in highly penetrant MTC with consistent, rapid tumor progression. The oncogenic stimulus provided by Rb loss leads to a p53 tumor suppressive response that inhibits cellular proliferation and mTOR dependent cell growth. Inhibition of mTORC1 signaling suppressed tumor cell growth demonstrating that mTOR pathway inhibition is a critical p53 tumor suppressive function. Notably, rapamycin induced mTORC1 inhibition did not result in MAPK or AKT pathway activation as was seen in other carcinomas providing evidence that this feedback mechanism is tumor type specific and not a general response to blocking mTORC1 signaling. Together, these studies provide mechanistic links between genetic alterations and aberrant signaling pathways critical in Rb and p53 dependent cancer initiation and progression in vivo. The established role for Rb and p53 pathways in suppressing neuroendocrine carcinomas coupled with the growth inhibitory response of drugs targeting mTOR signaling in human pancreatic neuroendocrine tumors support common regulatory mechanisms operative in mice and humans (46). Thus, in addition to providing mechanistic insights, the generated mouse models provide robust preclinical platforms to explore novel therapeutic strategies as well as define mechanisms underlying treatment response and resistance.
MATERIALS AND METHODS
Mouse strains and genotyping
Surfactant protein C (SPC)-rtTA; tet-Cre mice with floxed Rb or Rb and p53 (FVB;129-Trp53tm1Brn obtained from NCI Mouse Repository) alleles were treated with doxycycline throughout gestation (26, 48). Genotypes were determined by PCR analysis of tail DNA using previously established primers (NCI Mouse Repository and (26)).
Establishment of MTC cell cultures and culture conditions
Thyroid tumors were minced and cultured in HITES medium supplemented with 2% fetal bovine serum (FBS) and penicillin/streptomycin (49). All explanted tumors were morphologically confirmed as MTC. NIH3T3 cells were obtained from ATCC and maintained in Dulbecco's Modified Eagle's Medium supplemented with 10% FBS and penicillin/streptomycin.
PCR analysis for Rb and p53 gene recombination
Genomic DNA was subjected to 30 PCR cycles (30 sec at 94 °C, 30 sec at 58 °C, and 30 sec at 72 °C) using the Rb primers Rb212, Rb18 and Rb19E (29) and p53 primers p53-T008 (5’-CACAAAAACAGGTTAAACCCA-3’) and p53-T011 (5’-GAAGACAGAAAAGGG-3’).
Histology and immunohistochemistry
Tissues were fixed in 10% formalin, paraffin embedded and analyzed on hematoxylin and eosin (H&E) stained sections. Immunohistochemistry was performed using Vectastain Elite ABC and DAB Substrate kits (Vector Laboratories). Methanol/hydrogen peroxide pretreatment, microwave 10 mmol/L citrate antigen retrieval, and serum blocking was performed. Antibodies were incubated at 4°C overnight: Calcitonin (1:8000; Bachem), p53 (1:500; (CM5) Leica Microsystems), phosphorylated histone H3 (1:1000; US Biological) and cleaved caspase-3 (Asp 175) (1:150, Cell Signaling). Slides were counterstained with nuclear fast red. Cell proliferation and apoptosis was quantified by determining percentage positive cells with 303-534 cells analyzed per group.
Western blot analysis
Tissues and cultured cells were homogenized in lysis buffer supplemented with protease and phosphatase inhibitors (Thermo Scientific), and 50 μg of total protein was resolved by SDS-polyacrylamide electrophoresis under reducing conditions. Proteins transferred to nitrocellulose membranes were probed with antibodies: phosphop53 (Ser15) (1:1000; Cell Signaling), p53 (1:2000; (CM5) Leica Microsystems and 1:1000; (1C12) Cell signaling), PARP (1:1000; Cell Signaling), phospho-p70 S6 Kinase (Thr 389) (1:1000; (108D2) Cell Signaling), p70 S6 Kinase (1:500; (C19) Santa Cruz Biotechnology), p70 S6 Kinase (1:2000; (H-9) Santa Cruz Biotechnology), phospho-AKT (Ser 473) (1:2000; (193H12) Cell Signaling), AKT (1:2000; Cell Signaling), phosph-MEK1/2 (Ser 217/221) (1:2000; Cell Signaling), MEK-1 (1:2000; (C-18) Santa Cruz Biotechnology), phospho-ERK (1:2000; (E-4) Santa Cruz Biotechnology), ERK1 (1:2000; (K-23) Santa Cruz Biotechnology), tubulin (1:4000; (DM 1A) Sigma), actin (1:2000; (20-33) Sigma) and GAPDH (1:10,000; (D16H11) Cell Signaling). Detection was performed with horseradish peroxidase–conjugated secondary antibodies and ECL Plus Western blotting Detection System (GE Healthcare). Data quantification was determined by relative densitometric values of scanned radiographic films.
Quantitative real-time PCR analysis
Total RNA was isolated using SV total RNA isolation system (Promega) and cDNA generated with SuperScript III RT (Invitrogen). Quantitative real-time PCR (qRT-PCR) was performed using the TaqMan Real-Time PCR Gene Expression System (Applied Biosystems) and TaqMan primer/probe sets specific for Calca (assay ID: Mm00801463_g1), Syp (assay ID: Mm00436850_m1), Sesn2 (assay ID: Mm00460679_m1), Tsc2 (assay ID: Mm00442004), Plk2 (assay ID: Mm00446917_m1), Igfbp3 (assay ID: M 00515156_m1), Pten (assau ID: Mm00477208_m1), Prkab1 (assay ID: Mm01201921_m1), Ddit4 (assay ID: Mm00512504) and Actb (catalog number: 4352933E) as an internal control. PCR reactions, quantifications and data analysis of triplicate samples was performed using the 7300 Real-Time PCR system and software.
Adenovirus infection, rapamycin treatment and cell growth assays
Cells were seeded into 96-well plates and were infected after media change the following day with Ad-p53-GFP or control Ad-GFP adenoviruses generously provided by Susanne I. Wells (50) Infection efficiency for p53 and control virus were similar as determined by GFP positive cells, ranging between 13-39% for the three MTC cell cultures. Cell growth was determined by WST-1 assays (Millipore). For rapamycin treatments, cells were seeded in 12-well plates at 1×10⁵ cells/well for cell counting or 96-well plates at 5×10³ cells/well for WST-1 assays and treated the following day with 1, 10, 20 and 50nM rapamycin for 72 hours or 20 nM rapamycin for 24, 48 and 72 hours. Cells treated with DMSO vehicle served as controls. Cell growth was determined by hemocytometer cell counts and WST-1 assays. Data is representative of triplicate or sextuplicate samples and two or three independent experiments.
Statistical analysis
GraphPad Prism (ver. 5.0d) was used for all statistical analyses. Symptom free survival was analyzed by the Kaplan Meier log-rank test. One-way Anova followed by Tukey’s multiple comparison was used to analyze thyroid/body weight and thyroid tumor size, and Bonferroni’s multiple comparison to analyze calcitonin and synaptophysin expression. p53 target gene expression and protein expression was analyzed using unpaired Student's t-tests assuming equal or unequal variance. Statistical significance was defined as p < 0.05.
Supplementary Material
ACKNOWLEDGEMENTS
We thank Mingyan Yang and Susan E. Wert for technical expertise, Veterinary Services for excellent animal care, and Susanne I. Wells and Elizabeth E. Hoskins for reagents and technical expertise. This work was supported by grants from the American Cancer Society RSG-10-194-01-TBG and NIH/NHLBI RO1 HL079193 (KAWB).
Financial Support: This work was supported by grants from the American Cancer Society RSG-10-194-01-TBG and NIH/NHLBI RO1 HL079193 to KAWB
Footnotes
CONFLICT OF INTEREST
The authors declare no conflict of interest.
Supplementary Information accompanies the paper on the Oncogene website (http://www.nature.com/onc).
REFERENCES
- 1.Levine AJ, Oren M. The first 30 years of p53: growing ever more complex. Nature reviews Cancer. 2009;9(10):749–58. doi: 10.1038/nrc2723. Epub 2009/09/25. [DOI] [PMC free article] [PubMed] [Google Scholar]
- 2.Stiewe T. The p53 family in differentiation and tumorigenesis. Nature reviews Cancer. 2007;7(3):165–8. doi: 10.1038/nrc2072. Epub 2007/03/03. [DOI] [PubMed] [Google Scholar]
- 3.Vousden KH, Prives C. Blinded by the Light: The Growing Complexity of p53. Cell. 2009;137(3):413–31. doi: 10.1016/j.cell.2009.04.037. Epub 2009/05/05. [DOI] [PubMed] [Google Scholar]
- 4.Liu G, Parant JM, Lang G, Chau P, Chavez-Reyes A, El-Naggar AK, et al. Chromosome stability, in the absence of apoptosis, is critical for suppression of tumorigenesis in Trp53 mutant mice. Nature genetics. 2004;36(1):63–8. doi: 10.1038/ng1282. Epub 2004/01/01. [DOI] [PubMed] [Google Scholar]
- 5.Feng Z, Levine AJ. The regulation of energy metabolism and the IGF-1/mTOR pathways by the p53 protein. Trends in cell biology. 2010;20(7):427–34. doi: 10.1016/j.tcb.2010.03.004. Epub 2010/04/20. [DOI] [PMC free article] [PubMed] [Google Scholar]
- 6.Hasty P, Sharp ZD, Curiel TJ, Campisi J. mTORC1 and p53: clash of the gods? Cell Cycle. 2013;12(1):20–5. doi: 10.4161/cc.22912. Epub 2012/12/21. [DOI] [PMC free article] [PubMed] [Google Scholar]
- 7.Conkrite K, Sundby M, Mu D, Mukai S, MacPherson D. Cooperation between Rb and Arf in suppressing mouse retinoblastoma. The Journal of clinical investigation. 2012;122(5):1726–33. doi: 10.1172/JCI61403. Epub 2012/04/10. [DOI] [PMC free article] [PubMed] [Google Scholar]
- 8.Laurie NA, Donovan SL, Shih CS, Zhang J, Mills N, Fuller C, et al. Inactivation of the p53 pathway in retinoblastoma. Nature. 2006;444(7115):61–6. doi: 10.1038/nature05194. Epub 2006/11/03. [DOI] [PubMed] [Google Scholar]
- 9.Wikenheiser-Brokamp KA. Retinoblastoma regulatory pathway in lung cancer. Current molecular medicine. 2006;6(7):783–93. doi: 10.2174/1566524010606070783. Epub 2006/11/15. [DOI] [PubMed] [Google Scholar]
- 10.Meuwissen R, Linn SC, Linnoila RI, Zevenhoven J, Mooi WJ, Berns A. Induction of small cell lung cancer by somatic inactivation of both Trp53 and Rb1 in a conditional mouse model. Cancer cell. 2003;4(3):181–9. doi: 10.1016/s1535-6108(03)00220-4. Epub 2003/10/03. [DOI] [PubMed] [Google Scholar]
- 11.Harvey M, Vogel H, Lee EY, Bradley A, Donehower LA. Mice deficient in both p53 and Rb develop tumors primarily of endocrine origin. Cancer research. 1995;55(5):1146–51. Epub 1995/03/01. [PubMed] [Google Scholar]
- 12.Nikitin AY, Juarez-Perez MI, Li S, Huang L, Lee WH. RB-mediated suppression of spontaneous multiple neuroendocrine neoplasia and lung metastases in Rb+/− mice. Proceedings of the National Academy of Sciences of the United States of America. 1999;96(7):3916–21. doi: 10.1073/pnas.96.7.3916. Epub 1999/03/31. [DOI] [PMC free article] [PubMed] [Google Scholar]
- 13.Williams BO, Remington L, Albert DM, Mukai S, Bronson RT, Jacks T. Cooperative tumorigenic effects of germline mutations in Rb and p53. Nature genetics. 1994;7(4):480–4. doi: 10.1038/ng0894-480. Epub 1994/08/01. [DOI] [PubMed] [Google Scholar]
- 14.Cerrato A, De Falco V, Santoro M. Molecular genetics of medullary thyroid carcinoma: the quest for novel therapeutic targets. Journal of molecular endocrinology. 2009;43(4):143–55. doi: 10.1677/JME-09-0024. Epub 2009/04/23. [DOI] [PubMed] [Google Scholar]
- 15.Pitt SC, Moley JF. Medullary, anaplastic, and metastatic cancers of the thyroid. Seminars in oncology. 2010;37(6):567–79. doi: 10.1053/j.seminoncol.2010.10.010. Epub 2010/12/21. [DOI] [PubMed] [Google Scholar]
- 16.Sippel RS, Kunnimalaiyaan M, Chen H. Current management of medullary thyroid cancer. The oncologist. 2008;13(5):539–47. doi: 10.1634/theoncologist.2007-0239. Epub 2008/06/03. [DOI] [PubMed] [Google Scholar]
- 17.Wu LS, Roman SA, Sosa JA. Medullary thyroid cancer: an update of new guidelines and recent developments. Current opinion in oncology. 2011;23(1):22–7. doi: 10.1097/CCO.0b013e328340b527. Epub 2010/11/04. [DOI] [PubMed] [Google Scholar]
- 18.Almeida MQ, Hoff AO. Recent advances in the molecular pathogenesis and targeted therapies of medullary thyroid carcinoma. Current opinion in oncology. 2012;24(3):229–34. doi: 10.1097/CCO.0b013e328351c71a. Epub 2012/02/22. [DOI] [PubMed] [Google Scholar]
- 19.Smith-Hicks CL, Sizer KC, Powers JF, Tischler AS, Costantini F. C-cell hyperplasia, pheochromocytoma and sympathoadrenal malformation in a mouse model of multiple endocrine neoplasia type 2B. The EMBO journal. 2000;19(4):612–22. doi: 10.1093/emboj/19.4.612. Epub 2000/02/17. [DOI] [PMC free article] [PubMed] [Google Scholar]
- 20.Moura MM, Cavaco BM, Pinto AE, Leite V. High prevalence of RAS mutations in RET-negative sporadic medullary thyroid carcinomas. The Journal of clinical endocrinology and metabolism. 2011;96(5):E863–8. doi: 10.1210/jc.2010-1921. Epub 2011/02/18. [DOI] [PubMed] [Google Scholar]
- 21.Rapa I, Saggiorato E, Giachino D, Palestini N, Orlandi F, Papotti M, et al. Mammalian target of rapamycin pathway activation is associated to RET mutation status in medullary thyroid carcinoma. The Journal of clinical endocrinology and metabolism. 2011;96(7):2146–53. doi: 10.1210/jc.2010-2655. Epub 2011/05/06. [DOI] [PubMed] [Google Scholar]
- 22.Goutas N, Vlachodimitropoulos D, Bouka M, Lazaris AC, Nasioulas G, Gazouli M. BRAF and K-RAS mutation in a Greek papillary and medullary thyroid carcinoma cohort. Anticancer research. 2008;28(1A):305–8. Epub 2008/04/04. [PubMed] [Google Scholar]
- 23.Kouvaraki MA, Liakou C, Paraschi A, Dimas K, Patsouris E, Tseleni-Balafouta S, et al. Activation of mTOR signaling in medullary and aggressive papillary thyroid carcinomas. Surgery. 2011;150(6):1258–65. doi: 10.1016/j.surg.2011.09.022. Epub 2011/12/06. [DOI] [PubMed] [Google Scholar]
- 24.Tamburrino A, Molinolo AA, Salerno P, Chernock RD, Raffeld M, Xi L, et al. Activation of the mTOR pathway in primary medullary thyroid carcinoma and lymph node metastases. Clinical cancer research : an official journal of the American Association for Cancer Research. 2012;18(13):3532–40. doi: 10.1158/1078-0432.CCR-11-2700. Epub 2012/07/04. [DOI] [PubMed] [Google Scholar]
- 25.Carracedo A, Ma L, Teruya-Feldstein J, Rojo F, Salmena L, Alimonti A, et al. Inhibition of mTORC1 leads to MAPK pathway activation through a PI3K-dependent feedback loop in human cancer. The Journal of clinical investigation. 2008;118(9):3065–74. doi: 10.1172/JCI34739. Epub 2008/08/30. [DOI] [PMC free article] [PubMed] [Google Scholar]
- 26.Simpson DS, Mason-Richie NA, Gettler CA, Wikenheiser-Brokamp KA. Retinoblastoma family proteins have distinct functions in pulmonary epithelial cells in vivo critical for suppressing cell growth and tumorigenesis. Cancer research. 2009;69(22):8733–41. doi: 10.1158/0008-5472.CAN-09-1359. Epub 2009/11/06. [DOI] [PMC free article] [PubMed] [Google Scholar]
- 27.Perl AK, Wert SE, Nagy A, Lobe CG, Whitsett JA. Early restriction of peripheral and proximal cell lineages during formation of the lung. Proceedings of the National Academy of Sciences of the United States of America. 2002;99(16):10482–7. doi: 10.1073/pnas.152238499. Epub 2002/07/30. [DOI] [PMC free article] [PubMed] [Google Scholar]
- 28.Matthew EM, Hart LS, Astrinidis A, Navaraj A, Dolloff NG, Dicker DT, et al. The p53 target Plk2 interacts with TSC proteins impacting mTOR signaling, tumor growth and chemosensitivity under hypoxic conditions. Cell Cycle. 2009;8(24):4168–75. doi: 10.4161/cc.8.24.10800. Epub 2010/01/08. [DOI] [PMC free article] [PubMed] [Google Scholar]
- 29.Wikenheiser-Brokamp KA. Rb family proteins differentially regulate distinct cell lineages during epithelial development. Development. 2004;131(17):4299–310. doi: 10.1242/dev.01232. Epub 2004/08/06. [DOI] [PubMed] [Google Scholar]
- 30.Frisk T, Zedenius J, Lundberg J, Wallin G, Kytola S, Larsson C. CGH alterations in medullary thyroid carcinomas in relation to the RET M918T mutation and clinical outcome. International journal of oncology. 2001;18(6):1219–25. doi: 10.3892/ijo.18.6.1219. Epub 2001/05/15. [DOI] [PubMed] [Google Scholar]
- 31.Hemmer S, Wasenius VM, Knuutila S, Franssila K, Joensuu H. DNA copy number changes in thyroid carcinoma. The American journal of pathology. 1999;154(5):1539–47. doi: 10.1016/S0002-9440(10)65407-7. Epub 1999/05/18. [DOI] [PMC free article] [PubMed] [Google Scholar]
- 32.Marsh DJ, Theodosopoulos G, Martin-Schulte K, Richardson AL, Philips J, Roher HD, et al. Genome-wide copy number imbalances identified in familial and sporadic medullary thyroid carcinoma. The Journal of clinical endocrinology and metabolism. 2003;88(4):1866–72. doi: 10.1210/jc.2002-021155. Epub 2003/04/08. [DOI] [PubMed] [Google Scholar]
- 33.Anwar F, Emond MJ, Schmidt RA, Hwang HC, Bronner MP. Retinoblastoma expression in thyroid neoplasms. Modern pathology : an official journal of the United States and Canadian Academy of Pathology, Inc. 2000;13(5):562–9. doi: 10.1038/modpathol.3880097. Epub 2000/05/29. [DOI] [PubMed] [Google Scholar]
- 34.Basolo F, Caligo MA, Pinchera A, Fedeli F, Baldanzi A, Miccoli P, et al. Cyclin D1 overexpression in thyroid carcinomas: relation with clinico-pathological parameters, retinoblastoma gene product, and Ki67 labeling index. Thyroid : official journal of the American Thyroid Association. 2000;10(9):741–6. doi: 10.1089/thy.2000.10.741. Epub 2000/10/21. [DOI] [PubMed] [Google Scholar]
- 35.Holm R, Nesland JM. Retinoblastoma and p53 tumour suppressor gene protein expression in carcinomas of the thyroid gland. The Journal of pathology. 1994;172(3):267–72. doi: 10.1002/path.1711720307. Epub 1994/03/01. [DOI] [PubMed] [Google Scholar]
- 36.Herfarth KK, Wick MR, Marshall HN, Gartner E, Lum S, Moley JF. Absence of TP53 alterations in pheochromocytomas and medullary thyroid carcinomas. Genes, chromosomes & cancer. 1997;20(1):24–9. Epub 1997/09/18. [PubMed] [Google Scholar]
- 37.Hinze R, Gimm O, Taubert H, Bauer G, Dralle H, Holzhausen HJ, et al. Regulation of proliferation and apoptosis in sporadic and hereditary medullary thyroid carcinomas and their putative precursor lesions. Virchows Archiv : an international journal of pathology. 2000;437(3):256–63. doi: 10.1007/s004280000233. Epub 2000/10/19. [DOI] [PubMed] [Google Scholar]
- 38.Yoshimoto K, Iwahana H, Fukuda A, Sano T, Saito S, Itakura M. Role of p53 mutations in endocrine tumorigenesis: mutation detection by polymerase chain reaction-single strand conformation polymorphism. Cancer research. 1992;52(18):5061–4. Epub 1992/09/15. [PubMed] [Google Scholar]
- 39.Pavelic K, Dedivitis RA, Kapitanovic S, Cacev T, Guirado CR, Danic D, et al. Molecular genetic alterations of FHIT and p53 genes in benign and malignant thyroid gland lesions. Mutation research. 2006;599(1-2):45–57. doi: 10.1016/j.mrfmmm.2006.01.021. Epub 2006/05/16. [DOI] [PubMed] [Google Scholar]
- 40.Sheikh HA, Tometsko M, Niehouse L, Aldeeb D, Swalsky P, Finkelstein S, et al. Molecular genotyping of medullary thyroid carcinoma can predict tumor recurrence. The American journal of surgical pathology. 2004;28(1):101–6. doi: 10.1097/00000478-200401000-00012. Epub 2004/01/07. [DOI] [PubMed] [Google Scholar]
- 41.Wander SA, Hennessy BT, Slingerland JM. Next-generation mTOR inhibitors in clinical oncology: how pathway complexity informs therapeutic strategy. The Journal of clinical investigation. 2011;121(4):1231–41. doi: 10.1172/JCI44145. Epub 2011/04/15. [DOI] [PMC free article] [PubMed] [Google Scholar]
- 42.Laplante M, Sabatini DM. mTOR signaling in growth control and disease. Cell. 2012;149(2):274–93. doi: 10.1016/j.cell.2012.03.017. Epub 2012/04/17. [DOI] [PMC free article] [PubMed] [Google Scholar]
- 43.Freed-Pastor WA, Prives C. Mutant p53: one name, many proteins. Genes & development. 2012;26(12):1268–86. doi: 10.1101/gad.190678.112. Epub 2012/06/21. [DOI] [PMC free article] [PubMed] [Google Scholar]
- 44.Faggiano A, Ramundo V, Dicitore A, Castiglioni S, Borghi MO, Severino R, et al. Everolimus is an active agent in medullary thyroid cancer: a clinical and in vitro study. Journal of cellular and molecular medicine. 2012;16(7):1563–72. doi: 10.1111/j.1582-4934.2011.01438.x. Epub 2011/09/03. [DOI] [PMC free article] [PubMed] [Google Scholar]
- 45.Grozinsky-Glasberg S, Rubinfeld H, Nordenberg Y, Gorshtein A, Praiss M, Kendler E, et al. The rapamycin-derivative RAD001 (everolimus) inhibits cell viability and interacts with the Akt-mTOR-p70S6K pathway in human medullary thyroid carcinoma cells. Molecular and cellular endocrinology. 2010;315(1-2):87–94. doi: 10.1016/j.mce.2009.09.027. Epub 2009/10/10. [DOI] [PubMed] [Google Scholar]
- 46.Dong M, Phan AT, Yao JC. New strategies for advanced neuroendocrine tumors in the era of targeted therapy. Clinical cancer research : an official journal of the American Association for Cancer Research. 2012;18(7):1830–6. doi: 10.1158/1078-0432.CCR-11-2105. Epub 2012/02/18. [DOI] [PubMed] [Google Scholar]
- 47.Vilar E, Perez-Garcia J, Tabernero J. Pushing the envelope in the mTOR pathway: the second generation of inhibitors. Molecular cancer therapeutics. 2011;10(3):395–403. doi: 10.1158/1535-7163.MCT-10-0905. Epub 2011/01/11. [DOI] [PMC free article] [PubMed] [Google Scholar]
- 48.Marino S, Vooijs M, van Der Gulden H, Jonkers J, Berns A. Induction of medulloblastomas in p53-null mutant mice by somatic inactivation of Rb in the external granular layer cells of the cerebellum. Genes & development. 2000;14(8):994–1004. Epub 2000/04/27. [PMC free article] [PubMed] [Google Scholar]
- 49.Wikenheiser KA, Vorbroker DK, Rice WR, Clark JC, Bachurski CJ, Oie HK, et al. Production of immortalized distal respiratory epithelial cell lines from surfactant protein C/simian virus 40 large tumor antigen transgenic mice. Proceedings of the National Academy of Sciences of the United States of America. 1993;90(23):11029–33. doi: 10.1073/pnas.90.23.11029. Epub 1993/12/01. [DOI] [PMC free article] [PubMed] [Google Scholar]
- 50.Wise-Draper TM, Allen HV, Jones EE, Habash KB, Matsuo H, Wells SI. Apoptosis inhibition by the human DEK oncoprotein involves interference with p53 functions. Molecular and cellular biology. 2006;26(20):7506–19. doi: 10.1128/MCB.00430-06. Epub 2006/08/09. [DOI] [PMC free article] [PubMed] [Google Scholar]
Associated Data
This section collects any data citations, data availability statements, or supplementary materials included in this article.


