Abstract
This paper presents a patch-based non-parametric approach to the correction of intensity inhomogeneity from magnetic resonance (MR) images of the human brain. During image acquisition, the inhomogeneity present in the radio-frequency coil, is usually manifested on the reconstructed MR image as a smooth shading effect. This artifact can significantly deteriorate the performance of any kind of image processing algorithm that uses intensities as a feature. Most of the current inhomogeneity correction techniques use explicit smoothness assumptions on the inhomogeneity field, which sometimes limit their performance if the actual inhomogeneity is not smooth, a problem that becomes prevalent in high fields. The proposed patch-based inhomogeneity correction method does not assume any parametric smoothness model, instead, it uses patches from an atlas of an inhomogeneity-free image to do the correction. Preliminary results show that the proposed method is comparable to N3, a current state of the art method, when the inhomogeneity is smooth, and outperforms N3 when the inhomogeneity contains non-smooth elements.
Keywords: intensity inhomogeneity, bias field, gain field, MRI, patch, segmentation, RF field inhomogeneity, non-uniformity, artifact correction
1. INTRODUCTION
Several core MR image processing tasks, like segmentation and registration, are heavily dependent on the quality of the images, because they use intensity as the principal feature. Any distortion of the intensities of the underlying tissue classes are reflected in the performance of the algorithm. One such distortion is the intensity inhomogeneity (IIH), also commonly known as the “bias field” or “gain field.” This is often caused by the presence of non-uniformity in the radio-frequency (RF) coil. IIH is typically assumed to be a smooth shading artifact in the image, as shown in Fig. 1(a). One of the major effects of IIH can be seen in Fig. 1(b) as a poor segmentation, while the segmentation can be improved after inhomogeneity correction, as shown in Figs. 1(d)–(e).
Figure 1.

(a) A slice of an MR volume obtained from a GE 4T scanner,15 (b) segmentation of the volume into 3 classes—cerebral-spinal fluid (CSF), gray matter (GM) and white matter (WM)—by Fuzzy C means (FCM),16 (c) estimated gain field using a non-parametric non-uniform intensity normalization (N3)12 method, (d) the corresponding inhomogeneity corrected image, (e) FCM16 segmentation of the N3 corrected image. The corrected image is a better representation of the tissues, where the intensities are more homogeneoous. This is reflected in the segmentation improvement in (e) from the gross error in (b).
The IIH for low magnetic field strengths (1T–3T) has been extensively studied and validated.1–4 It is common practice to assume that low magnetic field IIH is a smoothly varying non-anatomic multiplicative field. The IIH correction algorithms can be broadly categorized into two classes, prospective methods and retrospective methods. Prospective methods5,6 try to correct IIH using the prior informations about the acquisition parameters and the acquisition protocols used, usually by combining multiple datasets acquired under different acquisition parameters. These methods are often not suitable to large scale studies where the imaging parameters are not known or multiple datasets cannot be acquired with pre-determined parameters. Consequently, retrospective methods, which are post-processing techniques, are of importance. They usually exploit the smoothness assumption of the multiplicative field. Landmark based histogram normalization7,8 and entropy minimization9–11 techniques are common ways to estimate a smooth field. Another class of correction techniques is based on modeling the field as a linear combination of low degree polynomials,12–14 where the coefficients of the polynomials completely determine the field. The coefficients can be determined by the smoothness constraints,13 or a maximum likelihood type estimation using a statistical model on the image14 or by the frequency content of the image.12 Many of these techniques are paired with image segmentation techniques.
Here we propose an atlas based patch matching non-parametric IIH correction technique, in which the estimated bias field is not explicitly modeled as a linear combination of smoothly varying polynomials. As a result, our technique is more appropriate in situations where the actual IIH is not necessarily globally smooth or cannot be expressed as low degree polynomials, such as cases of systematic corruption of images and MR images acquired at higher field strengths, e.g. 7T.
2. METHOD
Consider an inhomogeneity corrupted image y. The effects of B0 and B1 inhomogeneity can be modeled as a multiplicative field and the image model is written as,
| (1) |
We do not assume any global parametric model of the field g; instead an estimate of g is obtained using an atlas. Let us define the atlas as an inhomogeneity free MR image x, having the same contrast and resolution as y. Let the image y and the atlas x be divided into non-overlapping 3D p × q × r patches y(j), x(k), j ∈ Ωy, k ∈ Ωx. Ωy and Ωx are the image domain of y and x, respectively. We want to find an IIH field g for the image y using the atlas patches with an assumption that the patches y(j) and x(k) are small enough so that g is constant for a patch. In other words, inhomogeneity field g is locally smooth.
For computational viability, The 3D patches are rasterized into d × 1 vectors, where d = pqr. Thus y(j) and x(k) become d × 1 vectors, ∀ j ∈ Ωy, ∀ k ∈ Ωx. Then a patch dictionary,
 , is created using the collection of all such atlas patches,
 = ⋃k∈Ωx {x(k)}, each column of
 being a patch from the atlas,
 ∈ ℝd×N, N = |Ωx| = the cardinality of Ωx. We assume that both x and y are normalized images such that their WM peak intensities are unity. Now, with a locally smooth assumption of g, Eqn. 1 is reformulated as,
| (2) |
Here, the field g is also assumed to be composed of patches g(j), j ∈ Ωy, and for any jth patch, g(j) = gj is assumed to be a constant.
The idea of the atlas based patch matching method is that the normalized and inhomogeneous image patches y(j) can be written as a linear combination of a few homogeneous atlas patches x(k) taken from
 ,
,
| (3) |
where N is the size of the dictionary
 and the coefficients αkj should be mostly zero and must be estimated. This model has been proven to be very effective in interpolation and super-resolution,17 as well as intensity mapping.18 Combining Eqn. 2 and Eqn. 3, we see that
. Here we note that the set of atlas patches x(k) being same for all j ∈ Ωy. Then, in absence of any inhomogeneity, a good approximation of the inhomogeneity free patch ŷ(j) is the weighted average of the atlas patches x(k) with a normalized version αkj’s,
| (4) |
Using this approximation of ŷ(j), Eqn. 2 gives an estimate for the gain field as,
| (5) |
To solve this equation for gj, αkj’s are first obtained by solving the linear program given in Eqn. 3 using the simplex algorithm.19 Then an estimate of gj is obtained by a least square approximation from Eqn. 5,
| (6) |
The final gain field g is obtained by combining all such gj’s ∀ j ∈ Ωy.
Typically, for a 181 × 217 × 181 Brainweb phantom,20 usually N is very large, N ≈ 100,000. It is computationally expensive to solve Eqn. 3 with such a large parameter space. So to reduce the computation burden, we randomly choose M columns from
 and solve Eqn. 3 with those M patches x(j), j = 1, …, M. For computational feasibility, we use M = 1000. The patch based field sometimes contains “blockiness” because the patches are non-overlapping and every patch is treated independently. We overcome this problem by smoothing it by a Gaussian kernel of standard deviation σ.
3. RESULTS
3.1 Phantom Experiment
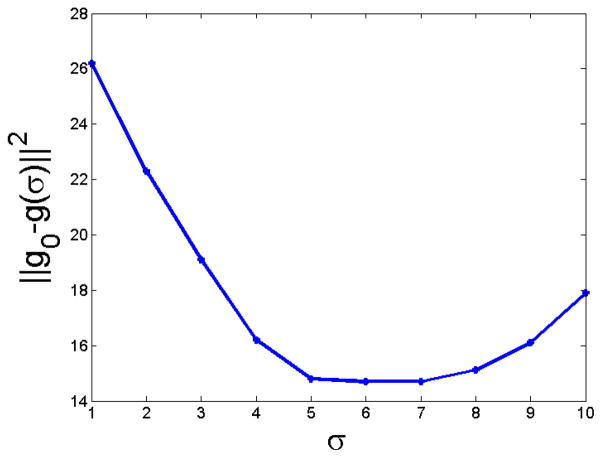
First, we show that when the inhomogeneity is smooth, our method gives comparable results to a current state of the art method called N3.12 We used one phantom from Brainweb,20 which is an axial 181 × 217 × 181 image having 3% noise and a smooth inhomogeneity field, referred to as “field C” on the website. A slice is shown in Fig. 2(a) and the actual gain field is shown in Fig. 2(b). We used another inhomogeneity free Brainweb phantom having 0% noise as the atlas. As our method is patch based and each individual patch is treated separately, the resultant field g becomes “blocky.” g is smoothed by a Gaussian filter of size σ to get a smoothed version of the field g(σ). An optimal σ is estimated such that the squared difference between the true field (field C, g0) and the smoothed field g(σ) is small,
Figure 2.

(a) A Brainweb20 phantom, 20% inhomogeneity, (b) true gain field, (c) gain field obtained from N3, (d) smoothed gain field obtained using the patch-based algorithm, (e) difference between true field and N3 field, (f) difference between true field and the one obtained using our method. For smooth fields, patch based method works comparably with N3, where the coefficient of variation (CV) between (b) and (c) is 0.0101 and CV between (b) and (d) is 0.0110. These results are comparable to ones reported earlier.9
| (7) |
Fig. 3 shows the plot of σ in mm and squared error, and the optimal σ = 6mm. We use this σ for all the subsequent experiments.
Figure 3.
Plot of Gaussian filter size σ (in mm) vs the squared error between smoothed field and true field (||g0 − g(σ)||2) for a Brainweb20 phantom, having 20% inhomogeneity and 3% noise. Optimal σ = 6mm.
The estimated field from N3 is shown in Fig. 2(c) and the 6mm Gaussian smoothed version of our field is shown in Fig. 2(d). The difference between the actual field and the estimated fields are shown in Fig. 2(e) and Fig. 2(f) for N3 and our method, respectively. To compare the two fields, we use the coefficient of variation, defined as , where Be and Ba are the estimated and the applied field, respectively. C = 0.0101 for the N3 field, and C = 0.0110 for our patch based field. Both of these results are comparable to the ones reported earlier.9
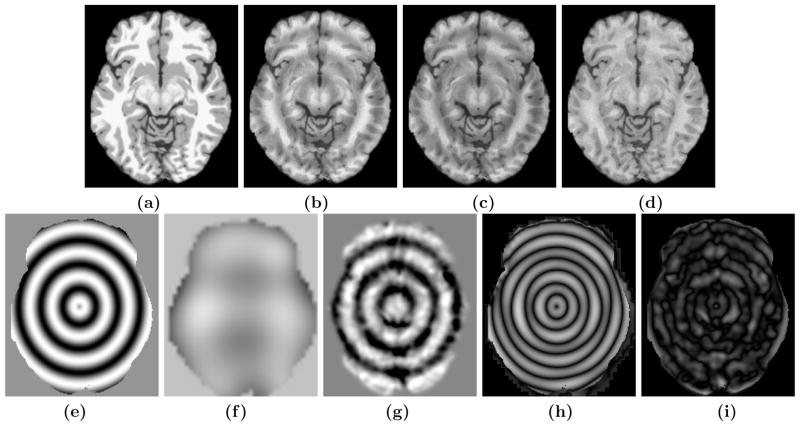
For smooth low-frequency fields, our method does not give much improvement over N3. If the field is locally smooth but not globally, our method gives better performance over N3. To show this improvement, we generated an artificial sinusoidal inhomogeneity field and used it on the Brainweb subject from the previous experiment. A slice of the image and the applied field are shown in Fig. 4(a) and Fig. 4(e). N3 fails on this image, producing a very smooth field (Fig. 4(f)), while our method produces a better approximation (Fig. 4(g)) of the true field. This can also be observed from the corrected images (Fig. 4(c) and Fig. 4(d)). The coefficient of variations are 0.34 and 0.09 for N3 and our method, respectively.
Figure 4.
(b) Original inhomogeneity free Brainweb phantom, (b) phantom with artificial inhomogeneity, (c) N3 corrected image, (d) patch-based correction, (e) applied true gain field, (f) N3 field, (g) smoothed patch-based field, (h) difference between applied and N3 field, (i) difference between applied and our field.
3.2 Experiment on Real Data
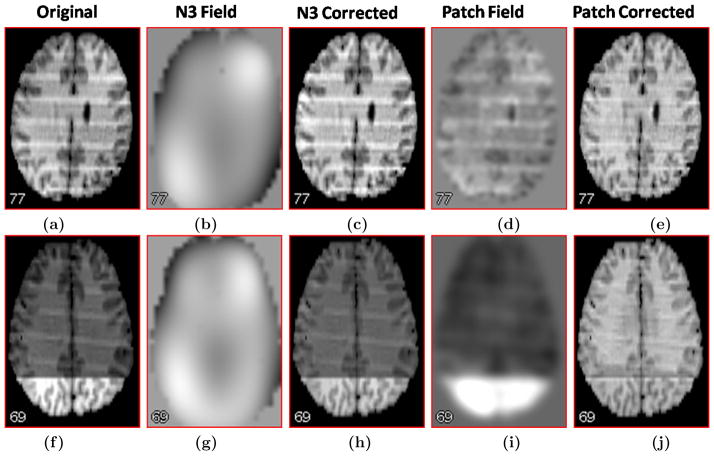
We tested our algorithm on two IBSR (Internet Brain Repository System) datasets (Fig. 5(a) and Fig. 5(f)), that contains a smooth inhomogeneity as well as a sinusoid like bias. As seen in Fig. 5(b) and Fig. 5(g), N3 does not perform well on these highly corrupted images. Our patch-based method, having no global smoothness assumption, captures the variability of the inhomogeneity as well as the artifact and produces visually better correction, as seen in Fig. 5(e) and Fig. 5(j).
Figure 5.
(a) Original image, (b) gain field from N3, (c) corrected image using N3, (d) patch-based gain field, smoothed using a 5mm Gaussian kernel, (e) the corrected image using the patch-based gain field, (f) – (j) similar images for another IBSR subject with almost sinusoidal inhomogeneity and an intensity artifact near temporal lobe. N3 cannot recover the sinusoid looking field as well as the artifact, while our method recovers the field to some extent.
4. DISCUSSION AND FUTURE WORK
In some cases, the gain field in MR images has structural information present. In such cases, methods that assume smoothly varying bias fields will not perform well. Preliminary results show that our patch-based inhomogeneity correction method is more flexible to correct locally non-smooth inhomogeneities. Although our method currently uses a small smoothing kernel for postprocessing, this step can, in principle, be incorporated into the algorithm using patch-based smoothing methods. Additional next steps include evaluation of our method on 7T MR data, which is not necessarily smooth.21
References
- 1.Belaroussi B, Milles J, Carme S, Zhu YM, Benoit-Cattin H. Intensity non-uniformity correction in MRI: Existing methods and their validation. Med Image Anal. 2006;10(2):234–246. doi: 10.1016/j.media.2005.09.004. [DOI] [PubMed] [Google Scholar]
- 2.Hou Z. A Review on MR Image Intensity Inhomogeneity Correction. Intl Journal of Biomed Imag. 2006;2006(49515) doi: 10.1155/IJBI/2006/49515. [DOI] [PMC free article] [PubMed] [Google Scholar]
- 3.Vovk U, Pernus F, Likar B. A review of methods for correction of intensity inhomogeneity in MRI. IEEE Trans Med Imaging. 2007;26(3):405–421. doi: 10.1109/TMI.2006.891486. [DOI] [PubMed] [Google Scholar]
- 4.Boyes RG, Gunter JL, Frost C, Janke AL, Yeatman T, Hill DL, Bernstein MA, Thompson PM, Weiner MW, Schuff N, Alexander GE, Killiany RJ, DeCarli C, Jack CR, Fox NC ADNI. Intensity non-uniformity correction using N3 on 3-T scanners with multichannel phased array coils. Neuro Image. 2008;39(4):17521762. doi: 10.1016/j.neuroimage.2007.10.026. [DOI] [PMC free article] [PubMed] [Google Scholar]
- 5.Liney GP, Turnbull LW, Knowles AJ. A simple method for the correction of endorectal surface coil inhomogeneity in prostate imaging. Journal Magn Resn Imaging. 1998;8(4):994–997. doi: 10.1002/jmri.1880080432. [DOI] [PubMed] [Google Scholar]
- 6.Mihara H, Iriguchi N, Ueno S. A method of RF inhomogeneity correction in MR imaging. Mag Res Mat in Phys, Bio and Med. 1998;7(2):115120. doi: 10.1007/BF02592235. [DOI] [PubMed] [Google Scholar]
- 7.Nyul LG, Udupa JK, Zhang X. New variants of a method of MRI scale standardization. IEEE Trans on Med Imaging. 2000;19(2):143–150. doi: 10.1109/42.836373. [DOI] [PubMed] [Google Scholar]
- 8.Nyul LG, Udupa JK. On Standardizing the MR Image Intensity Scale. Mag Res in Medicine. 1999;42(6):1072–1081. doi: 10.1002/(sici)1522-2594(199912)42:6<1072::aid-mrm11>3.0.co;2-m. [DOI] [PubMed] [Google Scholar]
- 9.Manjon JV, Lull JJ, Carbonell-Caballero J, Garcia-Marti G, Mart-Bonmati L, Robles M. A nonparametric MRI inhomogeneity correction method. Med Image Anal. 2007 Mar;11:336–345. doi: 10.1016/j.media.2007.03.001. [DOI] [PubMed] [Google Scholar]
- 10.Mangin JF, Joliot F. Entropy Minimization for Automatic Correction of Intensity Nonuniformity. IEEE Workshop on Math. Methods in Biomed. Image Anal; June 2000.pp. 162–169. [Google Scholar]
- 11.Weisenfeld N, Warfield SK. Normalization of joint image-intensity statistics in MRI using the Kullback-Leibler divergence. IEEE Symp Biomed Imag. 2004;7:101104. [Google Scholar]
- 12.Sled JG, Zijdenbos AP, Evans AC. A non-parametric method for automatic correction of intensity non-uniformity in MRI data. IEEE Trans on Med Imag. 1998;17(1):87–97. doi: 10.1109/42.668698. [DOI] [PubMed] [Google Scholar]
- 13.Pham DL, Prince JL. Adaptive Fuzzy Segmentation of Magnetic Resonance Images. IEEE Trans on Med Imag. 1999;18(9):737–752. doi: 10.1109/42.802752. [DOI] [PubMed] [Google Scholar]
- 14.Styner M, Brechbuhler C, Szekely G, Gerig G. Parametric Estimate of Intensity Inhomogeneities applied to MRI. IEEE Trans on Med Imag. 2000;19(3):153–165. doi: 10.1109/42.845174. [DOI] [PubMed] [Google Scholar]
- 15.Friedman L, Stern H, Brown GG, Mathalon DH, Turner J, Glover GH, Gollub RL, Lauriello J, Lim KO, Cannon T, Greve DN, Bockholt HJ, Belger A, Mueller B, Doty MJ, He J, Wells W, Smyth P, Pieper S, Kim S, Kubicki M, Vangel M, Potkin SG. Test-Retest and Between-Site Reliability in a Multicenter fMRI Study. Human Brain Mapping. 2008 Aug;29:958–972. doi: 10.1002/hbm.20440. [DOI] [PMC free article] [PubMed] [Google Scholar]
- 16.Bezdek JC. A Convergence Theorem for the Fuzzy ISO-DATA Clustering Algorithms. IEEE Trans on Pattern Anal Machine Intell. 1980;20(1):1–8. doi: 10.1109/tpami.1980.4766964. [DOI] [PubMed] [Google Scholar]
- 17.Freeman WT, Jones TR, Pasztor EC. Example-Based Super-Resolution. IEEE Comp Graphics and Appl. 2002;22(2):56–65. [Google Scholar]
- 18.Roy S, Carass A, Prince JL. Synthesizing mr contrast and resolution through a patch matching technique. Proc SPIE. 2010 Mar;7623:76230J. doi: 10.1117/12.844575. [DOI] [PMC free article] [PubMed] [Google Scholar]
- 19.Grant M, Boyd S. Graph implementations for nonsmooth convex programs. Recent Adv in Learning and Control. 2008:95–110. Lecture Notes in Control and Information Sciences. [Google Scholar]
- 20.Cocosco CA, Kollokian V, Kwan RKS, Evans AC. Adaptive Fuzzy Segmentation of Magnetic Resonance Images. Neuro Image. 1997;5(4):S425. [Google Scholar]
- 21.de Moortele PFV, Auerbach EJ, Olman C, Yacoub E, Ugurbil K, Moeller S. T1 weighted Brain Images at 7 Tesla Unbiased for Proton Density, T2* contrast and RF Coil Receive B1 Sensitivity with Simultaneous Vessel Visualization. Neuroimage. 2009;46(2):432–446. doi: 10.1016/j.neuroimage.2009.02.009. [DOI] [PMC free article] [PubMed] [Google Scholar]


