

Abstract
Retinitis pigmentosa (RP) is a family of inherited diseases causing progressive photoreceptor death. Retinal ganglion cells (RGCs) form the biological substrate for various therapeutic approaches designed to restore vision in RP individuals. Assessment of survival and preservation of RGCs in animal paradigms mimicking the human disease is of key importance for appropriate implementation of vision repair strategies. Here we studied the survival of RGCs in the rd1 mutant mouse, a known model of early onset, autosomic recessive RP, at various stages of photoreceptor degeneration. Furthermore, we analyzed the morphology of various types of RGCs using the newly generated transgenic mouse rd1/Thy1-GFP, in which the rd1 mutation is associated with green fluorescent protein (GFP) expression in a small population of different RGCs. We found excellent survival of cells at up to 1 year of age, a time at which the inner retina is known to have severely reorganized and partially degenerated. However, 50% of the cells analyzed within all RGC types exhibit an undersized dendritic tree, spanning about half of the normal area. Undersized cells are found both in adult and in very young (1-month-old) mice. This suggests that their aberrant phenotype is due to incomplete dendritic development, possibly as a consequence of altered visual input at the time of dendritic arbor refinement. These data show the importance of the timing of photoreceptor death in RGC dendritic development.
INDEXING TERMS: retinitis pigmentosa, ganglion cell, dendrites, remodeling, survival
Retinal ganglion cells (RGCs) are the only projection neurons of the retina and collectively transmit visual information to higher visual centers. These heterogeneous cells exhibit a close correlation between morphology and function. RGCs with dendrites layered in the outer half of the retinal inner plexiform layer (IPL) signal light decrements and are named OFF-RGCs, while cells with dendrites confined in the IPL innermost tier signal light increments and are known as ON-RGCs. Different types of RGCs transmit different representations of the visual input to the brain using specific codes. The best-known codes are the one used by cells with small receptive fields and with relatively sustained responses to light and linear spatial summation (X-RGCs), and the other by cells showing a larger receptive field, phasic responses, and nonlinear spatial summation (Y-RGCs). Among RGCs with wide dendritic trees, some process rapid movements while cells associated with fine contour perception belong to types with small and bushy arbors (Sernagor et al., 2001). Altogether, different classifications report the occurrence of 12 to 20 different types of RGCs in the mammalian retina (Rockhill et al., 2002). The morphological diversity of these neurons is a reflection of their variety of physiological properties.
RGCs represent one of the platforms of choice for repair of retinal pathologies such as retinitis pigmentosa (RP). This is a family of diseases in which a genetically caused degeneration of rod photoreceptors is followed by the secondary death of cones with subsequent loss of sight (Hartong et al., 2006). Experimental approaches to treat RP comprise the implant of light sensitive, electronic prostheses stimulating the inner retina and RGCs directly (Chader et al., 2009), and the possibility to endow RGCs with light sensitivity by transgenic expression of photopigments (Lagali et al., 2008; Lin et al., 2008; Thyagarajan et al., 2010). Obviously, the successful outcome of these approaches depends on long-term viability of RGCs.
Data based on rodent RP models demonstrate that the effects of photoreceptor degeneration propagate to the inner retina, leading to regressive remodeling and death of some types of inner neurons (Strettoi and Pignatelli, 2000; Marc and Jones, 2003; Strettoi et al., 2002; Marc et al., 2003, 2007; Cuenca et al., 2004; Pignatelli et al., 2004; Gargini et al., 2007). However, little is known of the effects of photoreceptor demise on RGCs. Even the exact entity of RGC survival is undetermined, since their loss is considered to be from mild to severe in retinas from human RP donors (Stone et al., 1992; Humayun et al., 1999; Santos et al., 1997; Eng et al., 2011). A decrease in RGC size and number has been reported for the rd1 mouse, a model of early onset RP (Grafstein et al., 1972), although a later study has shown high preservation of RGCs in the same mutant (Eisenfeld et al., 1984). Focal RGC loss and profound remodeling were reported in aged human RP subjects and rd1 mice (Marc et al., 2007; Eng et al., 2011). Recently, our laboratory showed excellent survival and preservation of RGC morphology in the rd10 mouse, a relatively mild paradigm of RP (Mazzoni et al., 2008). Possibly, the entity of RGC regression and functional alteration is linked to the aggressiveness and time of onset of the underlying causative mutation. High genetic heterogeneity of RP makes it difficult to predict a paradigm of RGC effects unless phenotypes caused by mutations with different time of onset and severity are compared systematically. Here we try to fill this gap studying survival and morphology of RGCs in the newly generated rd1/Thy1 green fluorescent protein (GFP)-M mouse, which combines the rd1 mutation with GFP expression in a small number of these neurons.
MATERIALS AND METHODS
Animals
Experimental procedures were in accordance with Italian institutional guidelines and with the Association for Research in Vision and Ophthalmology statement for the use of animals in research. C3H/HeJ mutants, homozygous for the rd1 mutation (from here on, rd1 mice) and C57BL/6J wildtype (WT) control mice were kept in a local facility with water and food ad libitum on a 12/12-hour light/dark cycle, with illumination levels <60 lux. Homozygous mice for the Thy1-GFP allele were derived by breeding from the B6.Cg-Tg(thy1-GFP)/J strain originally devised by J.R. Sanes (Feng et al., 2000) and will be referred to as Thy1-GFP-M from here on. A new line of mice, C3H/HeJ/Tg(Thy1-GFP-M)JRS/RHM, from here on named rd1/Thy1-GFP, was obtained by crossing rd1 with Thy1-GFP-M mice. Thy1-GFP-M mice were first crossed with homozygous rd1/rd1 animals. Individuals obtained from the first generation (F1) were backcrossed with rd1/rd1 animals, obtaining the F2. Rd1/Thy1-GFP mice used belonged to the 9th (F9) generation, considered clean from background strain effects.
Isolation of rd1/Thy-GFP mice
Genotyping was performed by polymerase chain reaction (PCR) on tail-extracted DNA of F2 individuals to identify Thy1-GFP-positive animals. The following primers were used: Thy1-GFP forward (F) (AAGTTCATCTGCACCACCG) and Thy2-GFP reverse (R) (TCCTTGAAGAAGATGGTGCG), following a protocol recommended by the Jackson Laboratories (Bar Harbor, ME). The PCR amplification of the corresponding 173 bp fragment was performed in 35 cycles, with denaturation, annealing, and elongation at 94, 61, and 72°C, respectively, for 30 seconds, 1 minute, and 1 minute (initial denaturation at 94°C for 1.5 minutes, final elongation at 72°C for 2 minutes).
To identify mice homozygous for the rd1 mutation among Thy1-GFP-M-positive individuals, a second PCR was performed. In this case the primers were as follows: rd 81 (F) (ACCTGCATGTGAACCCAGTATT); rd2 (F) (AGAAG AAGTAGAATCACGTGAATAAAAGAT); rd 82 (R) (ACCCATG TCCTACAGCCCCTCTCCAA).
The corresponding PCR amplification was performed in 30 cycles by denaturation, annealing, and elongation at 94, 60, and 72°C, respectively, for 1 minute, 30 seconds, and 1 minute (initial denaturation at 94°C for 3 minutes; final elongation at 72°C for 7 minutes). The homozygous rd1 mutation is revealed by the presence of a single band having a size of 650 bp, while in rd1/WT heterozygous mice a second 247 bp band is amplified too.
As expected, progeny were viable and fertile. Heterozygous mice were backcrossed nine times with rd1 individuals to obtain a pure C3H background. The presence of the Thy1-GFP allele was verified by PCR genotyping. Unexpectedly, the number of labeled RGCs in rd1/rd1 mice heterozygous for the Thy1-GFP allele was about one-third (average of 15 cells per retina) of that observed in Thy1-GFP-M founders (about 50 cells per retina). However, after subsequent crossing, these mice produced double homozygous individuals (rd1/Thy1-GFP mice) and we observed again a number of labeled GCs comparable to that of the founder. This is the first time in which a correlation was observed between copies of the Thy1-GFP allele and number of GFP-positive ganglion cells.
Genetic background effects did not appear to modify any of the measured parameters, as RGC measurements from rd1/Thy1-GFP mice backcrossed three times into the C3H background (referred to as F3 generation) displayed no significant differences from those belonging to the F9 (“clean”) generation. Photoreceptor degeneration in rd1/Thy1-GFP individuals was confirmed by ethidium homodimer-2 fluorescence staining of DNA on retinal sections previously treated with RNAse A and showing the expected thinning of the outer nuclear layer (Fig. 1).
Figure 1.
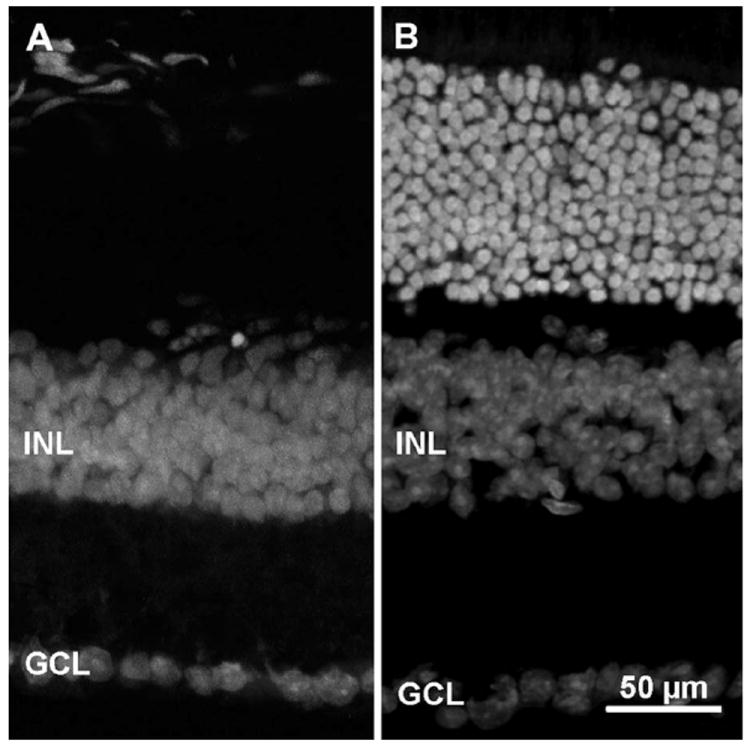
Vertical sections of retinas from rd1/Thy1-GFP transgenic (A) and C57Bl6J, wildtype (B) mice after fluorescent nuclear staining. Age is 3 months. Note the absence of the outer nuclear layer (ONL) in A after extensive photoreceptor degeneration. INL, inner nuclear layer; GCL, ganglion cell layer.
Cell measurement methods
For each RGC we measured the following parameters: 1) the diameter of the dendritic tree, obtained measuring with MetaMorph the area of the smallest 2D convex polygon traced joining the outermost dendritic tip on a projection of the dendritic arborization when collapsed along the z-axis; this measure was repeated three times for each cell; the average dendritic tree area was then used to calculate the diameter, assuming a circular shape of the tree; 2) the diameter of the RGC body, measured after tracing the contour of the projection of the cell body, obtained from a separate set of confocal images; 3) the mean stratification depth of the RGC dendritic arborization within the IPL, measured on orthogonal projections of the cells obtained from confocal z series, as reported (Badea and Nathans, 2004); 4) the shape of the dendritic arbor, according to the description of Sun et al. (2002), as well as following Kong et al. (2005) and Coombs et al. (2006); this feature constitutes a blueprint of a cell type and allows the distinction among cells sharing some morphometric parameters.
Survival in the ganglion cell layer (GCL)
Rd1 mice, aged 4.5 and 12 months, were deeply anesthetized with intraperitoneal injections of 3-bromo-ethanol (Avertin; 0.1 ml/5 g body weight) and killed by cervical dislocation after eye removal. A reference on the dorsal pole of each eye was taken with a laboratory marker, an eye cup was dissected and fixed in 4% paraformaldehyde (PFA) in 0.1M phosphate buffer, PB, pH7.2, for 1 hour at 4°C. The retina was separated from the pigment epithelium and flattened by making four radial cuts toward the head of the optic nerve. Retinal whole mounts (n = 3 for 4.5-month-old and n = 4 from 1-year-old mice) were rinsed 3 × 15 minutes in phosphate-buffered saline (PBS) and incubated in a solution of RNase A (Invitrogen, La Jolla, CA; 1:1,000 in PBS) at 37°C for 1 hour, rinsed in PBS, and then stained with 2 μM ethidium homodimer-2 (Invitrogen) for 1 hour at room temperature on a shaker, prior to mounting on glass slides. Confocal microscopy was used to obtain serial optical sections at 1-μm intervals encompassing the entire thickness of the GCL using a 40× PL APO 1.25 oil objective. Sampling areas were 32 fields (250 × 250 μm) per retina, regularly spaced along the dorsal–ventral and nasal–temporal retinal meridians. Counts of cells were performed on extended-focus images of the GCL, covering an average thickness of 20 μm on the z plane (Fig. 2A,B). Endothelial and perivascular cells were excluded from the counts on the basis of their characteristic shape and high intensity of nuclear staining. Astrocytes were excluded for their extension to the optic fiber layer (OFL), where axons of RGCs reside. The total number of cells per retina was obtained by multiplying average cellular densities by corresponding total retinal areas. The latter were measured with an image analyzer on whole mount, low-power images obtained with a Zeiss Axioplan microscope using brightfield illumination. Statistical analysis (t-test) on cell counts was performed with Origin 7.0 (v. 7SR1; OriginLab, Northampton, MA) and SigmaStat 3.1 (build 3.10.00; Systat Software, Point Richmond, CA). P-values lower than 0.05 were considered significant.
Figure 2.
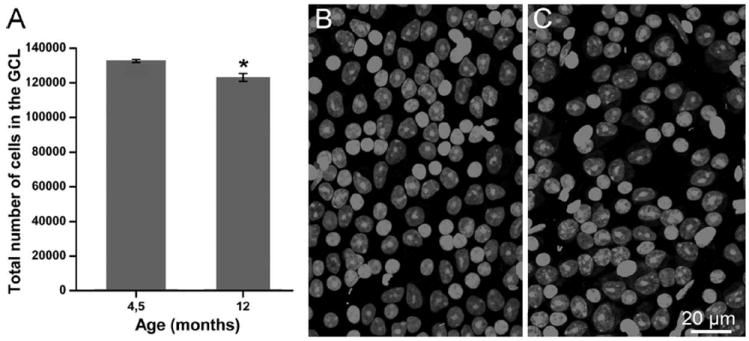
A: Diagram of the total number of cells in the ganglion cell layer (GCL) of retinas from rd1 mice aged 4.5 months and 1 year. The difference from the two groups is around 6%. B,C: Confocal images of whole mount views of the ganglion GCL of retinas from rd1 mice aged 4.5 months (B) and 1 year (C). Retinal periphery. Ethidium nuclear staining. Images of this type were used to count cells in the GCL layer for survival studies.
Immunocytochemistry
Retinal whole mounts (n = 65) were isolated as above from rd1/Thy1-GFP-M mice, aged 1, 4, 5, 9, and 12 months, washed extensively in 0.1M PB, and blocked overnight in a solution with 0.5% Triton-X 100, 10% serum of the species in which the secondary antibody was raised, 5% bovine serum albumin (BSA) in PBS 0.01M, pH 7.4 at 4°C. To intensify GFP fluorescence, whole retinas were incubated in a 1:500 solution of rabbit anti-GFP-Alexa Fluor 488 with 0.1% Triton X-100, 1% serum, 1% BSA in PBS, for 2 days at 4°C. Retinal specimens were rinsed 3 × 15 minutes in PBS, incubated in RNase A, rinsed again, and counterstained with ethidium homodimer-2. Retinas were rinsed in PBS, mounted on glass slides “ganglion cells up” with Vectashield (H1000; Vector Laboratories, Burlingame, CA), and inspected with a Zeiss Axioplan fluorescence microscope, using 5 or 10× objectives. GFP-positive RGCs were localized and imaged at low magnification with a Zeiss Axiocam color camera. Subsequently, well isolated RGCs were scanned with a Leica TCS-SL spectral confocal microscope (Leica Microsystems) equipped with a helium-neon laser, at resolutions of 1024 × 1024 pixels. Images were obtained using a 40× Plan Neofluar oil objective, with a 1.25 numerical aperture. Z-stacks were obtained encompassing the optic fiber, ganglion cell, inner plexiform, and innermost part of the inner nuclear layers. The distance between adjacent focal planes was set at a constant value (1.0042 μm). Image files were saved in tiff format and analyzed offline with MetaMorph (v. 5.0r1 Molecular Devices, Sunnyvale, CA), to perform 3D reconstructions, computer rotations, and measurements.
For SMI-32 staining the protocol was identical to that followed for GFP immunocytochemistry.
For melanopsin immunocytochemistry we followed the protocol of Berson et al., (2010), which reveals predominantly the M1 subtype of melanopsin cells. Briefly, incubations in blocking solution, primary and secondary antibodies were carried on at room temperature, in the presence of 0.5% dimethyl sulfoxide (DMSO) and 2% Triton X-100. The antigen-antibody complex was revealed by biotinylated secondary antibodies followed by incubation in a diaminobenzidine (DAB) histochemistry kit (P6100 Elite ABC Kit, Vector Laboratories). Retinal samples (n = 3 retinas from mice aged 3 months) were mounted in glycerol and observed by brightfield microscopy. A number of 14 M1 melanopsin-positive GCs were used for Neurolucida tracing, which was performed by live observation of immunostained cells and tracing by through-focusing across their dendritic arbors. Two additional sets of rd1/Thy1-GFP (n = 3) and WT retinas (n = 3) were used to stain melanopsin-positive GCs using the same immunofluorescence protocol followed for GFP labeling. The ganglion cell layer of retinal whole mounts was sampled systematically with a Zeiss Axiocam color camera attached to a fluorescence microscope. Thirty-two fields (210 × 170 μm) were acquired for each retina. Images were used to measure the diameter of melanopsin-positive GCs bodies (n = 300 for both rd1 and WT samples) with Metamorph and to build histograms of their distribution.
For axonal initial segment (AIS) immunocytochemistry, rd1/Thy1-GFP M mice aged 1 and 12 months and C57BL/6J adult mice were killed by cervical dislocation, their eyes enucleated, and retinas isolated in HEPES buffered AMES medium, pH 7.4, at 4°C. Retinal samples were fixed with 4% PFA in 0.1M cacodylate buffer, pH 7.4, for 5 minutes at 4°C and rinsed in PBS. Retinas were blocked as described above, then incubated in 1/100-1/200 rabbit anti-NaV1.6 (Millipore, Billerica, MA). Additional preparations were incubated in 1/500–1/1,000 mouse monoclonal antibody anti-Ankyrin G (clone N 106-36, NeuroMabs, Davis, CA) for 4 days. Retinas were successively washed in PBS for 2 hours and reacted with 1/400 Alexa Fluor 568 goat antirabbit or goat antimouse secondary antibodies in blocking solution. For double labeling, incubation with anti-ankyrin G antibodies was performed first and revealed with Alexa 647 goat anti-mouse secondary antibodies. NaV1.6 staining was then carried out and revealed with Alexa Fluor 568 goat antirabbit secondary antibodies. Finally, retinas were washed in PBS and mounted on glass slides as above. AISs were identified by confocal microscopy via colocalization with green signal of native GFP expressed by axons of labeled RGCs. AIS length and distance from cell bodies were measured on confocal images with Metamorph. Data were analyzed with SigmaStat 3.1 and plotted with Origin 7.0.
Antibody characterization
Please see Table 1 for a list of all the antibodies used.
TABLE 1.
List of Antibodies
| Antibody name | Immunogen structure | Manufacturer, catalog and other information | Dilution |
|---|---|---|---|
| Green fluorescent protein (GFP) | Green fluorescent protein (GFP) isolated from the jellyfish Aequorea victoria. The IgG fraction was purified by ion-exchange chromatography | Invitrogen srl, Milan, Italy Rabbit polyclonal # A21311. | 1:500 |
| Neurofilaments | Purified neurofilaments | Covance, Princetown, NJ, USA Mouse monoclonal #SMI-32 | 1:100 |
| Melanopsin | Synthetic peptide consisting of the 15 N-terminal amino acids of mouse melanopsin (GenBank Accession NP-038915) conjugated to keyhole limpet hemocyanin. | Rabbit polyclonal #UF006 Kindly donated by Dr. Ignacio Provencio University of Virginia, Charlottesville, VA, USA | 1:2,500 |
| Ankyrin G | Fusion protein containing a 6xHis sequence and amino acids 920/994 of human Ankyrin-3 (or ANK-3 or ankyrin- 3, or Ankyrin-G, accession # E9PE32) encompassing all of Ankyrin G with the exception of the ankyrin repeats. | UC Davis/NIH NeuroMab Facility, Davis, CA, USA Mouse monoclonal. clone N 106-36. #75-146 Lot 441-4BK-91B | 1:500-1:1,000 |
| Sodium channel (Nav1.6) | Peptide corresponding to amino acids 1042-1061 from mouse Scn8a (Accession number AAD20438). | Millipore, Billerica, MA, USA Rabbit polyclonal # AB5580. | 1:100 |
| 1:200 | |||
| Lot #PS01420040 | |||
| The recognized epitope corresponds to the intracellular loop between II and III domains of Scn8a. |
The GFP antibody only stains cell types showing GFP-specific fluorescence in tissues from GFP-transgenic mice. The melanopsin UF006 antiserum (kindly donated by I. Provencio) was raised in rabbits using as immunogen a peptide consisting of the 15 N-terminal amino acids of the mouse melanopsin with an appended C-terminal cysteine (MDSPSGPRVLSSLTQC), conjugated to keyhole limpet hemocyanin (Panda et al., 2002). Specificity was confirmed in control studies showing a dose-dependent decrease of immunoreactivity by preadsorption with the immunogen and by the lack of staining in the retinas of melanopsin-null mice (Panda et al., 2002). The staining we obtained confirmed GC types previously described in the mouse retina with the same method (Berson et al., 2010).
The SMI-32 antibody reacts with a nonphosphorylated epitope in the heavy (H) subunit of neurofilaments. On conventional immunoblots from human cerebellum SMI 32 visualizes two bands (200 and 180 kDa) which merge into a single NFH line on 2D blots. On isolated neurofilaments, the SMI-32 immunoreaction is masked when the epitope is phosphorylated. This antibody has been extensively used for staining neurons in various areas of the central nervous system (CNS) (Soares et al., 2008) and ganglion cells in the retina (Jakobs et al., 2005).
The sodium channel (Nav1.6, TypeVI sodium channel, NaCh6, PN4, CerIII) antibody was raised against a peptide corresponding to amino acids 1042–1061 from mouse Scn8a. Staining is usually restricted to the initial segments of axons and to Ranvier nodes of spiking neurons (Van Wart and Matthews, 2006b) and the pattern we observed in the retina coincides with previously published data (Van Wart and Matthews, 2006a). Staining is eliminated by preincubation of the antibody with the control antigen provided by the producer.
The monoclonal antibody recognizing ankyrin G was generated against a fusion protein containing a 6xHis sequence and a unique peptide in the spectrin-binding domain of the protein. The antibody tests positive by enzyme-linked immunosorbent assay (ELISA) versus the recombinant protein immunogen and its staining pattern has been characterized in a previous study (Van Wart et al., 2007), demonstrating it labels specifically a subdomain of the initial segment of the axon in rat retinal ganglion cells, where it colocalizes with the sodium-channel Nav 1.6.
Classification of RGCs
RGCs were classified following Sun et al. (2002). A total of 277 GFP-labeled RGCs were classified; of these, 109 belonging to four types largely represented in the mouse retina, namely, B3 inner and outer, C2 inner and outer, were selected for statistical analysis. GFP-labeled cells with regular and abnormal morphology were grouped separately. We compared data of RGCs from 1-month-old retinas with data from older retinas (4–12 months). Data for WT, control mice, were from previously analyzed cells from adult mice of the C57Bl6/Thy1-GFP-M strain (Mazzoni et al., 2008).
Neurolucida analysis
Quantitative analysis of the morphology and complexity of dendritic trees of undersized RGCs of B3 and C2 types was carried on tracing the dendritic arbors of samples of these cells (belonging to both inner and outer types) along their whole 3D extension by means of a Neurolucida package (3.2 v., MicroBrightField, Williston, VT). The resulting traces were then analyzed with a Neuro-Explorer software routine. For each cell we took into account the total dendritic area, the total dendritic length (TDL), and total number of nodes (points of bifurcation). Data from rd1/Thy1 GFP mice aged 1 month and 4–12 months were compared with those from Thy1-GFP WT retinas, taken from Mazzoni et al. (2008). For each group, at least 4–6 cells were analyzed. Statistical analysis was performed with Origin 7.0 (v. 7SR1, OriginLab).
Original micrographs were stored as tiff files. Brightness and contrast were adjusted using Adobe Photoshop CS2 software (v. 9.0.2; Adobe Systems, San Jose, CA).
RESULTS
Survival of cells in the GCL in retinas from rd1 mice
To evaluate RGC survival, we performed topographical cell counts in the GCL, constituted by RGCs and displaced amacrine cells in roughly equal fractions (Jeon et al., 1998). Cells were counted in whole mount retinal preparations at central, middle, peripheral, and far-peripheral retinal locations (Fig. 2).
To obtain a faithful estimate of the total cell number in the GCL, we counted a large fraction of cells (≈10% or 12,500–13,000 cells) per retina. The number of total cells in GCL was found to be very similar in retinas from 4.5-month-old (132,770 ± SD 2,873 cells/retina) and 1-year-old mice (125,221 ± SD 2,430 cells/retina) (Fig. 2). Considering that ganglion cells represent 50% of the cells in the GCL, this leads to an estimate of about 66,000 and 62,000 GCs in the retinas of mice aged 4.5 and 1 year, respectively, with a 5.7% decrease in the number of cells of the GCL in the time window analyzed (t-test; P = 0.05). The estimate obtained for 4.5-month-old animals matches previous data available for 8-week-old rd1 mice of the same C3H strain (68,200 ± standard deviation [SD] 3,500 cells/retina) (Williams et al., 1996).
Morphology of ganglion cells in retinas from rd1 mice
To study single RGCs in the rd1 mutant, we crossed rd1 mice with individuals from the Thy1/GFP-M transgenic line (Feng et al., 2000), in which expression of GFP is driven by a promoter for the Thy1 gene (Caroni, 1997), expressed in the retina in RGCs only. In this particular line, only a small number of isolated RGCs (on average, 50 cells per retina) are labeled in their entirety (soma, axon, and dendrites). All the major types of RGCs described for the mouse retina were found as GFP-labeled exemplars in the retina of rd1/Thy1-GFP mice. However, a prevalence (≈40%) was observed of labeled GCs either belonging to the C2 type, characterized by large and sinuous dendritic trees, or to the B3 type, with small, recursive, and asymmetrical dendritic arbors. These two groups comprise two additional clusters each, respectively named inner and outer, depending on the stratification level of the cells in the inner or outer sublamina of the IPL (Sun et al., 2002). We compared morphometric parameters of labeled RGCs of the rd1/Thy1-GFP mouse with corresponding value ranges published in Sun et al.’s classification. For identification of cells from their body size and morphology of dendritic arborization shapes, we also referred to descriptions and soma-dendritic parameters provided by others (Kong et al., 2005; Coombs et al., 2006; Volgyi et al., 2009). The analysis was carried out using retinal samples from mice aged 4 months, when retinas from rd1 mutants have already undergone complete photoreceptor degeneration and remodeling of inner neurons (Strettoi et al., 2002), as well as from 9-month-old and 1-year-old mice. A total number of 277 cells RGCs were examined, for which we analyzed the overall cellular morphology, subsequently measuring the soma size, the dendritic field diameter and the depth of stratification in the IPL. They belonged to several of the types described in previous studies (Masland, 2001) (Fig. 3).
Figure 3.
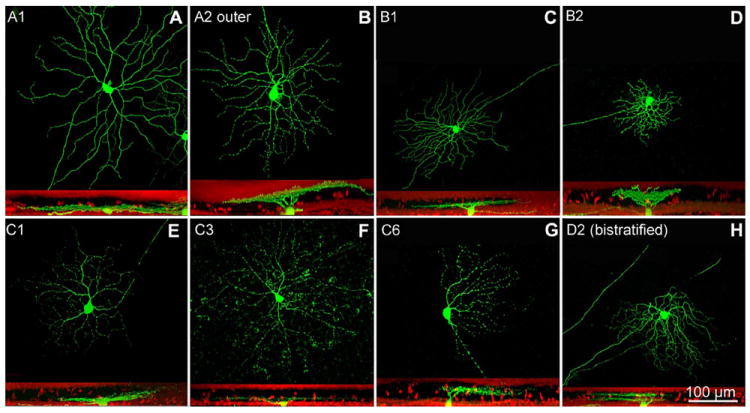
Examples of different types of RGCs found in retinas from rd1/Thy1-GFP transgenics. In this and in the following images each cell is shown in whole mount (top part of the panels) and in vertical view after computer rotation (bottom part of the panels). In vertical views the red signal is ethidium nuclear staining. A1 and A2 cells (A,B) have large-size dendritic trees, while B1 and B2 cells (C,D) have smaller arbors. A and B types RGCs of the mouse can be considered the equivalent of α and β types of the cat. The C1 and C3 cells shown here (E,F) stratify in the innermost tier of the IPL, while the C6 cell (G) reaches the outer part of the IPL. Among C3 RGCs, a subset is positive for melanopsin. C6 and D2 types comprise directional selective ganglion cells. The cell labeled as D2 (H) is bistratified and therefore is a putative ON-OFF GC. A magenta-green copy of the figure is provided as Supporting Figure 1.
Of the 277 cells examined, 60 cells were bistratified (presumptive ON-OFF types) as observed in the lateral view after 3D reconstruction and computer rotation. As bistratified cells constitute a very large and heterogeneous type for which classification criteria are not too clear in the literature, they were not included in the final analysis. A group of additional 39 cells could not be classified unambiguously. Hence, the final analysis was performed on a sample on 178 GCs, unequivocally assigned to selective types.
About one-half (85/178 cells) of the GCs analyzed in detail were found to be undistinguishable from their WT counterparts for general morphology and for the three morphometric parameters mentioned above, all falling within published ranges (Fig. 3).
Conversely, the remaining RGCs (93/178) were anomalous. In particular, the area covered by their dendritic arborization was reduced compared to WT ranges published in Sun et al. (2002). On average, the size of the soma of these cells was also smaller (Figs. 4, 5). Overall, 50% of the RGCs in the rd1/Thy1-GFP mouse displayed a reduction of their size.
Figure 4.
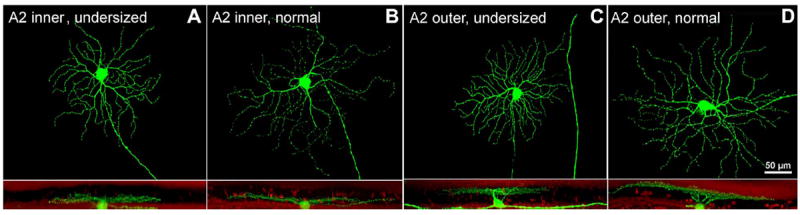
Examples of undersized (A,C) and normal (B,D) RGCs belonging to the A2 inner and outer types. A type cells have a round soma with an average of 22 μm, an average dendritic field diameter of 300 μm, and a radiate pattern of 4–7 primary branching repeatedly proximal to the soma. Cells shown here are from rd1/Thy1-GFP mice aged 9 months. A magenta-green copy of the figure is provided as Supporting Figure 2.
Figure 5.
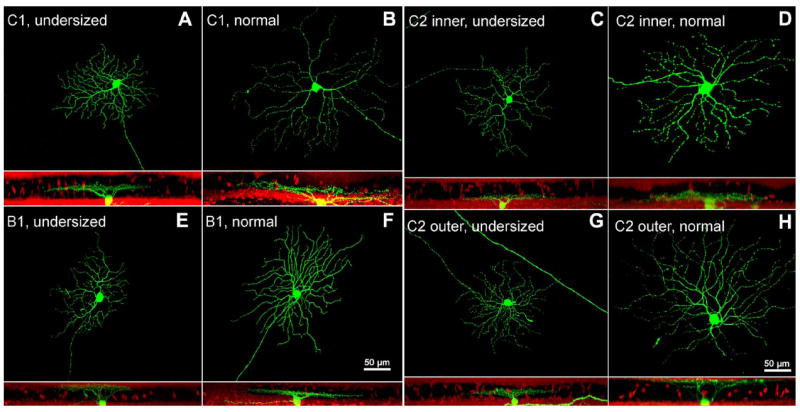
Examples of undersized (A,C,E,G) and normal (B,D,F,H) RGCs belonging to the C1, C2 (inner and outer), and B1 types. C type RGCs have an average soma diameter of 16 μm and dendritic field diameter of 241 μm. They exhibit smooth, small-caliber, recursive dendrites extending from large primary ones. C1 cells stratify mostly in the inner IPL (62% ± 15%). C2 cells have a morphology similar to that of C1 cells but with more curved and denser dendrites. B1 RGCs have an average soma diameter of 14 μm and radially branching dendrites, ramified in the outer IPL close to the middle. B1 cells have an average dendritic field diameter of 173 μm, thus comprising the GCs with the smallest dendritic tree area of the mouse retina. A magenta-green copy of the figure is provided as Supporting Figure 3.
In these cases, classification was made possible using an accurate evaluation of the morphology of the dendritic trees, which remained highly characteristic. Apart from the smaller size, these GCs could be assigned unequivocally to specific groups of Sun et al.’s classification, largely based on the typical shape of each cell type.
To identify the timing at which the reduction of dendritic trees size of RGCs in rd1 retinas first occurred, we analyzed individual RGCs from retinas of 1-month-old rd1/Thy1-GFP mice. At this age development of the dendritic compartment of RGCs has just completed (Liu et al., 2009).
RGCs with normal and undersized dendritic tree area were considered separated groups. Since no substantial differences were detected among RGCs from animals in the age ranging from 4–12 months, all RGCs from these animals were grouped in the “adult” cluster. Parameters from each group were compared to data of RGCs from transgenic C57BL6J/Thy1-GFP mice (WT for the rd1 mutation) aged 8 months, taken as controls, and recently studied in our laboratory (Mazzoni et al., 2008).
We found that undersized RGCs occurred also in retinas from 1-month-old, rd1/Thy1-GFP mice. Undersized cells made obviously separate clusters and showed a reduction of about 50% in their dendritic tree area (Figs. 6-9).
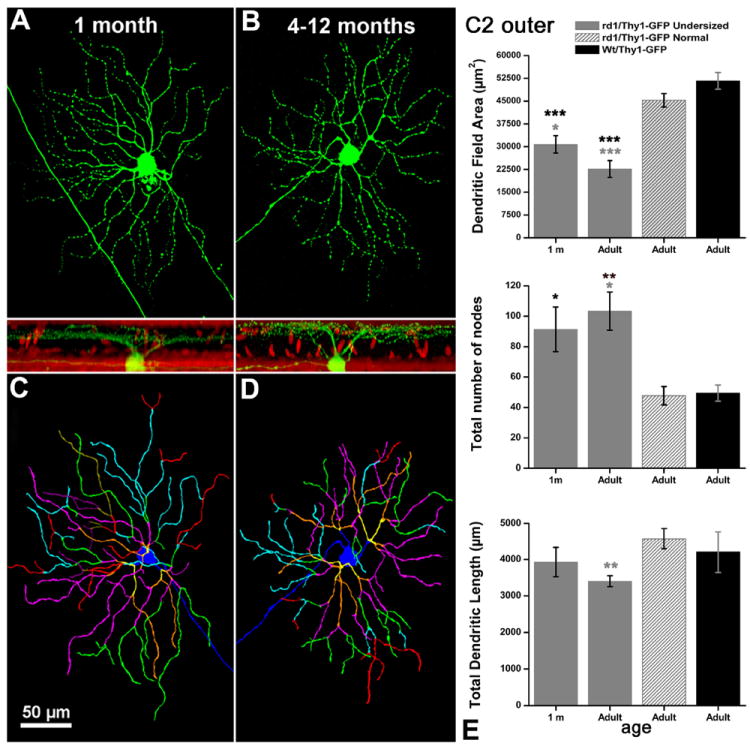
Figure 6.
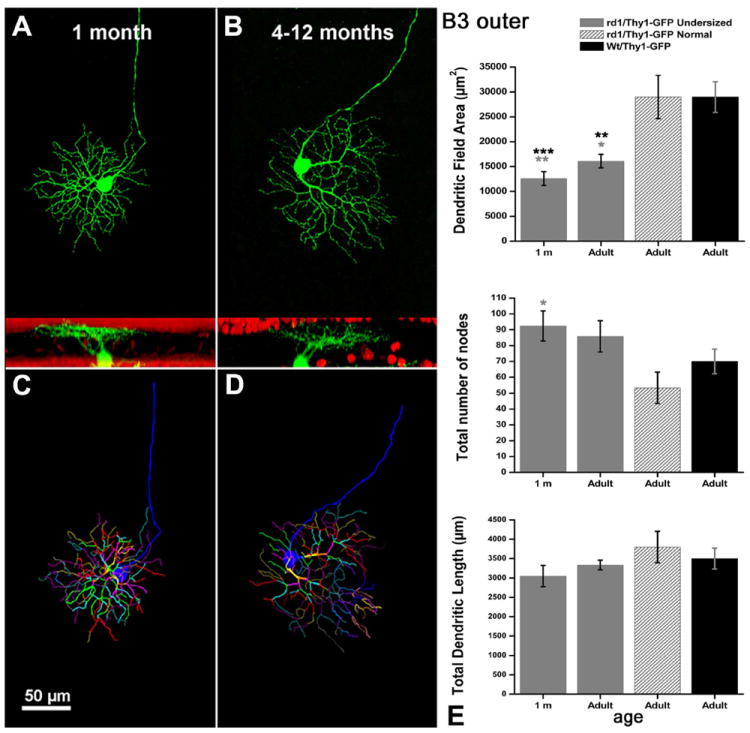
In this and the following three figures, RGCs are displayed as whole mounts in the topmost image, as computer vertical rotations in the middle image, and as Neurolucida drawings in the bottom panel. A,B: GFP-positive GCs belonging to the B3 outer types at young (A) and older (B) ages. Red signal: ethidium nuclear staining. C,D: Neurolucida-traced dendrites of different orders are shown in different colors. E: Diagrams show the analysis of the three indicators of dendritic tree complexity: dendritic field area, total number of nodes, and total dendritic tree length. In this and in the following three figures, black asterisks refer to the statistic comparison between undersized RGCs from rd1 mice and RGCs from WT animals, while gray asterisks refer to the comparison between undersized RGCs from rd1 mice and normal-size RGCs from mice of the same strain. In this and in the following pictures data are from groups of 5–10 cells for each age, for each strain of mice. Student’s t-test. *P 0.01 < P < 0.05; **P < 0.001 < P < 0.01; ***P < 0.001. A magenta-green copy of the figure is provided as Supporting Figure 4.
Figure 9.
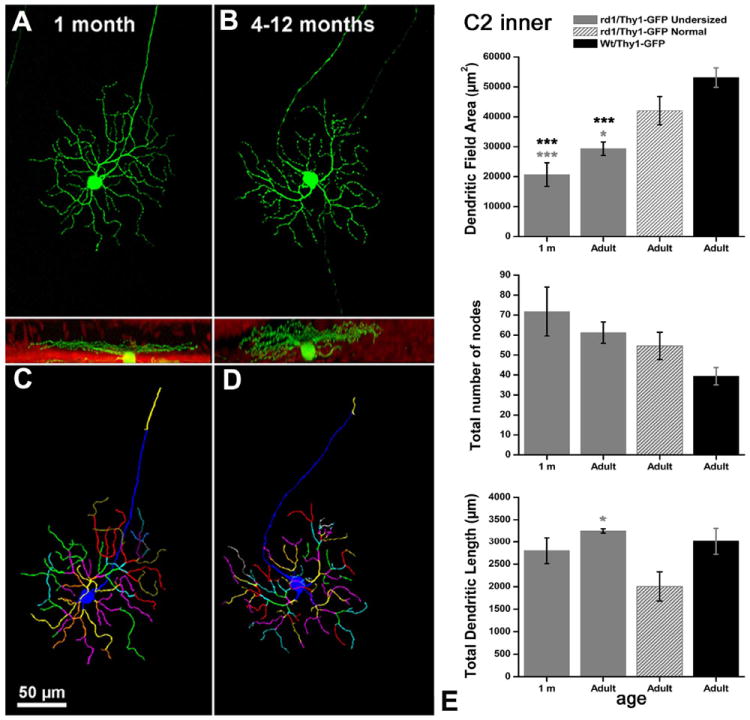
A–D: Examples of C2 inner RGCs from rd1 mice with smaller dendritic tree areas (E). A magenta-green copy of the figure is provided as Supporting Figure 7.
Such a difference, highly significant (t-test; P = 0.001), is the same found in older animals of the same strain. Thus, ≈50% of the RGCs we examined in rd1/Thy1-GFP mice show a reduction of 50% in their dendritic tree size, irrespective of age and cell type.
Complexity of dendritic trees in retinal ganglion cells of rd1 mice
To assess any possible change in the complexity of dendritic tree arborizations, the profiles of exemplars of Thy1-positive ganglion cells, both normal (n = 38) and undersized (n = 40), belonging to B3 inner and outer, as well as to C2 inner and outer types, were drawn with Neurolucida and then analyzed by ad hoc software routines to assess dendritic arborization complexity, in particular evaluating the dendritic tree area, the total dendritic tree length, and the total number of bifurcation points (nodes). These parameters were compared with those of RGCs from Thy1-GFP mice WT for the rd1 mutation (WT mice), as well as with those from cells retrieved in the same rd1/Thy-GFP mice of different age groups.
Within the population of “undersized cells” belonging to the B3 type we found a concomitant increase in the number of nodes on the dendritic branches (diagrams of Fig. 7). This increase in dendritic complexity was observed at all ages tested. On the other hand, no changes were reported for stratification levels in the IPL for the RGCs examined, while some of them exhibited undersized cell bodies (Table 2). No variations in the three parameters evaluated by Neurolucida analysis were detected in RGCs exemplars classified as “normal” within the time window from 1 month to 1 year in the rd1/Thy1 GFP strain (gray shaded columns in diagrams of Figs. 6-9).
Figure 7.
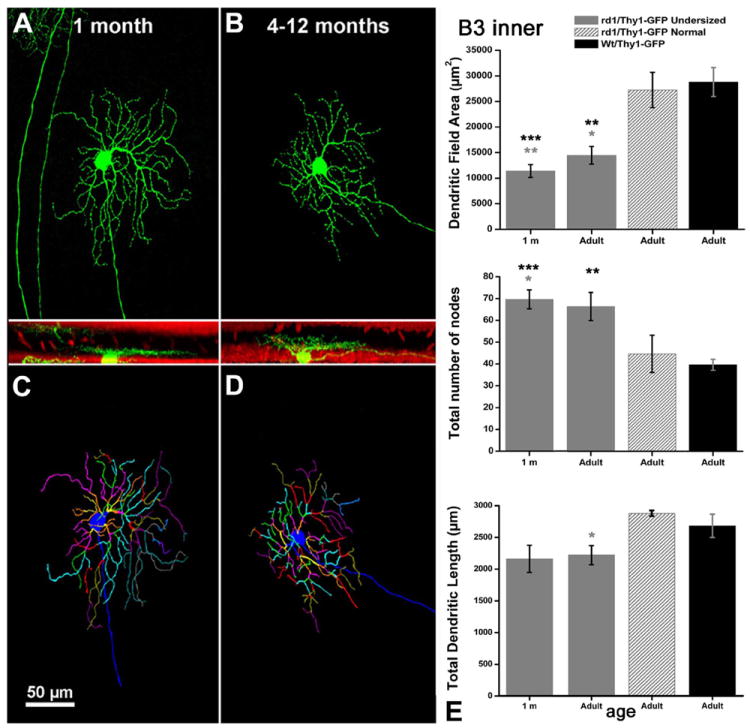
A–D: B3 inner cells with smaller dendritic tree areas and increased number of nodes (E). A magenta-green copy of the figure is provided as Supporting Figure 5.
TABLE 2.
Main Morphometric Parameters of the 8 Types of RGCs Examined
| C2 inner wt (Sun) | C2 inner rd1/Thy1-GFP | C2 outer wt (Sun) | C2 outer rd1/Thy1-GFP | B3 inner wt (Sun) | B3 inner rd1/Thy1-GFP | B3 outer wt (Sun) | B3 outer rd1/Thy1-GFP | |
|---|---|---|---|---|---|---|---|---|
| Soma Φ (μm), Mean ±SD | *17±3 | *15±2 | *17±3 | *15±3 | 15±3 | 15±2 | 15±3 | 15±2 |
| Dendritic field Φ (μm), Mean ±SD | 283±63 | 189±42 | 283±63 | 190±26 | 199±47 | 138±22 | 199±47 | 127±12 |
| Stratification (% IPL depth) | 75±7 | 66±15 | 32±18 | 35±15 | 67±10 | 70±7 | 25±16 | 23±8 |
Soma sizes are smaller than normal in C2 inner and outer GCs of rd1 mice as highlighted by asterisks.
Melanopsin and SMI-32-positive ganglion cells
To obtain morphometric indications of GC parameters in retinas of rd1 mice independently from transgenic labeling with GFP, we used antibodies labeling selective GC types. This method brings to light only cells expressing specific antigens and allows the identification of specific GC subtypes independently from their morphology. This circumvents the limit posed by random genetic expression of GFP, namely, that the morphological attributes used to define cell types are the same as those that are likely to be changing during degeneration.
We used a previously characterized melanopsin antibody on retinal whole mounts to label melanopsin-expressing GCs (Fig. 10A), which comprise several subtypes. We obtained the well-known pattern of staining of GCs described by Berson et al. (2010). We then measured the body size of 300 melanopsin-positive GCs sampled from retinas of rd1 mice (n = 3) aged 3 months and found that, on average, the soma diameter measured 11.37 ± 1.67 μm. An equal number of cells from WT GCs resulted in an average diameter of 13.67 ±2.44 μm (Fig. 10B). This finding is in line with the detection of C2 inner and outer GCs with reduced size in rd1/Thy1-GFP mutants (Table 2).
Figure 10.
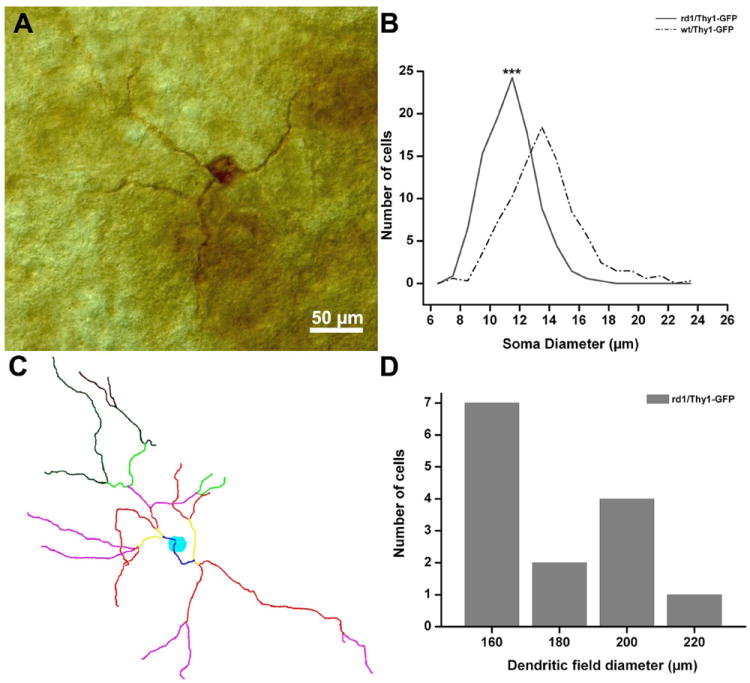
A: Melanopsin-positive GC from the retina of one rd1/Thy1-GFP mice. M1 type. B: Histograms of cell body diameters of melanopsin-positive GCs in retinas from rd1-Thy1/GFP (solid line) and WT (dashed line) mice. The average diameter is smaller in the rd1 mutant. The average diameter of melanopsin-positive WT GCs is in agreement with published data (Berson et al., 2010). Student’s t-test; ***P < 0.005. C: Neurolucida drawing of one M1 type melanopsin-positive GC from the retina of one rd1/Thy1-GFP mouse. Different colors represent different branching orders of the dendrites. D: Dendritic tree diameter distribution of 14 M1 type melanopsin GCs from the rd1/Thy1-GFP mouse. The study of Berson et al. (2010) reports a minimum diameter of about 190 μm for all melanopsin GCs, while here 9 out of 14 cells have diameters smaller <180 μm. A magenta-green copy of the figure is provided as Supporting Figure 8.
We labeled three additional retinal whole mounts with the same melanopsin antibody following a protocol predominantly leading to visualization of the M1 subtypes (Berson et al., 2010). These are GCs whose terminal dendrites stratify exclusively in the outer plexus of the IPL. The dendritic tree is composed of few, long processes of coarse caliber and their body size (below 13 μm) is among the smallest of all the melanopsin-positive GCs (Fig. 10A). Out of a sample of 14 M1 GCs chosen for Neurolucida dendritic tracing, we found that seven showed a smaller dendritic field diameter (Fig. 10C,D). This method confirms that some GCs of rd1 mutants (including M1 GCs) are indeed undersized.
The antibody SMI-32 is directed against a phosphorylated form of the heavy subunit of neurofilaments and labels predominantly GCs with wide arborizations, large somata (≈30 μm), 4–5-thick primary dendrites, and large, sparsely branched dendritic trees (Lin et al., 2004). We labeled rd1/Thy1-GFP retinas (n = 6 from animals aged P30–P45) with SMI-32 antibodies and searched for GFP-positive ganglion cells also showing SMI-32 immunoreactivity. Among these neurons (n = 25), we found several exemplars (n = 13) that could be identified according to the scheme of Sun et al. (2002) on the basis of their dendritic tree morphology and stratification pattern but that displayed a clearly undersized dendritic tree area (Fig. 11).
Figure 11.
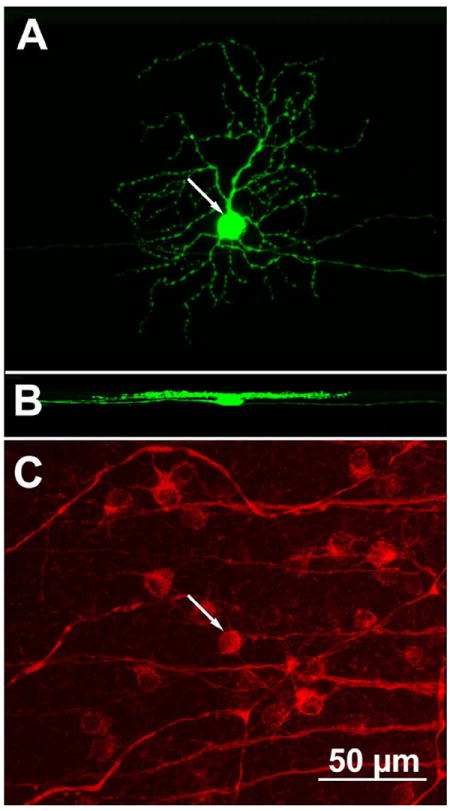
A GFP-positive GC (arrow in A) from the retina of one rd1/Thy1-GFP mouse. This cell stratifies in the innermost half of the IPL (as visible in the side view shown in B) and has the typical morphology of a B3 GC. However, the dendritic tree diameter is 30% smaller than normal. The cell is also positive after SMI-32 antibodies immunostaining (arrow in C). A magenta-green copy of the figure is provided as Supporting Figure 9.
Thus, all our visualization methods confirm the occurrence of smaller than normal GCs, in the approximate proportion of 50%, in the retina of rd1 mutant mice.
Axonal initial segments of ganglion cells in rd1 mutant mice
RGCs from rd1 mice were shown to exhibit paroxysmal activity from the age of 1 month onward (Margolis et al., 2008; Stasheff, 2008). However, the activation threshold for ganglion cell exogenous stimulation was found to be increased in both animal models and RP patients (Suzuki et al., 2004; O’Hearn et al., 2006; Jensen and Rizzo, 2008). Neuronal spiking activity is strictly dependent on expression of sodium channels, and especially of the voltage-gated sodium channels in AISs, clustered by the docking action of Ankyrin G (Dzhashiashvili et al., 2007). Among subunits of voltage-gated sodium channels, NaV1.6 has been recently described as the most critical, contributing significantly to the role of the AIS as a spike trigger zone with the lowest threshold for action potential generation (Osorio et al., 2010). The activation threshold is associated with the length of AISs and to their distance from RGC somata (Fried et al., 2009). To obtain indications of AIS organization of RGCs in rd1 mutant mice, we measured length and distance from the soma of AISs in axons of GFP-positive GCs from rd1/Thy1-GFP mice aged 1 month and 1 year and compared the data to parameters obtained from 1-year-old WT/Thy1-GFP controls.
NaV1.6 immunostaining always colocalized with Ankyrin G, which, by definition, labels the AIS-specific region. No variation in the length of NaV1.6-positive bands was detected in time (1 month vs. 1-year-old mice of the rd1 strain) or in comparison to WT controls (Fig. 12). Only a slight decrease in the distance of AISs from cell somata was observed in rd1/Thy1 GFP aged 1 year with respect to WT animals (Fig. 12). Such a decrement is not significant if AIS distances from cell somata are compared with those measured in younger mice of the same C3H strain. Thus, the geometry of AIS in RGCs of rd1 mutant mice does not change over time, despite the progression of photoreceptor degeneration or the occurrence of secondary remodeling.
Figure 12.
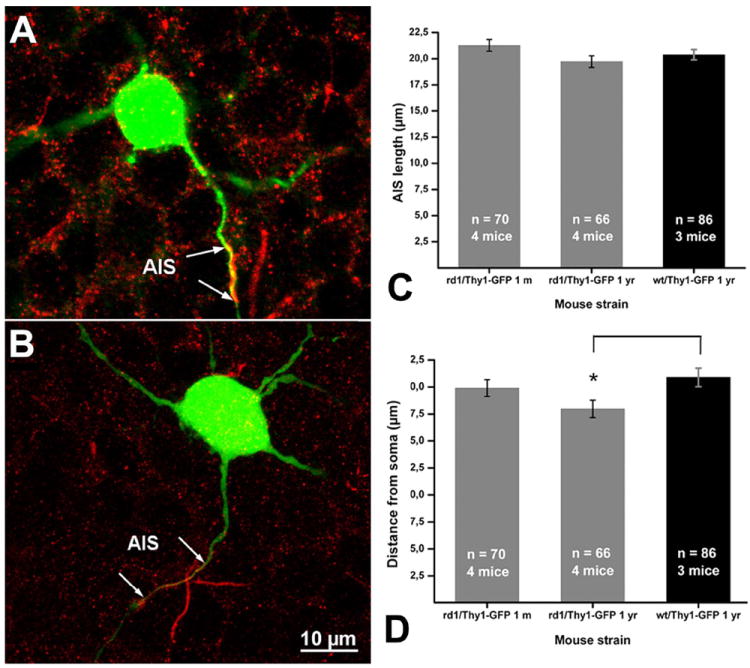
A,B: Two examples of GFP-positive GCs from rd1/Thy1-GFP mice, labeled with Nav1.6 antibodies (red staining). The AISs are double-labeled. C,D: Diagrams of average AIS length (C) and average AIS distance from cell soma (B) in rd1 and WT young (1 month) and adult (1 year) mice. A magenta-green copy of the figure is provided as Supporting Figure 10.
DISCUSSION
RGCs are the only projection neurons of the retina to higher visual centers and are required to maintain retinal-initiated visual function. Prospective therapeutic approaches to restore vision in RP rely on their viability. Electronic prostheses are designed to restore sight by transforming light into electric signals exploiting RGCs to send information to the brain (Winter et al., 2007; Chader et al., 2009). Transgenic expression of light-sensitive proteins into RGCs restores vision, bypassing photoreceptors and second-order neurons and virtually relies on RGCs only (Lin et al., 2008). Hence, it is important to test the hypothesis underlying these approaches, according to which RGCs represent a highly stable population of neurons (Margolis et al., 2008; Mazzoni et al., 2008). Furthermore, it is important to assess whether this hypothesis holds true in different paradigms of RP, caused by different mutations and characterized by more or less aggressive progression.
Previous studies from our laboratory have estimated RGC survival in the rd10 mice, modeling a relatively mild form of RP. Here we assessed survival and preservation of RGC morphology in a classical paradigm of an early onset, aggressive model of retinal degeneration, the rd1 mutant mouse. We report a slight decrease (of less than 6%) in the number of cells of the GCL in retinas of rd1 mice aged 1 year compared to younger (4.5-month-old) mice of the WT strain. However, the estimated number of RGCs in rd1 mice at 4.5 months of age is similar to that reported for younger mice of the same C3H strain (Williams et al., 1996, 1998). Thus, RGCs survive well even after long photoreceptor degeneration, which starts during the second week of life in the rd1 mutant.
To study RGC morphology at the cellular level, we generated rd1/Thy1-GFP mice, expressing GFP in a small number of RGCs, and we classified a cohort of these cells following Sun et al. (2002). We analyzed relevant morphometric parameters of four representative types of RGCs encountered (B3 inner and outer, C2 inner and outer, comprising neurons with large and small dendritic trees, respectively, as well as presumptive OFF and ON types), from 1 month to 1 year of age. The dendritic tree area of about one-half of labeled RGCs was reduced compared to the published parameters. For some cell types, body size was reduced as well. B3 type cells with undersized dendritic trees also showed an increased arborization complexity, detectable as a higher number of bifurcations. Undersized RGCs were found among all RGC types studied, and outer and inner RGCs were equally affected. Undersized cells exhibited highly characteristic morphologies allowing, their classification according to the scheme of Sun et al. (2002); however, we considered the possibility that the morphometric indicators used for cell identification had themselves varied as an effect of the disease, therefore affecting classification criteria. To circumvent this limit we used melanopsin and SMI-32 immunostaining to reveal specific GC types, independent of GFP transgenic expression. Again we found that roughly 50% of the labeled cells had undersized dendritic trees. We also confirmed that a similar fraction of GCs had smaller that normal cell body diameters.
Undersized RGCs did not undergo further morphological changes in the time window from 1 month to 1 year of age. This strongly suggests that undersized RGCs occur as a consequence of developmental defects taking place during the final stage of dendritic refinement, rather than as the result of regressive remodeling of dendrites. The receptive field size of RGCs matches closely the area covered by their dendrites (Yang and Masland, 1992). Hence, it can be anticipated that a fraction of RGCs of rd1 mice display alterations in receptive field size and have functional properties that differ from those of normal animals.
These findings differ completely from observations obtained in our previous study in the rd10 mouse model, in which RGCs maintain all their morphometric characteristics. In the rd1 mouse, a mutation in the same pde6b gene causes a massive death of rods starting 10 days before than in the rd10 mutant, and is accompanied by a concomitant alteration of ganglion cell dendritic elongation.
Most likely, reduced light-driven activity in the outer retina affect RGC dendritic refinement, occurring around the third postnatal week of life, when dendrites elongate (Sernagor et al., 2001). The early onset rod degeneration typical of the rd1 mutant results in abortive development of dendrites and axonal endings of rod bipolar cells (Strettoi et al., 2002). These are not directly connected to ganglion cells, but make synapses with AII amacrines, which in turn are connected by gap junctions and chemical synapses with the axonal endings of ON and OFF cone bipolar cells, presynaptic to ganglion cell dendrites. ON-type cone bipolar cells are evidently affected by dendritic atrophy (Puthussery et al., 2009), and three types of OFF cone bipolar cells (3a, 3b, and 4) receive inputs also from rods (Mataruga et al., 2007; Haverkamp et al., 2008). Thus, both ON and OFF cone bipolars undergo altered afferent activity upon rod degeneration. This could bring in alterations of RGC synaptic input ultimately affecting their dendritic morphology. Indeed, it is known that a delay in retinal laminar refinement occurs upon pharmacological blockade of the mGluRs (Bisti et al., 1998). Altogether, visual experience is altered in the retina of rd1 mice and this has been shown to be crucial for postnatal development of RGCs (Tian and Copenhagen, 2003) and for the maturation of the lateral geniculate nucleus (LGN) and the superior colliculus (SC) circuitry (Menna et al., 2003; Caleo and Cenni, 2004). Visual experience of rd1 mice is limited to a few days, as at eye opening (P14) degeneration has already started and visual responses are abnormal. The fact that only a fraction of GCs shows incomplete growth of dendritic trees probably reflects differences in the timing of individual GC development and thus different exposure to the death process involving photoreceptors.
Locally produced neurotrophins, such as BDNF, NT-3, and others were also shown to be required for laminar refinement, elongation, and acquisition of complexity parameters of RGC dendrites (Landi et al., 2007; Liu et al., 2007, 2009). Neurotrophins are also released by central visual targets (LGN and SC) and retrogradely transported by RGCs. It is possible that locally and/or centrally decreased levels of growth factors influence postnatal RGC dendritic refinement, although anterograde transport per se is preserved in both rd1 (Hanno et al., 2003) and rd10 mutants (Mazzoni et al., 2008).
Recent studies reported excellent survival of RGCs in rd10 mutant mice (Margolis et al., 2008; Mazzoni et al., 2008; Stasheff, 2008). In rd1 mice, survival is similarly very high. Sensory deafferentation does not limit survival of RGCs, unlike in other cell types (Sorensen and Rubel, 2006). The overall good RGC viability found in RP mouse mutants could be ascribed to survival signals from postsynaptic neurons, mainly located in the LGN and in the SC.
Activity is also known to be required to maintain neuron viability. Oscillatory spike activity has been detected in RGCs from rd1 mice, attributable to strong rhythmic inputs (Margolis et al., 2008), which could derive from spontaneously depolarizing dopaminergic amacrines, displaying a pacemaker activity with the similar spiking frequency of 8–10 Hz (Feigenspan et al., 1998). Dopaminergic neurons are also connected to melanopsin-containing RGCs (Viney et al., 2007), known also to overcome photo-receptor degeneration (Vugler et al., 2008).
AISs contain a high concentration of voltage-sensitive NaV1.6 channels, crucial for axon potential initiation, so that their length and distance from the cell body affect the spiking threshold of neurons. We found no differences in morphological parameters of AISs from 1-year-old rd1 mice with respect to their younger counterparts or in comparison to AISs parameters of WT RGCs. This finding suggests that the spiking machineries of RGCs are also preserved after photoreceptor degeneration, supporting the notion that the increased excitability of RCGs shown in rd1 mutants has a presynaptic, rather than a cell-intrinsic, origin (Margolis et al., 2008), as confirmed by the finding that thresholds for direct excitation of RGCs are normal in P23H transgenic rats (Sekirnjak et al., 2009).
In summary, this study shows that an early degeneration of rod photoreceptors affects late development of a large fraction of RGCs, leading to a limited growth of their dendritic trees. In turn, this might affect the outcome of RP forms of intervention acting upstream with respect to GCs: for instance, the geometry and retinal tiling of GCs likely influence their response to subretinal prosthetic stimulation (Wilke et al., 2011). In spite of that, an overall preservation of RGCs upon retinal degeneration is confirmed, supporting therapeutic strategies for retinal dystrophies based on these neurons as biological platforms.
Supplementary Material
Figure 8.
A–D: Examples of C2 outer RGCs from rd1 mice showing dendritic trees of smaller areas (E). A magenta-green copy of the figure is provided as Supporting Figure 6.
Acknowledgments
We thank Dr. Lucia Galli-Resta for critically reading the article.
Grant sponsor: National Institutes of Health (NIH); Grant number: R01-EY12654 (to E.S.).
Footnotes
Additional Supporting Information may be found in the online version of this article.
LITERATURE CITED
- Badea TC, Nathans J. Quantitative analysis of neuronal morphologies in the mouse retina visualized by using a genetically directed reporter. J Comp Neurol. 2004;480:331–351. doi: 10.1002/cne.20304. [DOI] [PubMed] [Google Scholar]
- Berson DM, Castrucci AM, Provencio I. Morphology and mosaics of melanopsin-expressing retinal ganglion cell types in mice. J Comp Neurol. 2010;518:2405–2422. doi: 10.1002/cne.22381. [DOI] [PMC free article] [PubMed] [Google Scholar]
- Bisti S, Gargini C, Chalupa LM. Blockade of glutamate-mediated activity in the developing retina perturbs the functional segregation of ON and OFF pathways. J Neurosci. 1998;18:5019–5025. doi: 10.1523/JNEUROSCI.18-13-05019.1998. [DOI] [PMC free article] [PubMed] [Google Scholar]
- Caleo M, Cenni MC. Anterograde transport of neurotrophic factors: possible therapeutic implications. Mol Neurobiol. 2004;29:179–196. doi: 10.1385/mn:29:2:179. [DOI] [PubMed] [Google Scholar]
- Caroni P. Overexpression of growth-associated proteins in the neurons of adult transgenic mice. J Neurosci Methods. 1997;71:3–9. doi: 10.1016/s0165-0270(96)00121-5. [DOI] [PubMed] [Google Scholar]
- Chader GJ, Weiland J, Humayun MS. Artificial vision: needs, functioning, and testing of a retinal electronic prosthesis. Prog Brain Res. 2009;175:317–332. doi: 10.1016/S0079-6123(09)17522-2. [DOI] [PubMed] [Google Scholar]
- Coombs J, van der List D, Wang GY, Chalupa LM. Morphological properties of mouse retinal ganglion cells. Neuroscience. 2006;140:123–136. doi: 10.1016/j.neuroscience.2006.02.079. [DOI] [PubMed] [Google Scholar]
- Cuenca N, Pinilla I, Sauve Y, Lu B, Wang S, Lund RD. Regressive and reactive changes in the connectivity patterns of rod and cone pathways of P23H transgenic rat retina. Neuroscience. 2004;127:301–317. doi: 10.1016/j.neuroscience.2004.04.042. [DOI] [PubMed] [Google Scholar]
- Dzhashiashvili Y, Zhang Y, Galinska J, Lam I, Grumet M, Salzer JL. Nodes of Ranvier and axon initial segments are ankyrin G-dependent domains that assemble by distinct mechanisms. J Cell Biol. 2007;177:857–870. doi: 10.1083/jcb.200612012. [DOI] [PMC free article] [PubMed] [Google Scholar]
- Eisenfeld AJ, LaVail MM, LaVail JH. Assessment of possible transneuronal changes in the retina of rats with inherited retinal dystrophy: cell size, number, synapses, and axonal transport by retinal ganglion cells. J Comp Neurol. 1984;223:22–34. doi: 10.1002/cne.902230103. [DOI] [PubMed] [Google Scholar]
- Eng JG, Agrawal RN, Tozer KR, Ross-Cisneros FN, Dagnelie G, Greenberg RJ, Chader GJ, Weiland JD, Rao NA, Sadun AA, Humayun MS. Morphometric analysis of optic nerves and retina from an end-stage retinitis pigmentosa patient implanted with an active epiretinal array. Invest Ophthalmol Vis Sci. 2011;52:4610–4616. doi: 10.1167/iovs.09-4936. [DOI] [PMC free article] [PubMed] [Google Scholar]
- Feigenspan A, Gustincich S, Bean BP, Raviola E. Spontaneous activity of solitary dopaminergic cells of the retina. J Neurosci. 1998;18:6776–6789. doi: 10.1523/JNEUROSCI.18-17-06776.1998. [DOI] [PMC free article] [PubMed] [Google Scholar]
- Feng G, Mellor RH, Bernstein M, Keller-Peck C, Nguyen QT, Wallace M, Nerbonne JM, Lichtman JW, Sanes JR. Imaging neuronal subsets in transgenic mice expressing multiple spectral variants of GFP. Neuron. 2000;28:41–51. doi: 10.1016/s0896-6273(00)00084-2. [DOI] [PubMed] [Google Scholar]
- Fried SI, Lasker AC, Desai NJ, Eddington DK, Rizzo JF., 3rd Axonal sodium-channel bands shape the response to electric stimulation in retinal ganglion cells. J Neurophysiol. 2009;101:1972–1987. doi: 10.1152/jn.91081.2008. [DOI] [PMC free article] [PubMed] [Google Scholar]
- Gargini C, Terzibasi E, Mazzoni F, Strettoi E. Retinal organization in the retinal degeneration 10 (rd10) mutant mouse: a morphological and ERG study. J Comp Neurol. 2007;500:222–238. doi: 10.1002/cne.21144. [DOI] [PMC free article] [PubMed] [Google Scholar]
- Grafstein B, Murray M, Ingoglia NA. Protein synthesis and axonal transport in retinal ganglion cells of mice lacking visual receptors. Brain Res. 1972;44:37–48. doi: 10.1016/0006-8993(72)90364-2. [DOI] [PubMed] [Google Scholar]
- Hanno Y, Nakahira M, Jishage K, Noda T, Yoshihara Y. Tracking mouse visual pathways with WGA transgene. Eur J Neurosci. 2003;18:2910–2914. doi: 10.1111/j.1460-9568.2003.03023.x. [DOI] [PubMed] [Google Scholar]
- Hartong DT, Berson EL, Dryja TP. Retinitis pigmentosa. Lancet. 2006;368:1795–1809. doi: 10.1016/S0140-6736(06)69740-7. [DOI] [PubMed] [Google Scholar]
- Haverkamp S, Specht D, Majumdar S, Zaidi NF, Brandstatter JH, Wasco W, Wassle H, Tom Dieck S. Type 4 OFF cone bipolar cells of the mouse retina express calsenilin and contact cones as well as rods. J Comp Neurol. 2008;507:1087–1101. doi: 10.1002/cne.21612. [DOI] [PubMed] [Google Scholar]
- Humayun MS, Prince M, de Juan E, Jr, Barron Y, Moskowitz M, Klock IB, Milam AH. Morphometric analysis of the extramacular retina from postmortem eyes with retinitis pigmentosa. Invest Ophthalmol Vis Sci. 1999;40:143–148. [PubMed] [Google Scholar]
- Jakobs TC, Libby RT, Ben Y, John SW, Masland RH. Retinal ganglion cell degeneration is topological but not cell type specific in DBA/2J mice. J Cell Biol. 2005;171:313–325. doi: 10.1083/jcb.200506099. [DOI] [PMC free article] [PubMed] [Google Scholar]
- Jenkins SM, Kizhatil K, Kramarcy NR, Sen A, Sealock R, Bennett V. FIGQY phosphorylation defines discrete populations of L1 cell adhesion molecules at sites of cell-cell contact and in migrating neurons. J Cell Sci. 2001;114(Pt 21):3823–3835. doi: 10.1242/jcs.114.21.3823. [DOI] [PubMed] [Google Scholar]
- Jensen RJ, Rizzo JF., 3rd Activation of retinal ganglion cells in wild-type and rd1 mice through electrical stimulation of the retinal neural network. Vision Res. 2008;48:1562–1568. doi: 10.1016/j.visres.2008.04.016. [DOI] [PubMed] [Google Scholar]
- Jeon CJ, Strettoi E, Masland RH. The major cell populations of the mouse retina. J Neurosci. 1998;18:8936–8946. doi: 10.1523/JNEUROSCI.18-21-08936.1998. [DOI] [PMC free article] [PubMed] [Google Scholar]
- Kong JH, Fish DR, Rockhill RL, Masland RH. Diversity of ganglion cells in the mouse retina: unsupervised morphological classification and its limits. J Comp Neurol. 2005;489:293–310. doi: 10.1002/cne.20631. [DOI] [PubMed] [Google Scholar]
- Lagali PS, Balya D, Awatramani GB, Munch TA, Kim DS, Busskamp V, Cepko CL, Roska B. Light-activated channels targeted to ON bipolar cells restore visual function in retinal degeneration. Nat Neurosci. 2008;11:667–675. doi: 10.1038/nn.2117. [DOI] [PubMed] [Google Scholar]
- Landi S, Cenni MC, Maffei L, Berardi N. Environmental enrichment effects on development of retinal ganglion cell dendritic stratification require retinal BDNF. PLoS One. 2007;2:e346. doi: 10.1371/journal.pone.0000346. [DOI] [PMC free article] [PubMed] [Google Scholar]
- Lin B, Wang SW, Masland RH. Retinal ganglion cell type, size, and spacing can be specified independent of homotypic dendritic contacts. Neuron. 2004;43:475–485. doi: 10.1016/j.neuron.2004.08.002. [DOI] [PubMed] [Google Scholar]
- Lin B, Koizumi A, Tanaka N, Panda S, Masland RH. Restoration of visual function in retinal degeneration mice by ectopic expression of melanopsin. Proc Natl Acad Sci U S A. 2008;105:16009–16014. doi: 10.1073/pnas.0806114105. [DOI] [PMC free article] [PubMed] [Google Scholar]
- Liu X, Grishanin RN, Tolwani RJ, Renteria RC, Xu B, Reichardt LF, Copenhagen DR. Brain-derived neurotrophic factor and TrkB modulate visual experience-dependent refinement of neuronal pathways in retina. J Neurosci. 2007;27:7256–7267. doi: 10.1523/JNEUROSCI.0779-07.2007. [DOI] [PMC free article] [PubMed] [Google Scholar]
- Liu X, Robinson ML, Schreiber AM, Wu V, Lavail MM, Cang J, Copenhagen DR. Regulation of neonatal development of retinal ganglion cell dendrites by neurotrophin-3 overexpression. J Comp Neurol. 2009;514:449–458. doi: 10.1002/cne.22016. [DOI] [PMC free article] [PubMed] [Google Scholar]
- Marc RE, Jones BW. Retinal remodeling in inherited photoreceptor degenerations. Mol Neurobiol. 2003;28:139–147. doi: 10.1385/MN:28:2:139. [DOI] [PubMed] [Google Scholar]
- Marc RE, Jones BW, Watt CB, Strettoi E. Neural remodeling in retinal degeneration. Prog Retin Eye Res. 2003;22:607–655. doi: 10.1016/s1350-9462(03)00039-9. [DOI] [PubMed] [Google Scholar]
- Marc RE, Jones BW, Anderson JR, Kinard K, Marshak DW, Wilson JH, Wensel T, Lucas RJ. Neural reprogramming in retinal degeneration. Invest Ophthalmol Vis Sci. 2007;48:3364–3371. doi: 10.1167/iovs.07-0032. [DOI] [PMC free article] [PubMed] [Google Scholar]
- Margolis DJ, Newkirk G, Euler T, Detwiler PB. Functional stability of retinal ganglion cells after degeneration-induced changes in synaptic input. J Neurosci. 2008;28:6526–6536. doi: 10.1523/JNEUROSCI.1533-08.2008. [DOI] [PMC free article] [PubMed] [Google Scholar]
- Masland RH. Neuronal diversity in the retina. Curr Opin Neurobiol. 2001;11:431–436. doi: 10.1016/s0959-4388(00)00230-0. [DOI] [PubMed] [Google Scholar]
- Mataruga A, Kremmer E, Muller F. Type 3a and type 3b OFF cone bipolar cells provide for the alternative rod pathway in the mouse retina. J Comp Neurol. 2007;502:1123–1137. doi: 10.1002/cne.21367. [DOI] [PubMed] [Google Scholar]
- Mazzoni F, Novelli E, Strettoi E. Retinal ganglion cells survive and maintain normal dendritic morphology in a mouse model of inherited photoreceptor degeneration. J Neurosci. 2008;28:14282–14292. doi: 10.1523/JNEUROSCI.4968-08.2008. [DOI] [PMC free article] [PubMed] [Google Scholar]
- Menna E, Cenni MC, Naska S, Maffei L. The anterogradely transported BDNF promotes retinal axon remodeling during eye specific segregation within the LGN. Mol Cell Neurosci. 2003;24:972–983. doi: 10.1016/s1044-7431(03)00258-6. [DOI] [PubMed] [Google Scholar]
- O’Hearn TM, Sadda SR, Weiland JD, Maia M, Margalit E, Humayun MS. Electrical stimulation in normal and retinal degeneration (rd1) isolated mouse retina. Vision Res. 2006;46:3198–3204. doi: 10.1016/j.visres.2006.03.031. [DOI] [PubMed] [Google Scholar]
- Osorio N, Cathala L, Meisler MH, Crest M, Magistretti J, Delmas P. Persistent Nav1.6 current at axon initial segments tunes spike timing of cerebellar granule cells. J Physiol. 2010;588:651–670. doi: 10.1113/jphysiol.2010.183798. [DOI] [PMC free article] [PubMed] [Google Scholar]
- Panda S, Sato TK, Castrucci AM, Rollag MD, DeGrip WJ, Hogenesch JB, Provencio I, Kay SA. Melanopsin (Opn4) requirement for normal light-induced circadian phase shifting. Science. 2002;298:2213–2216. doi: 10.1126/science.1076848. [DOI] [PubMed] [Google Scholar]
- Pignatelli V, Cepko CL, Strettoi E. Inner retinal abnormalities in a mouse model of Leber’s congenital amaurosis. J Comp Neurol. 2004;469:351–359. doi: 10.1002/cne.11019. [DOI] [PubMed] [Google Scholar]
- Puthussery T, Gayet-Primo J, Pandey S, Duvoisin RM, Taylor WR. Differential loss and preservation of glutamate receptor function in bipolar cells in the rd10 mouse model of retinitis pigmentosa. Eur J Neurosci. 2009;29:1533–1542. doi: 10.1111/j.1460-9568.2009.06728.x. [DOI] [PMC free article] [PubMed] [Google Scholar]
- Rockhill RL, Daly FJ, MacNeil MA, Brown SP, Masland RH. The diversity of ganglion cells in a mammalian retina. J Neurosci. 2002;22:3831–3843. doi: 10.1523/JNEUROSCI.22-09-03831.2002. [DOI] [PMC free article] [PubMed] [Google Scholar]
- Santos A, Humayun MS, de Juan E, Jr, Greenburg RJ, Marsh MJ, Klock IB, Milam AH. Preservation of the inner retina in retinitis pigmentosa. A morphometric analysis. Arch Ophthalmol. 1997;115:511–515. doi: 10.1001/archopht.1997.01100150513011. [DOI] [PubMed] [Google Scholar]
- Sekirnjak C, Hulse C, Jepson LH, Hottowy P, Sher A, Dabrowski W, Litke AM, Chichilnisky EJ. Loss of responses to visual but not electrical stimulation in ganglion cells of rats with severe photoreceptor degeneration. J Neurophysiol. 2009;102:3260–3269. doi: 10.1152/jn.00663.2009. [DOI] [PMC free article] [PubMed] [Google Scholar]
- Sernagor E, Eglen SJ, Wong RO. Development of retinal ganglion cell structure and function. Prog Retin Eye Res. 2001;20:139–174. doi: 10.1016/s1350-9462(00)00024-0. [DOI] [PubMed] [Google Scholar]
- Soares JG, Rosado De Castro PH, Fiorani M, Nascimento-Silva S, Gattass R. Distribution of neurofilament proteins in the lateral geniculate nucleus, primary visual cortex, and area MT of adult cebus monkeys. J Comp Neurol. 2008;508:605–614. doi: 10.1002/cne.21718. [DOI] [PubMed] [Google Scholar]
- Sorensen SA, Rubel EW. The level and integrity of synaptic input regulates dendrite structure. J Neurosci. 2006;26:1539–1550. doi: 10.1523/JNEUROSCI.3807-05.2006. [DOI] [PMC free article] [PubMed] [Google Scholar]
- Stasheff SF. Emergence of sustained spontaneous hyperactivity and temporary preservation of OFF responses in ganglion cells of the retinal degeneration (rd1) mouse. J Neurophysiol. 2008;99:1408–1421. doi: 10.1152/jn.00144.2007. [DOI] [PubMed] [Google Scholar]
- Stone JL, Barlow WE, Humayun MS, de Juan E, Jr, Milam AH. Morphometric analysis of macular photoreceptors and ganglion cells in retinas with retinitis pigmentosa. Arch Ophthalmol. 1992;110:1634–1639. doi: 10.1001/archopht.1992.01080230134038. [DOI] [PubMed] [Google Scholar]
- Strettoi E, Pignatelli V. Modifications of retinal neurons in a mouse model of retinitis pigmentosa. Proc Natl Acad Sci U S A. 2000;97:11020–11025. doi: 10.1073/pnas.190291097. [DOI] [PMC free article] [PubMed] [Google Scholar]
- Strettoi E, Porciatti V, Falsini B, Pignatelli V, Rossi C. Morphological and functional abnormalities in the inner retina of the rd/rd mouse. J Neurosci. 2002;22:5492–5504. doi: 10.1523/JNEUROSCI.22-13-05492.2002. [DOI] [PMC free article] [PubMed] [Google Scholar]
- Sun W, Li N, He S. Large-scale morophological survey of rat retinal ganglion cells. Vis Neurosci. 2002;19:483–493. doi: 10.1017/s0952523802194107. [DOI] [PubMed] [Google Scholar]
- Suzuki S, Humayun MS, Weiland JD, Chen SJ, Margalit E, Piyathaisere DV, de Juan E., Jr Comparison of electrical stimulation thresholds in normal and retinal degenerated mouse retina. Jpn J Ophthalmol. 2004;48:345–349. doi: 10.1007/s10384-004-0084-9. [DOI] [PubMed] [Google Scholar]
- Thyagarajan S, van Wyk M, Lehmann K, Lowel S, Feng G, Wassle H. Visual function in mice with photoreceptor degeneration and transgenic expression of channel rhodopsin 2 in ganglion cells. J Neurosci. 2010;30:8745–8758. doi: 10.1523/JNEUROSCI.4417-09.2010. [DOI] [PMC free article] [PubMed] [Google Scholar]
- Tian N, Copenhagen DR. Visual stimulation is required for refinement of ON and OFF pathways in postnatal retina. Neuron. 2003;39:85–96. doi: 10.1016/s0896-6273(03)00389-1. [DOI] [PubMed] [Google Scholar]
- Van Wart A, Matthews G. Expression of sodium channels Nav1.2 and Nav1.6 during postnatal development of the retina. Neurosci Lett. 2006a;403:315–317. doi: 10.1016/j.neulet.2006.05.019. [DOI] [PMC free article] [PubMed] [Google Scholar]
- Van Wart A, Matthews G. Impaired firing and cell-specific compensation in neurons lacking nav1.6 sodium channels. J Neurosci. 2006b;26:7172–7180. doi: 10.1523/JNEUROSCI.1101-06.2006. [DOI] [PMC free article] [PubMed] [Google Scholar]
- Van Wart A, Trimmer JS, Matthews G. Polarized distribution of ion channels within microdomains of the axon initial segment. J Comp Neurol. 2007;500:339–352. doi: 10.1002/cne.21173. [DOI] [PubMed] [Google Scholar]
- Viney TJ, Balint K, Hillier D, Siegert S, Boldogkoi Z, Enquist LW, Meister M, Cepko CL, Roska B. Local retinal circuits of melanopsin-containing ganglion cells identified by transsynaptic viral tracing. Curr Biol. 2007;17:981–988. doi: 10.1016/j.cub.2007.04.058. [DOI] [PubMed] [Google Scholar]
- Volgyi B, Chheda S, Bloomfield SA. Tracer coupling patterns of the ganglion cell subtypes in the mouse retina. J Comp Neurol. 2009;512:664–687. doi: 10.1002/cne.21912. [DOI] [PMC free article] [PubMed] [Google Scholar]
- Vugler AA, Semo M, Joseph A, Jeffery G. Survival and remodeling of melanopsin cells during retinal dystrophy. Vis Neurosci. 2008;25:125–138. doi: 10.1017/S0952523808080309. [DOI] [PubMed] [Google Scholar]
- Wilke R, Gabel VP, Sachs H, Bartz Schmidt KU, Gekeler F, Besch D, Szurman P, Stett A, Wilhelm B, Peters T, Harscher A, Greppmaier U, Kibbel S, Benav H, Bruckmann A, Stingl K, Kusnyerik A, Zrenner E. Spatial resolution and perception of patterns mediated by a subretinal 16-electrode array in patients blinded by hereditary retinal dystrophies. Invest Ophthalmol Vis Sci. 2011;52:5995–6003. doi: 10.1167/iovs.10-6946. [DOI] [PubMed] [Google Scholar]
- Williams RW, Strom RC, Rice DS, Goldowitz D. Genetic and environmental control of variation in retinal ganglion cell number in mice. J Neurosci. 1996;16:7193–7205. doi: 10.1523/JNEUROSCI.16-22-07193.1996. [DOI] [PMC free article] [PubMed] [Google Scholar]
- Williams RW, Strom RC, Goldowitz D. Natural variation in neuron number in mice is linked to a major quantitative trait locus on Chr 11. J Neurosci. 1998;18:138–146. doi: 10.1523/JNEUROSCI.18-01-00138.1998. [DOI] [PMC free article] [PubMed] [Google Scholar]
- Winter JO, Cogan SF, Rizzo JF., 3rd Retinal prostheses: current challenges and future outlook. J Biomater Sci Polym Ed. 2007;18:1031–1055. doi: 10.1163/156856207781494403. [DOI] [PubMed] [Google Scholar]
- Yang G, Masland RH. Direct visualization of the dendritic and receptive fields of directionally selective retinal ganglion cells. Science. 1992;258:1949–1952. doi: 10.1126/science.1470920. [DOI] [PubMed] [Google Scholar]
Associated Data
This section collects any data citations, data availability statements, or supplementary materials included in this article.