

Abstract
Colorectal cancer (CRC) often arises from adenomatous colonic polyps. Polyps can grow and progress to cancer, but may also remain static in size, regress, or resolve. Predicting which progress and which remain benign is difficult. We developed a novel long-lived murine model of CRC with tumors that can be followed by colonoscopy. Our aim was to assess whether these tumors have similar growth patterns and histologic fates to human colorectal polyps to identify features to aid in risk-stratification of colonic tumors. Long-lived ApcMin/+ mice were treated with dextran sodium sulfate to promote colonic tumorigenesis. Tumor growth patterns were characterized by serial colonoscopy with biopsies obtained for immunohistochemistry and gene expression profiling. Tumors grew, remained static, regressed, or resolved over time with different relative frequencies. Newly developed tumors demonstrated higher rates of growth and resolution than more established tumors that tended to remain static in size. Colonic tumors were hyperplastic lesions (3%), adenomas (73%), intramucosal carcinomas (20%), or adenocarcinomas (3%). Interestingly, the level of β-catenin was higher in adenomas that became intratumoral carcinomas as compared to those that failed to progress. In addition, differentially expressed genes between adenomas and intramucosal carcinomas were identified. This novel murine model of intestinal tumorigenesis develops colonic tumors that can be monitored by serial colonoscopy, mirror growth patterns seen in human colorectal polyps, and progress to CRC. Further characterization of cellular and molecular features are needed to determine which features can be used to risk-stratify polyps for progression to CRC and potentially guide prevention strategies.
Keywords: mouse model of colorectal cancer, colon polyp growth patterns, colorectal cancer screening, colon polyp risk stratification, colon polyp characterization
INTRODUCTION
Colorectal cancer (CRC) is the second-leading cause of cancer-related deaths in the United States (1). CRC most often arises in adenomatous polyps that form throughout the colon. The current model of colorectal tumorigenesis posits a stepwise accumulation of mutations in tumor suppressor genes, oncogenes, and genetic instability genes, giving rise to adenomatous polyps that progress to adenocarcinoma over a period of years (2,3). However, only a small fraction of polyps progress to cancer. Observational studies have shown that over time colorectal polyps can grow, remain static in size, regress (or decrease in size), or resolve altogether (4–6). Because of their malignant potential, polyps that are identified on screening colonoscopy are removed. Increased surveillance is recommended after polyps are found (7), further straining a medical system that already struggles to meet the demand for screening and diagnostic colonoscopies, both in terms of cost (8) and available providers (9). Additionally, colonoscopy and polypectomy are not without risk; colonic perforation occurs at a low but predictable rate during colonoscopy (10), and significant post-colonoscopy bleeding is more likely to occur after polypectomy (11).
Current efforts are focused on risk-stratifying patients with colorectal polyps. A potential method for quantifying risk for CRC would be to identify polyps that are more likely to grow and progress to cancer and those that are likely to be benign. Attempts have been made to predict polyp fate and carcinogenic potential using the size and number of polyps, as well as histologic features of removed polyps (7). It is currently unknown if analysis of gene expression profiles from polyps can add further specificity to risk predictions. Researchers have attempted to identify differential gene expression profiles between normal colonic mucosa, adenomatous polyps, and CRC in humans (12), as well as correlate gene expression profiles with colonoscopic findings (13). However, the information gathered from gene expression profiles in human tumors is difficult to interpret functionally because of molecular heterogeneity in neoplastic tissue coupled with the genetic variability inherent in human populations.
Animal models can minimize genetic variation while allowing experimental manipulation of tumorigenesis. Our group has developed a long-lived mouse model with a germline truncating mutation in the mouse homolog of APC that forms adenomatous colonic polyps which can be monitored by serial colonoscopies (14,15). We previously showed that 24 to 87% of intestinal tumors in this model progress to adenocarcinoma, and 3% develop nodal metastases. These cancers develop without a high level of microsatellite instability or chromosomal gains or losses (15). We have now extended our previous work by meticulously characterizing the natural history of colonic tumors in this model to determine whether colonic tumors have growth patterns similar to those of colonic polyps in humans. We observed five distinct growth patterns as well as benign and malignant pathology. We have also begun to characterize molecular features of tumors with different degrees of invasiveness in this model.
MATERIALS AND METHODS
Mouse Husbandry and Genotyping
All animals were studied in the Wisconsin Institute for Medical Research vivarium under protocols approved by the Institutional Animal Care and Use Committee at the University of Wisconsin following American Association for the Assessment and Accreditation of Laboratory Animal Care guidelines. All mice were housed in climate-controlled rooms with 12-hour light/dark cycles and given food and water ad libitum except as discussed below. Mice were generated by crossing SWR females (SWR/J; The Jackson Laboratory; Stock Number 00689) with C57BL/6 ApcMin/+ males (C57BL/6J-ApcMin/J; The Jackson Laboratory; Stock Number 002020). F1 ApcMin/+ hybrids (F1 Min) were identified by genotyping at Apc using a previously described polymerase chain reaction (PCR) assay (16).
Dextran Sodium Sulfate Treatment
At or within one week of weaning (24–35 days of age), F1 Min mice were treated with dextran sodium sulfate (DSS, average M.W. 500,000; Fisher Scientific, Waltham, MA), to increase colonic tumor multiplicity. Mice were given a 4% solution of DSS dissolved in water ad libitum for four days, followed by 17 days of regular water, and then a second cycle of 4% DSS for four days (17). After allowing 30 days for tumor initiation, the colonoscopic surveillance and biopsy protocols were begun (Supplementary Figure 1). A total of 273 mice were enrolled in the surveillance protocol, but only 101 remained on this protocol until they became moribund. Note that 172 mice were randomly removed from the surveillance protocol for various drug studies. Only images of colonic tumors that were collected prior to treatment were used to assess growth behavior. A total of 12 mice were enrolled in the biopsy protocol.
Surveillance Protocol
The distal four centimeters of the colon were visualized in 273 DSS-treated F1 Min mice by colonoscopy using the Karl Storz Coloview system as previously described (18). Briefly, mice were anesthetized using inhaled isoflurane. The distal colon was prepped using enemas of phosphate buffered solution (PBS) until clear of fecal pellets and debris. Room air delivered by a compressed air pump through the operating sheath of the colonoscope was used to insufflate the colon. The colonoscope was inserted distally and advanced as far proximally as possible, typically until a sharp bend in the colon was encountered, and then slowly withdrawn. The colonic mucosa was inspected during withdrawal, and digital video of the mucosa was recorded. Still images were collected of any tumors as they were encountered. To standardize images for comparison of discrete tumors over time, the colon was maximally insufflated and the colonoscope was positioned so that the entire tumor could be seen with the base of the tumor just at the edge of the screen (demonstrated in Figure 1). Mice were monitored post-procedurally and allowed to recover from anesthesia. Mice underwent surveillance colonoscopy in this fashion every three weeks to monitor the growth pattern of tumors (Supplementary Figure 1A).
Figure 1. Colonic tumor growth patterns over time.

Tumors were evaluated by serial colonoscopies in live mice. Tumors could grow over time, remain static, regress, or resolve completely. Panel A shows a single tumor that grew steadily over the course of five and a half months. Panel B shows a tumor that remained stable in size over three months. Panel C shows a tumor that regressed and resolved over the course of two and a half months. Panel D represents the changing proportions of tumor growth patterns over time. The x-axis represents tumor age from the time it was first identified by colonoscopy in days, with the total number of tumors assessed at that age noted. The y-axis represents the proportion of tumors at that age exhibiting various growth patterns. Proportions of observed growth patterns varied with tumor age. There were higher rates of growth or resolution in newly developed tumors, and higher rates of stasis or prolapse as tumors aged. Regression, where tumors decreased in size without resolving completely, occurred at a low rate over the lifespans of the mice.
Still images of tumors from 273 animals were annotated for serial comparisons. Each tumor image was compared with the corresponding image from the previous colonoscopy session and rated by a single reviewer as growing, remaining static in size, regressing, resolved, prolapsing from the anus, or unable to assess. Tumor age was defined as the number of days since a tumor was first identified on colonoscopy.
Tumor Histology Assessment
When mice became moribund, they were sacrificed by CO2 asphyxiation. The entire intestinal tract was removed, opened longitudinally and washed with PBS, fixed for 16 to 24 hours in 10% buffered formalin (Fisher Scientific, Waltham, MA), and stored in 70% ethanol. Using a stereomicroscope, the total number of tumors in the small intestine and colon was counted. A randomly selected representative sample of 54 small intestinal tumors from six mice and 30 colonic tumors from 16 mice that had been followed by surveillance colonoscopy were removed for histologic evaluation. These tumors were paraffin-embedded, cut into 5 µm sections, and hematoxylin-eosin (H&E) stained prior to assessment of tumor invasiveness by a veterinary pathologist.
Biopsy Protocol
The operating sheath housing the colonoscope possesses a working channel that allows passage of 3 French biopsy forceps, which is 5mm in size when fully opened. A cohort of 12 mice with tumors amenable to biopsy was identified at their first colonoscopy. These tumors underwent biopsy when mice were approximately 90 days of age. Following this initial procedure, tumors were visually assessed by colonoscopy every 14 days with additional biopsies collected every 28 days until tumors resolved completely or mice became moribund (Supplementary Figure 1B). During each procedure, two biopsies were collected from each tumor. One was stabilized in RLT buffer with β-mercaptoethanol or RNALater (Qiagen, Valencia, CA) for RNA purification, and stored at −80° C until processing. The other was fixed in 10% buffered formalin (Fisher Scientific) for 24 hours and then stored in 70% ethanol for paraffin embedding and histologic evaluation.
A set of 12 tumor biopsies from six tumors was chosen for immunohistochemistry and gene expression analysis. These paired samples were chosen from the earliest and latest biopsies available for each tumor.
Immunohistochemistry
Immunohistochemical analysis of the tumor biopsies was also performed using anti-β-catenin antibody (D10A8, Cell Signaling Technology; 19). Samples were fixed, embedded, and cut as described above. Antigen retrieval was performed using 10mM citrate buffer heated to boiling for 32 minutes and blocked for endogenous peroxidase using Peroxidazed 1 (Biocare Medical). Slides were blocked in 5% milk in PBST for 45 minutes, then incubated overnight at 4°C with anti-β-catenin antibody diluted 1:200 in PBST. Slides were treated with HRP-conjugated anti-rabbit secondary antibody (MACH 2 Rabbit HRP-Polymer, Biocare Medical), detected with DAB Chromogen (Biocare Medical), counterstained with CAT Hematoxylin (Biocare Medical), dehydrated, and cover-slipped.
RNA Purification
Samples were disrupted in RLT buffer with a Kontes Pellet Grinder (Kimple & Chase, Vineland, NJ). RNA was extracted using the RNEasy Micro Kit (Qiagen) following manufacturer's instructions. The Nanodrop DU-800 (Thermo Scientific, Waltham, MA) was used to quantify yield and assess purity.
Gene Expression Analysis
Affymetrix Mouse Gene 1.0 ST GeneChips (Affymetrix, Santa Clara, CA) were used for microarray analysis. Hybridization and scanning of the chips were performed by the Gene Expression Center at the University of Wisconsin Biotechnology Center according to standard Affymetrix protocol. Chips were normalized by robust multiarray averaging using the XPS system (20). Following preliminary analyses involving per gene analysis of variance, differential expression between adenomas and intramucosal carcinomas was measured by Student's t-test and fold change. We screened by fold change exceeding 2 and by unadjusted p-value less than 0.05. The false discovery rate (FDR) in the reported gene list was determined by the q-value method (21), and could not be reduced below 51% given the sample size. Functional categories showing adenoma/intramucosal carcinoma differential expression were assessed by standardized average (over category) log fold changes, as computed in the R package allez (22). We screened for categories with outlying Z scores relative to category size.
Reverse transcription and qPCR
RNA quantification was performed on a Nano-Drop DU-800 (Thermo-Fisch). cDNA was generated by reverse transcription of 50ng of total RNA, which had been stored at −80°C, according to the manufacturer’s recommendation (ImProm II Reverse Transcription System, Promega). cDNA was stored at −20°C. Control cDNA was generated from Mouse Total Colon RNA (Clontech).
Commercially available primer and hydrolysis probe sequences for Tnfsf10 (Mm00446973_m1), Lcn2 (Mm01283606_m1), Muc2 (Mm01276696_m1), Tff3 (Mm00495590_m1), RetnlB (Mm00445845_m1), and Tbp (Mm00446973_m1) were identified using the Taqman Assay Search tool (Invitrogen). The hydrolysis probes contained fluorescein amidite (FAM) as a reporter molecule. Reactions were done in triplicate for each tumor. Assays were performed in a volume of 20µL including Taqman Gene Expression Master Mix (Applied Biosystems), primer/hydrolysis probe sets, and 1.5 ng of RNA. A CFX96 Touch™ Real-Time PCR Detection System (Bio-Rad) was used with the cycling conditions: 2:00 at 50°C, 10:00 at 95°C followed by 45 cycles of 0:15 at 95°C and 1:00 at 60°C. Upon completion of cycles, a melt curve analysis was performed. All values were calculated using the CFX Manager software (Bio-Rad).
Resulting data were analyzed by the quantification cycle (Ct) method as means of relative quantification of gene expression. Values were normalized to an endogenous reference (TBP) and relative expression was compared to a normalized Ct value obtained from Mouse Total Colon control cDNA and subsequently expressed as 2−ΔΔCt. Wilcoxon Rank Sum Test was performed for statistical evaluation.
RESULTS
Model Characteristics
A cohort of DSS-treated F1 Min mice (n=101) that did not undergo any additional interventions and were followed with colonoscopy every three weeks lived an average of 282 days (range 109–361 days, standard deviation [SD] 56 days). Almost all (99%) of the mice were found to have at least one intestinal tumor. They developed a mean of 12 tumors throughout the intestinal tract (median 12, range 0–32), with a mean of 10 in the small intestine (median 9, range 0–28) and 3 in the colon (median 2, range 0–9). The majority of colonic tumors arose in the distal portion where they could be easily monitored by colonoscopy. Mean age for developing distal colonic tumors seen on colonoscopy was 121 days. Forty percent of mice had at least one tumor at the time of their first colonoscopy (age 77–90 days). They continued to develop colonic tumors throughout their lives, with some tumors first identified as late as 306 days of age (Supplementary Table 1).
Tumor Growth Patterns
Colonic tumors in F1 Min mice had five distinct growth patterns: growth, stasis, regression (tumor decreased in size but did not resolve), resolution, and prolapse, which were evident by comparing standardized images that were collected at different times (Supplementary Figure 1 Panel A; Figure 1 Panels A-D). Tumor growth was most frequently seen in newly developed tumors (45% of 21 day old tumors versus 11% of tumors 147 days old). Resolution was also most frequently seen in tumors that had recently formed and tended to be relatively small (7% of 21 day old tumors compared to 1% of tumors 147 days old). Conversely, tumors that had been present longer and tended to be larger occluding half of the lumen or more were more likely to remain static in size (36% of 21 day old tumors versus 52% of tumors 147 days of age). The percentage of tumors that prolapsed also increased over time (3% of 21 day old tumors compared to 30% of 147 day old tumors). These lesions tended to be located near the anus. Tumor regression was seen at a low rate throughout the lifespan of the mice, ranging from 1% to 6% at various time points (Figure 1 Panel D). Thus, the growth patterns of tumors varied with the age of the tumor.
Tumor Pathology
A subset of randomly selected small intestinal and colonic tumors from mice in the surveillance protocol cohort underwent histologic evaluation. Fifty-four small intestinal tumors were collected from six DSS-treated F1 Min mice and were analyzed by an experienced veterinary pathologist to assess tumor invasiveness. The six mice had a mean age at death of 280 days (range 185–326 days). Thirty-one tumors were adenomas (57%), 10 were intramucosal carcinomas (19%), and 13 were adenocarcinomas (24%). Many adenomas showed high-grade dysplasia (Figure 2 Panels A-C). Similarly, 30 colon tumors that had been followed by colonoscopy were collected from 16 mice and underwent histologic evaluation by an experienced veterinary pathologist. One was a hyperplastic lesion (3%), 22 were adenomas (73%), six were intramucosal carcinomas (20%), and one was adenocarcinoma (3%). Again, adenomas often displayed high grade dysplasia (Figure 2 Panels D-F). Thus, tumors in the small intestine and colon ranged from benign to malignant lesions.
Figure 2. Histology of Intestinal Tumors.
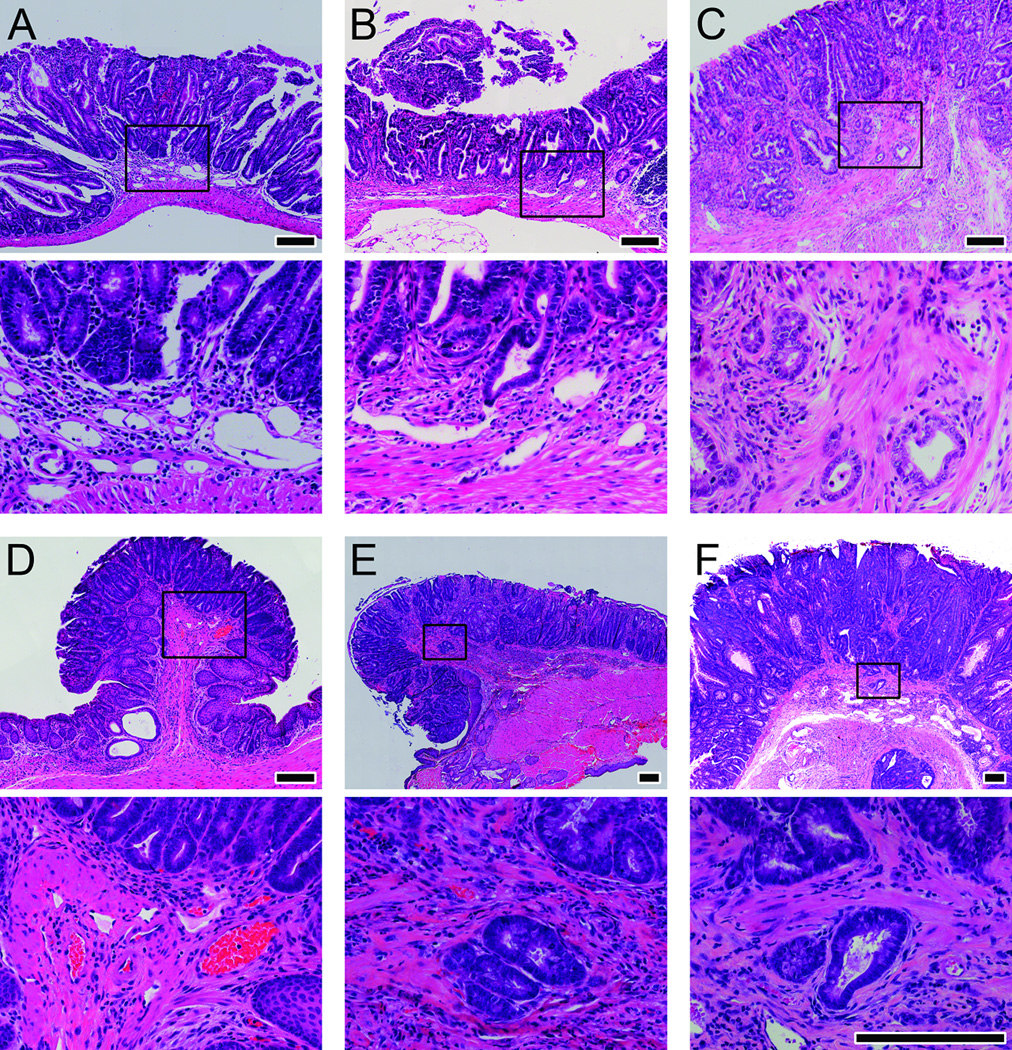
H&E micrographs of adenomas, intramucosal carcinomas, and adenocarcinomas from the small intestine and colon of DSS-treated F1 Min mice. Panel A shows a small intestinal adenoma. Panel B shows small intestinal intramucosal carcinoma. Panel C shows small intestinal adenocarcinoma. Panel D shows a colonic adenoma. Panel E shows colonic intramucosal carcinoma. Panel F shows colonic adenocarcinoma. The boxed area in the top photo of each panel is enlarged in the corresponding bottom photo. Size bars for the top photos in each panel are 200µm. The bottom photos for each panel are all shown at the same magnification with size bars of 200µm.
Serial Biopsies of Tumors
Twelve mice, six males and six females, with distal colon tumors identified on initial colonoscopy at approximately 80 days of age underwent serial biopsies of tumors every 28 days until moribund as described above (Supplementary Figure 1B). They lived an average of 272 days (range 157–409 days). They had a mean of 19 tumors throughout their intestinal tracts (median 13, range 8–46), and a mean of two colon tumors monitored by colonoscopy (median 2, range 1–5). Because of the variation in their lifespan, different numbers of biopsies were collected from each animal. The mean number of biopsies was seven (range two to twelve). Moribund mice were sacrificed and tumors were collected. Nine tumors were sent for histologic evaluation. There were three adenomas and six intramucosal carcinomas. There were no hyperplastic lesions or invasive adenocarcinomas. Other tumors were not analyzed for a variety of reasons. One mouse died unexpectedly, preventing removal of the colon tumor. Another tumor underwent resolution after three biopsies had been collected. Additionally, one tumor prolapsed from the anus, precluding histological analysis.
Six pairs of biopsies and corresponding whole tumors (three adenomas and three intramucosal carcinomas) from six mice were stained for β-catenin (Figure 3). Interestingly, adenomas (3/3) that failed to progress tended to have lower levels of β-catenin within the cytoplasm and nucleus (Figure 3; Panels A and B), whereas those (2/3) that progressed to intramucosal carcinomas tended to have higher levels of β-catenin within the cytoplasm and nucleus (Figure 3; Panels C and D).
Figure 3. Immunohistochemistry of biopsies and whole colonic tumors for β-catenin.
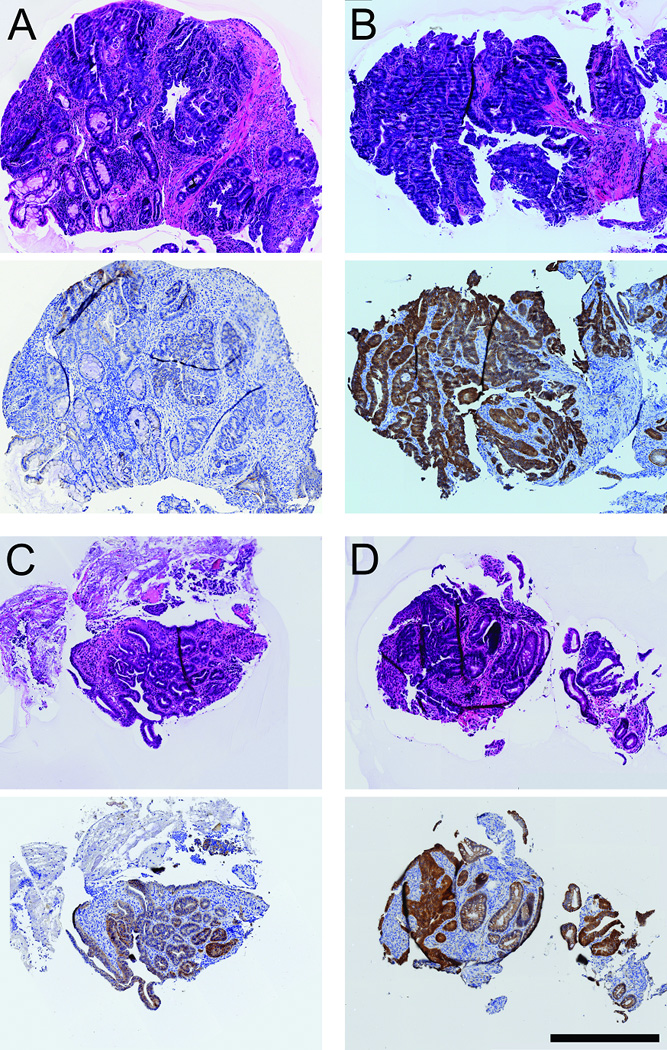
All panels show H&E staining above and anti-β-catenin staining below. β-catenin was detected using immunohistochemistry with diaminobenzedine staining; the tissue was counterstained with hematoxylin. Panels A and B show early and late biopsies, respectively, of an adenoma. Panels C and D show early and late biopsies, respectively, of an intramucosal carcinoma. Size bar, 500µm.
These same biopsies were analyzed for changes in gene expression that occurred over time. There was no significant differential gene expression between early and late biopsies. However, a modest differential expression was detected between adenomas and intramucosal carcinomas, regardless of whether the biopsies were from an early or late time point (Supplementary Figure 2). We report a list of 68 genes exhibiting differential expression between adenomas and intramucosal carcinomas (Supplementary Table 2). Of note, Resistin-like beta (Retnlb or REMLβ), Mucin 2 (Muc2), and Intestinal trefoil factor 3 (Tff3) were expressed at a higher level in adenomas relative to intramucosal carcinoma, whereas Tumor necrosis factor (ligand) superfamily, member 10 (Tnfsf10) and Lipocalin 2 (Lcn2) were overexpressed in intramucosal carcinoma relative to adenomas (Table 1). These differences were confirmed by quantitative PCR in all cases, except Tnfsf10 for which the difference was trending in the same direction as observed by microarray, but it was not quite statistically significant. In addition to these, a number of genes related to immune function and cell adhesion were differentially expressed, which may have an impact on the invasive and metastatic potential of these tumors (Supplementary Table 2). Although these 68 genes showed the strongest differential expression within this data set, the gene-level p-values are not FDR corrected. While we report genes with at least a 2-fold change in expression level and an unadjusted p-value ≤0.05, because of the FDR, we can predict that about half of these genes will not be validated on quantitative studies. In addition, functional categories in gene ontology showing adenoma/intramucosal carcinoma differential expression were examined (Supplementary Table 3). Differentially expressed gene categories included those related to condensin complex, minichromosome maintenance (MCM) complex, small nucleolar RNA (snoRNA) binding, positive regulation of helicase activity, centromeric heterochromatin, and condensed chromosome, centromeric region (Supplementary Table 4).
Table 1. Differentially Expressed Genes between Adenomas and Intramucosal Carcinomas with Known Associations to Colorectal Cancer.
Gene expression was assessed using quantitative PCR for 3 samples each of adenomas and intramucosal carcinomas and normalized to a reference gene.
| Genes Expressed at a Higher Level in Adenomas Relative to Intramucosal Carcinoma | |||||
|---|---|---|---|---|---|
| Gene Symbol |
Gene Name | Gene Function | Expression (fold change to normal colon control), mean ± SD |
P- value* |
|
| Adenoma | Intramucusal | ||||
| Retnlb | resistin like beta | activity in gut parasite infection, goblet cell function, Th2 associated cytokine with inflammatory and remodeling activity; goblet cells |
0.20 ± 0.08 | 0.015 ± 0.012 | 0.024 |
| Muc2 | mucin 2 | intestinal mucus production, linked with gastric cancer, colon cancer, IBD, NEC; goblet cells |
−1.54 ± 2.13 | −29.96 ± 20.23 | 0.024 |
| Tff3 | trefoil factor 3, intestinal | proteinaceous extracellular matrix, secretory granules, loss leads to profound susceptibility to DSS colitis, mucosal repair functions; goblet cells |
0.294 ± 0.239 | 0.044 ± 0.035 | 0.024 |
| Genes Overexpressed in Intramucosal Carcinoma Relative to Adenomas | |||||
| Tnfsf10 | tumor necrosis factor (ligand) superfamily, member 10 |
TNF receptor binding, cytokine activity, positive regulation of apoptotic processes |
0.85 ± 0.57 | 1.52 ± 0.47 | 0.063 |
| Lcn2 | lipocalin 2 | apoptosis, innate immune response, ion transport, cellular response to hydrogen peroxide |
15.0 ± 7.4 | 50.7 ± 30.4 | 0.024 |
One-sided Wilcoxon rank sum test
DISCUSSION
We have extended our previous work using a long-lived mouse model of CRC that carries a truncating mutation in Apc and develops multiple neoplastic lesions throughout the intestinal tract, including tumors progressing to adenocarcinoma. After treating with DSS to increase colonic tumor multiplicity, we meticulously documented the natural history of colonic tumors by serial colonoscopies in a large cohort of experimental animals (424 tumors in 273 mice). Colonic tumors in this model exhibit fates remarkably similar to adenomatous colonic polyps in humans; some grow, some remain static, some regress, and some resolve spontaneously. The fate of newly developed tumors is variable, with alterations in growth patterns over time, but as tumors age their size becomes more stable. Tumors also showed a variety of pathological fates, ranging from hyperplasic lesions to adenocarcinoma, although the rates of invasive cancer were much lower in the colon compared to the small intestine (3% vs. 24%). Interestingly, adenomas that progressed often had a higher level of β-catenin. Moreover, using a small cohort of tumors, we identified differences in gene expression between adenomas and intramucosal carcinomas, including genes linked to CRC. Interestingly, we did not find differences in gene expression over time when comparing gene expression profiles between early and late biopsies taken from the same tumor.
Numerous studies have documented the variable growth patterns of colorectal polyps in human populations (4–6). While a certain proportion of colorectal polyps will grow, remain stable in size, regress, or resolve altogether, the underlying mechanisms behind these divergent fates are not understood. Because it can take 10–17 years for polyps to progress to cancer in humans (23) and because polyps are removed when found on colonoscopy, longitudinal studies to understand the interactions between the host and the tumor are prohibitively difficult. Our murine model mirrors the growth patterns seen in human colorectal polyps, making it a valuable tool for discovering methods of risk-stratifying colonic tumors, as colonic tumors in these animals can be followed with serial biopsies to assess changes within tumors over time.
Newly developed tumors were more likely to grow or resolve, while more established tumors, which remain fairly static in size, seemed to have reached a level of accommodation with the organism. This model could be used to examine factors intrinsic to the host organism which impact polyp growth, such as host immune responses to tumors and the inflammatory response to premalignant lesions. A number of genes related to immune function and increased T-cell activity were relatively overexpressed in intramucosal carcinomas relative to adenomas (Table 1, Supplementary Table 2), indicating that this model may be useful for investigating the interplay between tumor and host immune system. Being able to predict which tumors will be contained by the host and remain static or regress spontaneously and which will break free of host constraints to continue to grow and progress to cancer would be invaluable both for understanding the natural history of CRC as well as risk-stratifying patients.
While we have presented an extensive characterization of the growth patterns and histology of colonic tumors in DSS-treated F1 Min mice, we have only preliminarily begun to describe molecular and genetic characteristics of these tumors. In this small sample, we did not find differentially expressed genes between early and late biopsies of tumors followed longitudinally. If these tumors progress along the same adenoma-carcinoma sequence that has been described in human colonic tumors, we might have expected to see changes in gene expression over time. However, this was not observed. This may be related to the dynamics of tumor progression in this animal model, but could also be explained by the small sample size. Alternatively, this may be a manifestation of cancer predetermination; by the time colonic tumors are large enough to be detected, they have already acquired mutations that will cause them to become invasive (24).
We did identify a number of differentially expressed genes that have been linked to intestinal tumors in ApcMin/+ mice and human CRC in this small sample of tumors. Resistin-like molecule beta (RELMβ, Retnlb), Mucin 2 (Muc2), and Intestinal trefoil factor 3 (Tff3) were expressed at a higher level in adenomas relative to intramucosal carcinomas. These genes encode for proteins secreted by goblet cells in the intestine, which play roles in innate intestinal immunity and response to injury (25–27). All have been linked to intestinal tumors in ApcMin/+ mice and human CRC (27–33). Tumor necrosis factor (ligand) superfamily, member 10 (Tnfsf10) and Lipocalin 2 (Lcn2) were overexpressed in intramucosal carcinoma relative to adenomas and are also linked to ApcMin/+ intestinal tumors and human CRC. Tnfsf10, which is involved in the tumor necrosis factor-related apoptosis-induced ligand (TRAIL) apoptotic pathway, is dysregulated in both ApcMin/+ tumors and human polyps (34–36). Elevated lipocalin 2, a molecule involved in innate immunity and iron metabolism (37), has been found in both ApcMin/+ tumors and human CRC (38,39) and may function as either a tumor suppressor or promoter depending on location in the intestine (40). All of these results need to be confirmed in larger samples and by quantitative PCR before definitive statements can be made about their role in tumor formation and progression in this model.
There are important limitations to this model. F1 Min mice carry a germline mutation in Apc, which is analogous to familial adenomatous polyposis (FAP) syndrome in humans. While hereditary CRC from syndromes such as FAP and hereditary nonpolyposis colon cancer (HNPCC) account for approximately 5–10% of all cases of CRC, the vast majority of cancers arise sporadically. Because it is a germline mutation, additional aberrations are seen in immune function, bone marrow microenvironment, and ammonia metabolism in the Min mouse (41). As with most models of CRC, the rate of adenocarcinoma is low, and most polyps remain benign adenomas (41). This may be related to the relatively short lifespan of Min mice (typically three to four months), which does not allow sufficient time for accumulation of additional mutations that would allow tumors to progress to invasive cancer. However, even in our long-lived F1 Min mice with a mean lifespan of about nine months, the rate of invasive lesions was low, particularly in the colon, and there was no evidence grossly of metastatic disease. In this sense, this model does not fully recapitulate the natural history of human CRC. Additionally, we used DSS, an inflammatory agent, to increase colon tumor multiplicity. While chronic inflammation is certainly a risk factor for CRC as is seen in the increased incidence of cancer in patients with inflammatory bowel disease, the role of inflammation in sporadic CRC is incompletely understood (42). The utility of murine models of CRC lies in their relative simplicity. By introducing this additional element to our model, we have added further complexity and potentially moved the model away from the natural history of sporadic human CRC in the general population, although we do observe similar outcomes in mice and humans.
This model affords a number of exciting future directions for research. We want to expand our characterization of the molecular and genetic changes identified by our preliminary work with additional immunohistochemistry and quantitative PCR. This model could be used to investigate chemopreventive interventions. Because the early steps of tumorigenesis for many cases of CRC are recapitulated here, it provides an opportunity to intervene early in the adenoma-carcinoma sequence. We have carefully characterized the underlying growth patterns of colorectal tumors and can therefore effectively measure relative changes in growth patterns and rates of tumor regression induced by preventive measures. A criticism of mouse models of human CRC has been that they are not predictive; rather, investigators often report the effect on the multiplicity of intestinal tumors along the entire length of the intestinal tract instead of the colon which is likely to be the most relevant to human disease. The F1 Min characterized in this study would be highly beneficial in testing newly developed preventive measures as the results are likely to be more predictive of outcomes in human populations. Finally, since we have observed adenocarcinoma in this model, it can also serve as a platform for investigating and characterizing responses to chemotherapeutic agents.
In summary, we have developed a long-lived mouse model of CRC that develops tumors in the distal colon that can be monitored by serial colonoscopy, shows distinct growth patterns similar to those seen in human colorectal polyps, and develops lesions that progress to adenocarcinoma. Serial biopsies of tumors in this model allow examination of cellular and molecular features of tumors over time. This novel murine model of colorectal cancer can be used to find promising prognostic targets that could lead to improved risk-stratification of patients with polyps or cancers identified on colonoscopy, thereby improving this important but imperfect screening tool.
Supplementary Material
Acknowledgments
GRANT SUPPORT
The authors would like to thank the National Institutes of Health for funding support: T32 CA090217 (Terrah J. Paul Olson), T32 CA009135 (Jamie N. Hadac, Christopher D. Zahm), T32 CA009614 (Dustin A. Deming), P30 CA014520 (Ruth Sullivan), R21 HG006568 (Michael A. Newton), and R21 CA170876 (William R. Schelman, Gregory D. Kennedy, and Richard B. Halberg). We would also like to thank the Division of Gastroenterology and Hepatology, Department of Medicine, University of Wisconsin School of Medicine and Public Health and from University of Wisconsin Paul P. Carbone Cancer Center for funding support.
Footnotes
Financial Support:
Terrah J. Paul Olson: NIH T32 CA090217 (PI: Herbert Chen)
Jamie N. Hadac: NIH T32 CA009135 (PI: Bill Sugden)
Chelsie Kohns Sievers: none
Alyssa A. Leystra: NIH T32 CA009135 (PI: Bill Sugden)
Dustin A. Deming: NIH T32 CA009614 (PI: Douglas McNeel)
Christopher D. Zahm: NIH T32 CA009135 (PI: Bill Sugden)
Dawn M. Albrecht: none
Alice Nomura: none
Laura A. Nettekoven: none
Lauren K. Plesh: none
Linda Clipson: none
Ruth Sullivan: P30 CA014520
Michael A. Newton: NIH R21HG006568
William R. Schelman: NIH R21 CA170876
Richard B. Halberg: NIH R21 CA170876, start-up funds from Division of Gastroenterolgoy and Hepatology, Department of Medicine, University of Wisconsin School of Medicine and Public Health and from University of Wisconsin Paul P. Carbone Cancer Center
Disclosures:
Terrah J. Paul Olson: none
Jamie N. Hadac: none
Chelsie K. Sievers: none
Alyssa A. Leystra: none
Dustin A. Deming: none
Christopher D. Zahm: none
Dawn M. Albrecht: none
Alice Nomura: none
Laura A. Nettekoven: none
Lauren K. Plesh: none
Linda Clipson: none
Ruth Sullivan: none
Michael A. Newton: none
William R. Schelman: none
Richard B. Halberg: none
REFERENCES
- 1.Siegel RD, Naishadham D, Jemal A. Cancer statistics, 2012. CA Cancer J Clin. 2012;62(1):10–29. doi: 10.3322/caac.20138. 2. [DOI] [PubMed] [Google Scholar]
- 2.Vogelstein B, Fearon ER, Hamilton SR, Kern SE, Preisinger AC, Leppert M, et al. Genetic alterations during colorectal-tumor development. NEJM. 1988;319(9):525–532. doi: 10.1056/NEJM198809013190901. [DOI] [PubMed] [Google Scholar]
- 3.Vogelstein B, Kinzler KW. Cancer genes and the pathways they control. Nat Med. 2004;10(8):789–799. doi: 10.1038/nm1087. [DOI] [PubMed] [Google Scholar]
- 4.Hofstad B, Vatn MH, Anderson SN, Huitfeldt HS, Rognum T, Larsen S, et al. Growth of colorectal polyps: redetection and evaluation of unresected polyps for a period of three years. Gut. 1996;39(3):449–456. doi: 10.1136/gut.39.3.449. [DOI] [PMC free article] [PubMed] [Google Scholar]
- 5.Loeve F, Boer R, Zauber AG, van Ballegooijen M, van Ooortmarssen GJ, Winawer S, et al. National Polyp Study data: evidence for regression of adenomas. Int J Cancer. 2004;111(4):633–639. doi: 10.1002/ijc.20277. [DOI] [PubMed] [Google Scholar]
- 6.Togashi K, Shimura K, Konishi F, Miyakura Y, Koinuma K, Horie H, et al. Prospective observation of small adenomas in patients after colorectal cancer surgery through magnification chromocolonoscopy. Dis Colon Rectum. 2008;51(2):196–201. doi: 10.1007/s10350-007-9106-2. [DOI] [PubMed] [Google Scholar]
- 7.Winawer SJ, Zauber AG, Fletcher RH, Stillman JS, O’Brien MJ, Levin B, et al. Guidelines for colonoscopy surveillance after polypectomy: a consensus update by the US Multi-Society Task Force on Colorectal Cancer and the American Cancer Society. CA Cancer J Clin. 2006;56(3):143–159. doi: 10.3322/canjclin.56.3.143. [DOI] [PubMed] [Google Scholar]
- 8.Seeff LC, Manninen DL, Dong FB, Chattopadhyay SK, Nadel MR, Tangka FKL, et al. Is there endoscopic capacity to provide colorectal cancer screening to the unscreened population in the United States? Gastroenterology. 2004;127(6):1661–1669. doi: 10.1053/j.gastro.2004.09.052. [DOI] [PubMed] [Google Scholar]
- 9.Ladabaum U, Song K. Projected national impact of colorectal cancer screening on clinical and economic outcomes and health services demand. Gastroenterology. 2005;129(4):1151–1162. doi: 10.1053/j.gastro.2005.07.059. [DOI] [PubMed] [Google Scholar]
- 10.Arora G, Mannalithara A, Singh G, Gerson LB, Triadafilopoulos G. Risk of perforation from a colonoscopy in adults: a large population-based study. Gastrointest Endosc. 2009;69(3pt2):654–664. doi: 10.1016/j.gie.2008.09.008. [DOI] [PubMed] [Google Scholar]
- 11.Kapetanos D, Beltsis A, Chatzimavroudis G, Katsinelos P. Postpolypectomy bleeding: incidence, risk factors, prevention, and management. Surg Laparosc Endosc Percutan Tech. 2012;22(2):102–107. doi: 10.1097/SLE.0b013e318247c02e. [DOI] [PubMed] [Google Scholar]
- 12.Dai YC, Zhu XS, Nan QZ, Chen ZX, Xie JP, Fu YK, et al. Identification of differential gene expressions in colorectal cancer and polyp by cDNA microarray. World J Gastroenterol. 2012;18(6):570–575. doi: 10.3748/wjg.v18.i6.570. [DOI] [PMC free article] [PubMed] [Google Scholar]
- 13.Cattaneo E, Laczko E, Buffoli F, Zorzi F, Bianco MA, Menigatti M, et al. Preinvasive colorectal lesion transcriptomes correlate with endoscopic morphology (polypoid vs. nonpolypoid) EMBO Mol Med. 2011;3(6):334–347. doi: 10.1002/emmm.201100141. [DOI] [PMC free article] [PubMed] [Google Scholar]
- 14.Durkee BY, Shinki K, Newton MA, Iverson CE, Weichert JP, Dove WF, et al. Longitudinal assessment of colonic tumor fate in mice by computed tomography and optical colonoscopy. Acad Radiol. 2009;16(12):1475–1482. doi: 10.1016/j.acra.2009.07.023. [DOI] [PMC free article] [PubMed] [Google Scholar]
- 15.Halberg RB, Waggoner J, Rasmussen K, White A, Clipson L, Prunuske JA, et al. Long-lived Min mice develop advanced intestinal cancer through a genetically conservative pathway. Cancer Res. 2009;69(14):5768–5775. doi: 10.1158/0008-5472.CAN-09-0446. [DOI] [PMC free article] [PubMed] [Google Scholar]
- 16.Su LK, Kinzler KW, Vogelstein B, Preisinger AC, Moser AR, Luongo C, et al. Multiple intestinal neoplasia caused by a mutation in the murine homolog of the APC gene. Science. 1992;256(5057):668–670. doi: 10.1126/science.1350108. [DOI] [PubMed] [Google Scholar]
- 17.Cooper HS, Everley L, Chang WC, Pfeiffer G, Lee B, Murthy S, et al. The role of mutant Apc in the development of dysplasia and cancer in the mouse model of dextran sulfate sodium-induced colitis. Gastroenterology. 2001;121(6):1407–1416. doi: 10.1053/gast.2001.29609. [DOI] [PubMed] [Google Scholar]
- 18.Becker C, Fantini MC, Neurath MF. High resolution colonoscopy in live mice. Nat Protoc. 2006;1(6):2900–2904. doi: 10.1038/nprot.2006.446. [DOI] [PubMed] [Google Scholar]
- 19.Schindelin J, Arganda-Carreras I, Frise E, Kaynig V, Longair M, Pietzsch T, et al. Fiji: an open-source platform for biological-image analysis. Nat Methods. 2012;9(7):676–682. doi: 10.1038/nmeth.2019. [DOI] [PMC free article] [PubMed] [Google Scholar]
- 20.Stratowa C. xps: Processing and analysis of Affymetrix oligonucleotide arrays including exon arrays, whole genome arrays and plate arrays. 2012 [Google Scholar]
- 21.Storey JD, Tibshirani R. Statistical significance for genomewide studies. Proc Natl Acad Sci USA. 2003;100(16):9440–9445. doi: 10.1073/pnas.1530509100. [DOI] [PMC free article] [PubMed] [Google Scholar]
- 22.Newton MA, Quintana FA, den Boon JA, Sengupta S, Ahlquist P. Random-set methods identify distinct aspects of the enrichment signal in gene-set analysis. Annals of Applied Statistics. 2007;1(1):85–106. [Google Scholar]
- 23.Jones S, Chen WD, Parmigiani G, Diehl F, Beerenwinkel N, Antal T, et al. Comparative lesion sequencing provides insights into tumor evolution. Proc Natl Acad Sci USA. 2008;105(11):4283–4288. doi: 10.1073/pnas.0712345105. [DOI] [PMC free article] [PubMed] [Google Scholar]
- 24.Cardiff RD, Borowsky AD. Precancer: sequentially acquired or predetermined? Toxicol Pathol. 2010;38(1):171–179. doi: 10.1177/0192623309356447. [DOI] [PubMed] [Google Scholar]
- 25.Artis D, Wang ML, Keilbaugh SA, He W, Brenes M, Swain GP, et al. RELMbeta/FIZZ2 is a goblet cell-specific immune-effector molecule in the gastrointestinal tract. Proc Natl Acad Sci USA. 2004;101(37):13596–13600. doi: 10.1073/pnas.0404034101. [DOI] [PMC free article] [PubMed] [Google Scholar]
- 26.Hollingsworth MA, Swanson BJ. Mucins in cancer: protection and control of the cell surface. Nat Rev Cancer. 2004;4(1):45–60. doi: 10.1038/nrc1251. [DOI] [PubMed] [Google Scholar]
- 27.John R, El-Rouby NM, Tomasetto C, Rio M-C, Karam SM. Expression of TFF3 during multistep colon carcinogenesis. Histol Histopathol. 2007;22(7):743–751. doi: 10.14670/HH-22.743. [DOI] [PubMed] [Google Scholar]
- 28.Steppan CM, Brown EJ, Wright CM, Bhat S, Banerjee RR, Dai CY, et al. A family-specific resistin-like molecules. Proc Natl Acad Sci USA. 2001;98(2):502–506. doi: 10.1073/pnas.98.2.502. [DOI] [PMC free article] [PubMed] [Google Scholar]
- 29.Leclerc D, Deng L, Trasler J, Rozen R. ApcMin/+ mouse model of colon cancer: gene expression profiling in tumors. J Cell Biochem. 2004;93(6):1242–54. doi: 10.1002/jcb.20236. [DOI] [PubMed] [Google Scholar]
- 30.Zheng LD, Tong QS, Weng MX, He J, Lv Q, Pu JR, et al. Enhanced expression of resistin-like molecule beta in human colon cancer and its clinical significance. Dig Dis Sci. 2009;54(2):274–281. doi: 10.1007/s10620-008-0355-2. [DOI] [PubMed] [Google Scholar]
- 31.Velcich A, Yang WC, Heyer J, Fragale A, Nicholas C, Viani S, et al. Colorectal cancer in mice genetically deficient in the mucin Muc 2. Science. 2002;295(5560):1726–1729. doi: 10.1126/science.1069094. [DOI] [PubMed] [Google Scholar]
- 32.Yang K, Popova NV, Yang WC, Lozonschi I, Tadesse S, Kent S, et al. Interaction of Muc2 and Apc on Wnt signaling and in intestinal tumorigenesis: potential role of chronic inflammation. Cancer Res. 2008;68(18):7313–7322. doi: 10.1158/0008-5472.CAN-08-0598. [DOI] [PMC free article] [PubMed] [Google Scholar]
- 33.Casado E, Garcia VM, Sánchez JJ, del Pulgar MTG, Feliu J, Maurel J, et al. Upregulation of trefoil factor 3 (TFF3) after rectal cancer chemoradiotherapy is an adverse prognostic factor and potential therapeutic target. Int J Radiat Oncol Biol Phys. 2012;84(5):1151–1158. doi: 10.1016/j.ijrobp.2012.01.083. [DOI] [PubMed] [Google Scholar]
- 34.Gaspar C, Cardoso J, Franken P, Molenaar L, Morreau H, Möslein G, et al. Cross-species comparison of human and mouse intestinal polyps reveals conserved mechanisms in adenomatous polyposis coli (APC)-driven tumorigenesis. Am J Pathol. 2008;172(5):1363–1380. doi: 10.2353/ajpath.2008.070851. [DOI] [PMC free article] [PubMed] [Google Scholar]
- 35.Williams NS, Gaynor RB, Scoggin S, Verma U, Gokaslan T, Simmang C, et al. Identification and validation of genes involved in the pathogenesis of colorectal cancer using cDNA microarrays and RNA interference. Clin Cancer Res. 2003;9(3):931–946. [PubMed] [Google Scholar]
- 36.Kriegl L, Jung A, Horst D, Rizzani A, Jackstadt R, Hermeking H, et al. Microsatellite instability, KRAS mutations and cellular distribution of TRAIL-receptors in early stage colorectal cancer. PLoS One. 2012;7(12):e51654. doi: 10.1371/journal.pone.0051654. [DOI] [PMC free article] [PubMed] [Google Scholar]
- 37.Rodvold JJ, Mahadevan NR, Zanetti M. Lipocalin 2 in cancer: when good immunity goes bad. Cancer Lett. 2012;316(2):132–138. doi: 10.1016/j.canlet.2011.11.002. [DOI] [PubMed] [Google Scholar]
- 38.Reichling T, Goss KH, Carson DJ, Ley-Ebert C, Witte D, Aronow BJ, et al. Transcriptional profiles of intestinal tumors in ApcMin/+ mice are unique from those of embryonic intestine and identify novel gene targets dysregulated in human colorectal tumors. Cancer Res. 2005;65(1):166–176. [PubMed] [Google Scholar]
- 39.Lin HM, Chatterjee A, Lin YH, Anjomshoaa A, Fukuzawa R, McCall JL, et al. Genome wide expression profiling identifies genes associated with colorectal liver metastasis. Oncol Rep. 2007;17(6):1541–1549. doi: 10.3892/or.17.6.1541. [DOI] [PubMed] [Google Scholar]
- 40.Reilly PT, Teo WL, Low AA, Amoyo-Brion AA, Dominguez-Brauer C, Elia AJ, et al. Lipocalin 2 performs contrasting, location-dependent roles in APCmin tumor initiation and progression. Oncogene. 2013;32(10):1233–1239. doi: 10.1038/onc.2012.159. [DOI] [PMC free article] [PubMed] [Google Scholar]
- 41.Taketo MM, Edelmann W. Mouse models of colon cancer. Gastroenterology. 2009;136(3):780–798. doi: 10.1053/j.gastro.2008.12.049. [DOI] [PubMed] [Google Scholar]
- 42.Terzic J, Grivennikov S, Karin E, Karin M. Inflammation and colon cancer. Gastroenterology. 2010;138(6):2101e5–2114e5. doi: 10.1053/j.gastro.2010.01.058. [DOI] [PubMed] [Google Scholar]
Associated Data
This section collects any data citations, data availability statements, or supplementary materials included in this article.