Abstract
The identification of specific microRNAs (miRNAs) that target a given messenger RNA (mRNA) is essential for studies in gene regulation, but the available bioinformatic software programs are often unreliable. We have developed a unique experimental miRNA affinity assay whereby a 3′UTR RNA is end-labeled with biotin, immobilized, and then used as a bait sequence for affinity pull-down of miRNAs. After washes and release, cloning and sequencing identify the miRNAs. Binding affinity is quantitated by quantitatvie polymerase chain reaction (qPCR), comparing released and original input concentrations. As an initial demonstration, the TCF8/ZEB1 mRNA affinity pull-down yielded miR-200 family member miRs in the majority of clones, and binding affinity was approximately 100%; virtually all copies of miR-200c bound the immobilized mRNA transcript. For validation in cells, miR-200c strongly inhibited expression of a TCF8 luciferase reporter, native TCF8 mRNA, and protein levels, which contrasted with other recovered miRNAs with lower binding affinities. For Smad4 mRNA, miR-150 (and others) displayed a binding affinity of 39% (or less) yet did not inhibit a Smad4 reporter, native Smad4 mRNA, or protein levels. These results were not predicted by available software. This work demonstrates this miRNA binding affinity assay to be a novel yet facile experimental means of identification of miRNAs targeting a given mRNA.
Keywords: miRNA, mRNA, miRNA:mRNA binding, Gene targeting, Gene modulation
MicroRNAs (miRNAs)1 are small noncoding RNAs functioning in gene regulation [1]. In animal cells, miRNAs bind to target sites in the 3′UTR of messenger RNAs (mRNAs), causing posttranscriptional repression or degradation of mRNAs or blocking translation [2,3]. Therefore, the identification of specific miRNAs targeting a specific mRNA transcript is essential for studies in gene regulation and spinoff diagnostic and therapeutic approaches.
There are two general approaches to investigate miRNA:mRNA interaction. The first general approach uses bioinformatic target prediction tools, such as MicroCosm, PicTar, and TargetScan, to predict miRNA:mRNA interaction [4-6]. However, their predictions are notoriously inconsistent [7-9], overcalling some miRNA:mRNA interactions and undercalling others. The second general approach uses experimental methods. In general, there are several kinds of experimental methods to detect miRNA:mRNA interactions. One is to detect the interaction between a known candidate miRNA and a known candidate mRNA by miRNA overexpression or knockdown and correlating that with mRNA luciferase reporter assay, quantitative reverse transcription polymerase chain reaction (qRT–PCR), and Western immunoblot [10]. Another is to comprehensively detect the interactions of all retrievable mRNA-coupled miRNAs using RISC or Ago complex immunoprecipitation, such as HITS–CLIP [11] and PAP–CLIP [12], and then probe for those specific interactions of interest. A third approach is to comprehensively screen the mRNA targets of a known miRNA, such as TAP-tar [13], isolating mRNA targets using biotinylated synthetic miRNAs [14]. A final approach is to comprehensively screen for miRNAs that target a known mRNA.
Recently, two specific methods falling under the last category, using mRNA as bait, have been developed. One method uses MS2 binding protein to capture miRNA:mRNA complexes involving fusion of mRNA 3′UTR of interest with an MS2 tag and expression of MS2-tagged 3′UTR in cells [15]. Another method uses a biotinylated antisense oligonucleotide capture affinity technique to isolate and identify specific miRNAs targeting an mRNA [16]. Because both of the methods capture miRNA–RISC (RNA-induced silencing complex)–mRNA complexes from cell lysates, neither method can capture miRNAs unassembled into miRNA–RISC–mRNA complexes or, of course, miRNAs unexpressed in that cell. Furthermore, the method using MS2 protein [15] still needs viable cells and, therefore, is not amenable to human tissue analyses.
Prior to the publication of those latter two reports, we embarked on an effort to generate a simple mRNA-based screening approach to identify targeting miRNAs, outside of the cell-based transfection context, and to also make it applicable to miRNAs derived from all sources, including archived tissues and clinical specimens, resulting in the miRNA affinity assay reported here. This report is of an miRNA affinity assay for identification of miRNAs targeting a given mRNA.
The approach of this miRNA affinity assay is that the 3′UTR of an mRNA transcript is used as bait to fish out the specific miRNAs that target this mRNA transcript. Briefly, a 3′UTR RNA is coupled using a biotin end label, immobilized on a solid phase, and then used as a bait sequence for an unknown pool of miRNAs. After stringent washes and then thermal release, cloning and sequencing are used to identify released miRNAs. Those miRNAs with high cloning rates and binding rates are candidates for targeting the given messenger RNA in cellular systems. Luciferase reporter assay, qRT–PCR, and Western blotting are used to validate the interaction of the miRNA candidates and the given mRNA in cellular systems. The work described below has demonstrated this miRNA affinity assay to be a novel yet facile experimental means of identification of miRNAs targeting a given mRNA.
Materials and methods
miRNA affinity pull-down protocol
The principle of the miRNA affinity pull-down protocol is depicted in Fig. 1. First, the 3′UTR is produced by T7-tagged reverse transcription of mRNA and in vitro transcription and biotin labeling, best at the 3′ end. Then, biotin-labeled 3′UTR RNA is immobilized on the streptavidin beads and hybridized with the miRNA pool. Finally, the nonspecifically bound miRNAs are washed away from the beads and the specifically bound miRNAs are released and analyzed. The resulting released miRNAs are cloned and sequenced for identification, and then miRNA real-time PCR is used on input and released miRNA to ascertain quantitative miRNA binding rates.
Fig.1.
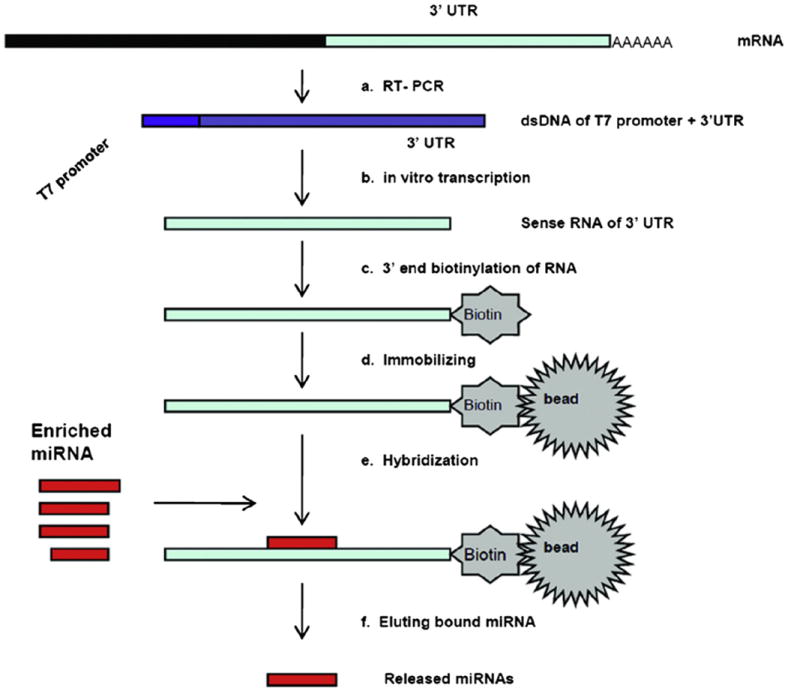
Overview of miRNA affinity pull-down assay. (a) produce T7-tagged ds 3′UTR by conventional mRNA reverse transcription; (b) synthesize sense RNA of 3′UTR by in vitro transcription; (c) label biotin at the 3′end of 3′UTR RNA; (d) immobilize the 3′ end biotin 3′UTR RNA to streptavidin beads; (e) add the enriched miRNAs to the beads solution, and hybridize with the 3′UTR RNA on the beads; (f) remove the non-specifically bound miRNAs and elute the specifically bound miRNAs on beads.
Total RNA and small RNA isolation
Total RNA was extracted using Trizol (Life Technologies, cat. no. 15596-018) from NHBE (normal human bronchial epithelial) cells and mouse liver tissue according to the manufacturer’s instructions. Small RNA fractions were isolated from total RNA using the miRVana miRNA Isolation Kit (Life Technologies, cat. no. AM1560) according to the manufacturer’s instructions.
TCF8 and Smad4 3′UTR production
Complementary DNA (cDNA) was prepared by the method of Hurteau and Spivack [17]. Briefly, a universal reverse transcription primer was employed to generate a universal sequence-tagged cDNA. Then, PCR was employed. The forward primer contained T7 promoter sequence in order to later generate RNA by in vitro transcription. TCF8 3′UTR was amplified using AccuPrime Taq DNA Polymerase High Fidelity (Life Technologies, cat. no. 12346086) from the cDNA templates of NHBE cells. The forward primer of TCF8 3′UTR is 5′ TAATACGACTCACTATAGGGAGACAAATG AAGCCTAATCGT 3′ (where the boxed area represents T7 promoter), and the reverse primer of TCF8 3′UTR is 5′ CATTTTATTGTGAGATGGGAGTC 3′. Smad4 3′UTR was amplified using GoTaq DNA Polymerase (Promega, cat. no. PRM8298) from the cDNA templates of mouse liver tissue. The forward primer of Smad4 3′UTR is 5′ TAATACGACTCACTATAGGGAGA GCCCTAACCATTTCCAGGAT 3′, and the reverse primer of Smad4 3′UTR is 5′ TACTGCCACCTTGCAGAACA 3′. All primer pairs were checked for RNA specificity using a “no reverse transcription” control.
3′ End biotin labeling of Gene_3′UTR_RNA
The transcript was first synthesized and then was labeled with biotin at the 3′ end. Because there was a T7 promoter sequence in the 5′ end of the PCR products of 3′UTR, 3′UTR_RNA could be produced from the PCR products of 3′UTR by T7 RNA Polymerase (Life Technologies, cat. no. AM2716) according to the manufacturer’s instructions. The resulting RNA was labeled by biotin at the 3′ end using an RNA 3′ End Biotinylation Kit (Thermo Scientific, cat. no. 20160) according to the manufacturer’s instructions. The RNA 3′ End Biotinylation Kit uses T4 RNA ligase to attach a single biotinylated nucleotide to the 3′ end of an RNA strand.
The details of the pull-down protocol are as follows (Fig. 1). To immobilize 3′UTR_RNA on the beads, the beads are prepared. First, after pipetting 50 μl of magnetic beads (Dynabeads MyOne Streptavidin T1) to a new 1.5-ml Eppendorf tube, wash the beads five times with 100 μl of 1× Binding & Washing buffer and resuspend the beads in 100 μl of 2× Binding & Washing buffer (2× Binding & Washing buffer: 2 M NaCl, 10 mM Tris [pH 7.5], and 1 mM ethylenediaminetetraacetic acid [EDTA]). To bind the Gene_3′UTR_RNA to the beads, pipette 4 μg of 3′ end biotinylated Gene_3′UTR_RNA to a new 1.5-ml Eppendorf tube and adjust the volume to 100 μl with RNase-free water. Denature the biotinylated Gene_3′UTR_RNA at 65 °C for 5 min and cool it immediately on ice. Add 100 μl of the denatured RNA solution to 100 μl of the prepared beads (total volume is 200 μl). Incubate the beads for 30 min at room temperature using gentle rotation (in mixer). Place the tube on a magnet and transfer the supernatant to a new 1.5-ml tube. To remove the DNA templates on the 3′UTR_RNA, wash the beads three times with 100 μl of 7 M urea. (Note: incubate the sample at 50 °C for 2 min before removing the supernatant.) Wash the beads four times with 100 μl of 1× Binding & Washing buffer, and resuspend the beads in 100 μl of 1× Binding & Washing buffer. Pipette 1 μg of small RNA (from cell/tissue) to a PCR tube. To the above PCR tube, add H2O to the final volume of 67 μl, and then add 33 μl of 3×miRNA hybridization buffer (Ambion, cat. no. AM8860G) (preheat 3× miRNA hybridization buffer to 65 °C before adding). Incubate the above solution at 95 °C for 2 min and then let the mixture cool to room temperature. Place the tube with the beads on a magnet for 1 to 2 min and remove the supernatant. Add the denatured miRNA to the beads and resuspend the beads (total volume is 100 μl). Hybridize at 35 °C for 30 min (suspend the beads by pipetting every 5 min). Place the tube with beads on a magnet and transfer the supernatant to a new 1.5-ml Eppendorf tube. (Note: keep the supernatant on ice and name it as unbound miRNA.) Wash the beads three times at room temperature with 100 μl of 1× SSC/0.1% SDS (low-stringency wash, 1× SSC: 0.15 M sodium chloride and 15 mM trisodium citrate). Wash the beads three times at room temperature with 100 μl of 0.5× SSC (high-stringency wash). Wash the beads three times at 42 °C with 100 μl of 0.5× SSC (higher stringency wash). (Note: keep the beads at 42 °C for 2 min before removing the supernatants.) Add 100 μl of H2O to the beads and resuspend the beads. Incubate the tube with the beads at 65 °C for 2 min and place the tube on a magnet immediately. Transfer the supernatant to a new tube. (Note: keep the supernatant on ice and name it as released miRNA.) Precipitate unbound miRNA with ethanol and dissolve the RNA pellet in 100 μl of H2O.
Calculation of miRNA binding rate in pull-down
miRNA binding rate in pull-down was calculated by comparing the real-time RT–PCR assayed abundance of the released miRNA with that of the original input miRNA (i.e., ΔCt [cycle threshold]) as a percentage. Real-time PCR was performed by Power SYBR Green (Life Technologies, cat. no. 4367659) according to Hurteau and coworkers’ protocol [18]. Because any given typical internal reference “housekeeping” short RNA or miRNAs (U6, miR-92, etc.) will likely not bind to the specific 3′UTR RNA on the beads, we do not use conventional housekeeping transcripts for internal references. Instead, we keep the final volumes of the original input miRNA and the released miRNA identical, and the miRNA binding rate is calculated based on ΔCt (Ctinput miRNA − Ctreleased miRNA). For example, if we add 100 μl of the original input miRNA pool (unknown) solution in the pull-down assay, we dilute the released miRNA to the final volume of 100 μl, thereby using the same volumetric baseline to calculate the binding rate/affinity from the realtime RT–PCR.
Cloning and sequencing of released miRNAs from pull-down
The cloning and sequencing of miRNAs were performed using an miRNA Cloning Kit (Integrated DNA Technologies) according to the manufacturer’s instructions. Briefly, the 3′ linker was ligated to the 3′ end of miRNAs. Then the 5′ linker was ligated to the 5′ end of miRNAs. Reverse transcription was employed, and then PCR was used to produce a small RNA library. In our experiments, we directly cloned PCR products into plasmids and sequenced them by the Sanger dideoxy sequencing technique.
Precursor miRNAs and antisense inhibitor miRNA synthesis
miRNA precursors of TCF8-directed hsa-miR-22, hsa-miR-200c, hsa-miR-320a, hsa-miR-423-3p, Smad4-directed mmu-miR-150, mmu-miR-423-5p, and mmu-miR-486 were obtained commercially from Life Technology, and miRNA antisense inhibitors of hsa-miR-22, hsa-miR-200c, mmu-miR-150, and mmu-miR-423-5p were ordered from Exiqon. miRNA precursor negative control was obtained (Life Technologies) and miRNA inhibitor negative control was obtained (Exiqon).
miRNA luciferase reporter assay
The fragment of the 3′UTR of TCF8 was amplified from the cDNA of NHBE cell total RNA with the primer pair (TCF8_F_XhoI: 5′ GTACCTCGAGAGACAAATGAAGCCTAATCGT 3′ and TCF8_R_NotI: 5′ CAGTAC GCGGCCGCCATTTTATTGTGAGATGGGAGTC 3′). After XhoI (New England Biolabs, cat. no. R0146S) and NotI (New England Biolabs, cat. no. R0189S) digestion, the fragment of TCF8 3′UTR was cloned into psiCHECK-2 vector (Promega, cat. no. C8021) provided by the Hayley McDaid laboratory. The fragment of the 3′UTR of Smad4 was amplified from the cDNA of mouse liver tissue total RNA with the primer pair (Smad4_F_XhoI: 5′ GTAC CTCGAGGCCCTAACCATTTCCAGGAT 3′ and Smad4_R_NotI: 5′ CAGTACGCGGCCGCTACTGCCACCTTGCAGAACA 3′). After Xhol and NotI digestion, the fragment of Smad4 3′UTR was cloned into psiCHECK- 2 vector. The psiCHECK-2 vector of TCF8 3′UTR and its candidate miRNA mimic with or without inhibitor were simultaneously transfected into A549 cells. The psiCHECK-2 vector of Smad4 3′UTR and its candidate miRNA mimic with or without inhibitor were simultaneously transfected into CRL-1995 cells. The experiments were performed in 24-well plates, and the cells were transfected when the cells were approximately 50% confluent. There was 200 ng of vector in each well. The final concentration of miRNA mimic was 30 nM, and the final concentration of miRNA inhibitor was 100 nM. At 24 h, the media were changed with the fresh medium. At 48 h, the cells were collected for measuring the luciferase activity (Renilla/firefly ratio) on a TD-20/20n luminometer (Promega). Experiments were performed in triplicate.
miRNA transfection and knockdown of candidate target gene expression
For TCF8 mRNA and protein expression in A549 cells, the candidate miRNAs chosen for testing were those with the highest recovery rate and binding affinity: hsa-miR-22, hsa-miR-200c, hsa-miR-320a, and hsa-miR-423-3p. Each miRNA precursor with or without its antisense inhibitor was transfected into A549 cells. The experiments were performed in 24-well plates, and the cells were transfected when the cells were approximately 50% confluent. The final concentration of miRNA mimic was 30 nM, and the final concentration of miRNA inhibitor was 100 nM. Medium was changed 24 h later. Then, 48 h later, the cells were collected for total RNA purification and total protein purification. RNA-specific real-time RT–PCR was performed to check the TCF8 mRNA level among the differently transfected samples. For real-time PCR of TCF8, the forward primer is CCAGACTCCCATCTCACAATA and the reverse primer is aacgagacgacgacagacttt. The real-time PCR of TCF8 was performed using a published protocol [17]. Western blotting was performed to check the TCF8 protein level among the differently transfected samples. TCF8 antibody was obtained commercially (Novus Biologicals, cat. no. BP1-05987). For CRL-1995 cells, mmu-miR-150, mmu-miR-486, and mmu-miR-423-5p were candidate miRNAs. The identical procedure was performed for Smad4 expression in CRL-1995 cells and its candidate miRNAs for Smad4 mRNA levels and Smad4 protein levels among the differently transfected samples. For real-time PCR of Smad4, the forward primer is TGCCATCCTTGATCACTTGGCGG and the reverse primer is aacgagacgacgacagacttt. The real-time PCR of Smad4 was performed similarly to TCF8 [17]. Smad4 antibody was obtained commercially (Novus Biologicals, cat. no. NBP1-44389). For both TCF8 and Smad4 real-time RT–PCR, GAPDH was the housekeeping gene transcript. For TCF8 and Smad4 Western immunoblotting, GAPDH was the housekeeping gene and GAPDH antibody was obtained commercially (Imgenex, cat. no. IMG-5143A).
Results
Bioinformatic prediction of miRNAs to target TCF8 and Smad4
In Table 1, three bioinformatic software programs (MicroCosm, PicTar, and TargetScan) were chosen, representative of many more not displayed, to predict miRNA targets of the gene TCF8 mRNA transcript. Some common miRNAs (miR-200 family) were found among the different programs, but most of the “hits” were inconsistent across programs. In Table 2, three bioinformatic software programs were used to predict miRNA targets of Smad4. However, no common hits were found among the three programs.
Table 1.
Bioinformatic prediction of miRNAs to target TCF8 by three bioinformatic software programs.
| MicroCosm | PicTar | TargetScan |
|---|---|---|
| hsa-miR-200b | hsa-miR-200c | hsa-miR-200b |
| hsa-miR-200b | hsa-miR-150 | hsa-miR-200b |
| hsa-miR-200c | hsa-miR-142-3p | hsa-miR-200c |
| hsa-miR-200c | hsa-miR-199a* | hsa-miR-200c |
| hsa-miR-429 | hsa-miR-342 | hsa-miR-429 |
| hsa-miR-429 | hsa-miR-369 | hsa-miR-429 |
| hsa-miR-429 | hsa-miR-150 | |
| hsa-miR-217 | hsa-miR-23ab | |
| hsa-miR-374a* | hsa-miR-130 | |
| hsa-miR-586 | hsa-miR-301 | |
| hsa-miR-600 | hsa-miR-142-3p | |
| hsa-let-7f-2* | ||
| hsa-miR-125b-1* | ||
| hsa-miR-144 | ||
| hsa-miR-148b* | ||
| hsa-miR-199b-5p |
Table 2.
Bioinformatic prediction of miRNAs to target Smad4 by three bioinformatic software programs.
| MicroCosm | PicTar | TargetScan |
|---|---|---|
| mmu-miR-693-5p | mmu-miR-146b | |
| mmu-miR-382 | mmu-miR-146a | |
| mmu-miR-291a-3p | ||
| mmu-miR-883a-5p | ||
| mmu-miR-363 | ||
| mmu-miR-883a-3p | ||
| mmu-miR-339-3p | ||
| mmu-let-7b* | ||
| mmu-miR-883b-3p | ||
| mmu-let-7d* |
Quantitating the miRNA binding affinity
The miRNA binding rate was used to evaluate its prediction of how strong an miRNA binds to a given gene 3′UTR, manifest ultimately as biological modulation activity. Fig. 2A shows that the real-time qRT–PCR Ct value of the miR-200c released after TCF8 hybridization is very close to that of the original input miR-200c, implying that the binding affinity of miR-200c to TCF8 3′UTR is very high, here approximately 100%. In another TCF8 example, Fig. 2B shows that the Ct value of a released miRNA that is not predicted to bind the bait TCF8 sequence (e.g., miR-100) is much higher than that of the original input miR-100, implying that the binding affinity of miR-100 is very low, here less than 1%. These particular data are from the pull-down of synthetic miRNAs and TCF8 3′UTR (shown in the supplementary material) but are quite representative of typical high- and low-binding affinity miRNAs.
Fig.2.
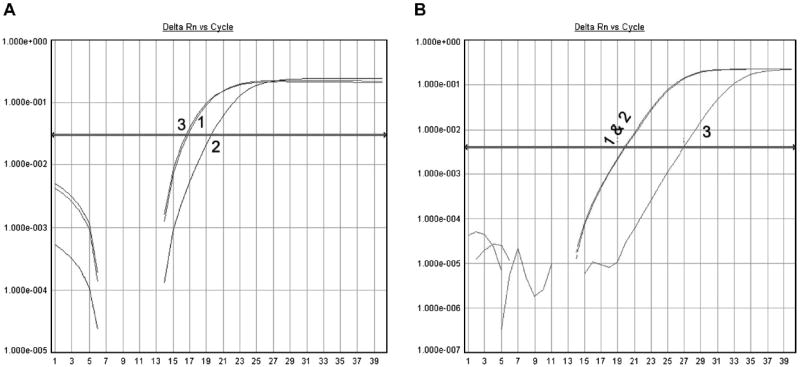
Measurement of binding affinity of miRNAs on TCF8 3′UTR via miRNA real-time PCR. In the two panels, 1 represents the cDNA from the original input miRNA, 2 represents the cDNA from the unbound miRNA, and 3 represents the cDNA from the released miRNA. The binding affinity is measured by comparing the Ct value of the released miRNA with that of the original input miRNA. (A) The Ct value of the released miR-200c is close to that of the original input miR-200c. It implies that the binding affinity of miR-200c on TCF8 3′UTR is nearly 100%. (B) The Ct value of the released miR-100 is 7 cycles greater than that of the original input miR-100. It implies the binding affinity of miR-100 on TCF8 3′UTR is low (<1%).
Pull-down results of entire cellular miRNA pool by 3′ end biotinlabeled RNA of TCF8 3′UTR
RNA of TCF8 3′UTR was labeled with biotin only at the 3′ end and hybridized with the entire NHBE cellular miRNA pool. The pull-down here was performed in replicate. As shown in Fig. 3A, among 27 colonies from the first independent TCF8 pull-down, there were 18 (66.7% of total) colonies of miR-200c, 3 (11.1%) colonies of miR-200b, 2 colonies of miR-423-3p, and 1 colony each of miR-320a and miR-22, along with 2 colonies of unknown sequences. As shown in Fig. 3B, among 41 colonies from the second independent TCF8 (replicate) pull-down, there were 28 (68.3% of total) colonies of miR-200c, 2 (4.9%) colonies of miR-200b, 2 colonies of miR-423-3p, 2 colonies of miR-22, 2 colonies of miR-221, and 1 colony of Let-7e, along with 4 colonies of different unknown sequences. As shown in Fig. 3C, miR-200c showed a complete binding rate of 204.0%, a supranormal value that is discussed in the Discussion section. The binding rates of the other miRNAs were 13.0% (miR-22), 8.7% (miR-423-3p), 6.4% (miR-320a), 0.2% (miR-20a), 0.3% (miR-221), and 0.03% (miR-205). By comparing the binding rate and cloning results, it could be concluded that the results from the two independent end-labeled pull-down experiments (Fig. 3A and B) were very close, but single clones varied to some extent (e.g., Let-7e).
Fig.3.
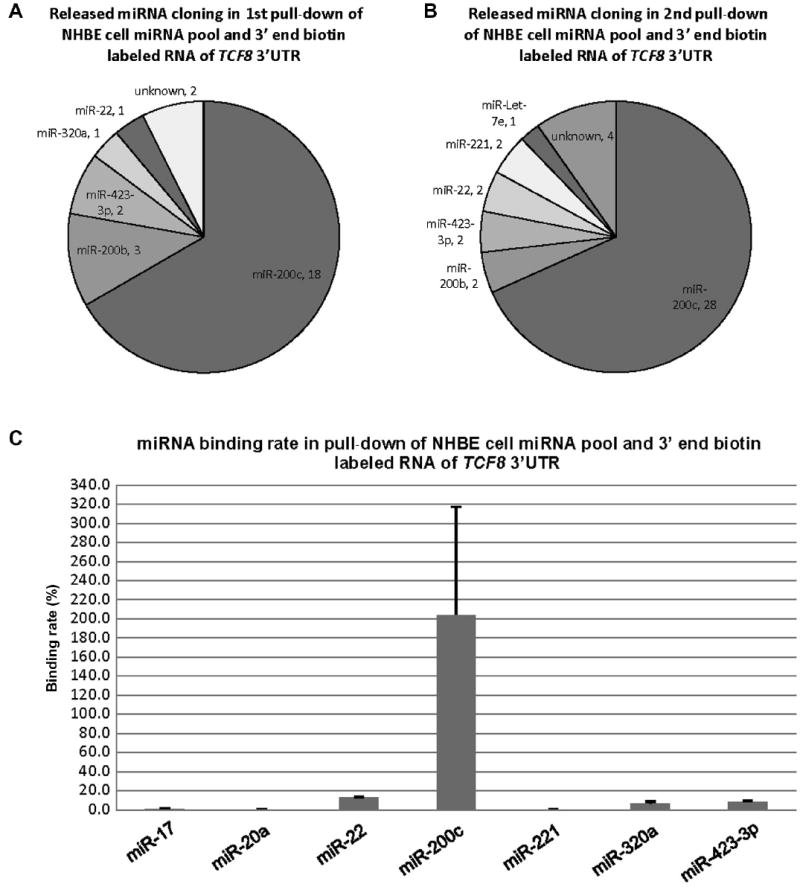
Cloning results and binding rates of the released miRNAs from the pull-down of NHBE cellular miRNAs and 3′ end biotin-labeled RNA of TCF8 3′UTR. (A) miRNA species and quantity of the released miRNAs from the first replicate pull-down. The results are from 27 random colonies. Each sector is labeled with miRNA name and quantity. miRNA quantity is presented by the sector area. Unknown means the sequences from the cloning could not be matched to the known miRNAs (Sanger miRNA database). (B) miRNA species and quantity of the released miRNAs from the second replicate pull-down. The results are from 41 random colonies. (C) Binding rates of 7 released miRNAs. miR-20a was used as a negative control based on the previous pull-down of the pool of synthetic miRNAs by full-length biotin-labeled RNA of TCF8 3′UTR. The binding rate of miR-20a was 0.2% in this end-labeled pull-down. miR-17 was cloned from the pull-down of the entire cellular miRNA pool and full-length biotin-labeled RNA of TCF8 3′UTR, and its binding rate was 1.0%, in this end-labeled pull-down. miR-200c showed complete binding/recovery. The possible reasons for binding affinity of more than 100% are outlined in the Discussion section. The binding rate data are from both biological duplicates and technical duplicates in each condition. Error bars represent standard deviations.
miR-200c, miR-22, miR-320a, and miR-423-3p were then chosen to be validated for biological activity by luciferase reporter assays, native TCF8 mRNA, and protein levels, as displayed in a later section.
Pull-down results of entire cell miRNA pool by 3′ end biotin-labeled RNA of Smad4 3′UTR
In this set of pull-down experiments, RNA of Smad4 3′UTR was labeled with biotin at the 3′ end only and hybridized with mouse liver tissue miRNA pool. This was performed in replicate. The released miRNAs were cloned and sequenced. As shown in Fig. 4A, in 22 colonies from the first independent pull-down, there were 5 (22.7%) colonies of miR-150, 3 (13.6%) colonies of miR-486, and so on. As shown in Fig. 4B, in 38 colonies from the second independent replicate pull-down, there were 8 (21.1%) colonies of miR- 150, 6 (15.7%) colonies of miR-486, and so on. As shown in Fig. 4C, the binding rates of miRNAs were 39.4% (miR-150), 19.6% (miR-423-3p), 14.1% (miR-486), 9.4% (miR-423-5p), 1.6% (miR-29a), 1.0% (miR-483*), 0.7% (miR-484), and 0.02% (miR-92a).
Fig.4.
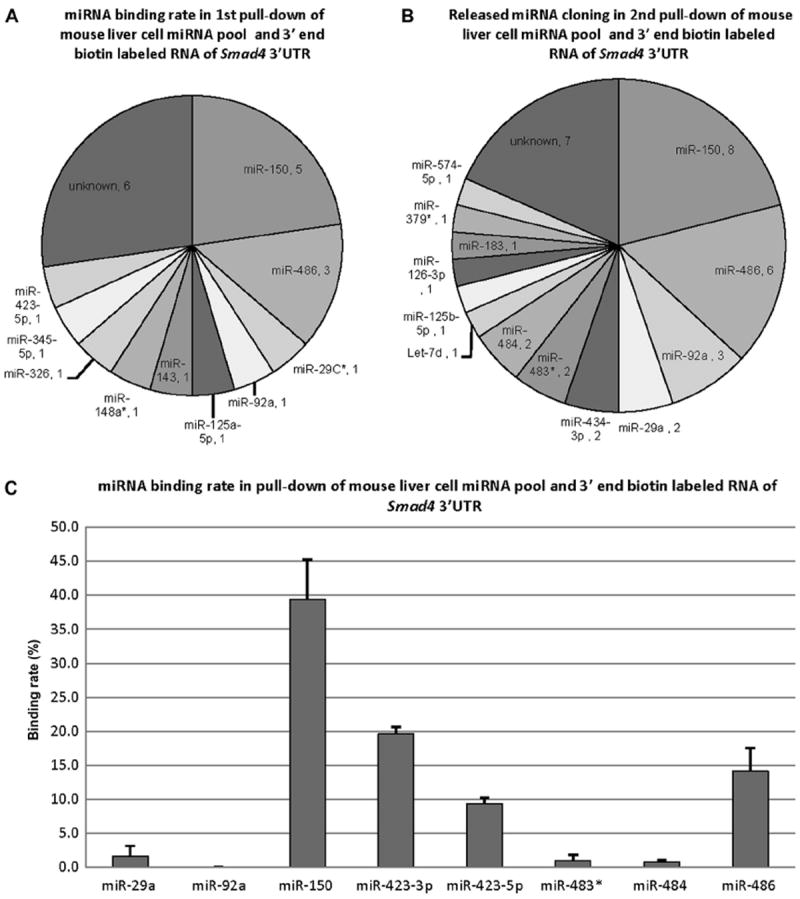
Cloning results and binding rates of the released miRNAs from the pull-down of mouse liver cell miRNA pool and 3′ end biotin-labeled RNA of Smad4 3′UTR. (A) Species and quantity of the released miRNAs from the first pull-down. The results are from 22 random colonies. (B) Species and quantity of the released miRNAs from the second pulldown. The results are from 38 random colonies. (C) Binding rates of 8 released miRNAs. miR-150 had the highest binding rate at approximately 40%. The binding rate data are from biological duplicates and technical duplicates in each. Error bars represent standard deviations.
Because miR-150, miR-423-3p, miR-486, and miR-423-5p displayed the highest binding affinity rates for Smad4, they were chosen to be validated for biological activity in cells for suppression of Smad4 activity by luciferase reporter assays, native Smad4 mRNA, and protein levels.
Luciferase reporter assay results
We transfected the respective selected precursor miRNAs and antisense inhibitor miRNAs into A549 cells (for TCF8) and CRL-1995 cells (for Smad4). As shown in Fig. 5A, in TCF8 3′UTR luciferase reporter assays, miR-200c precursor greatly inhibited TCF8 3′UTR-coupled Luc expression (decrease to 30% of control) and antisense inhibitor of miR-200c could restore TCF8 expression (increase to 79% of control). miR-22 precursor and miR-320a precursor did not show an obvious downregulation effect. In fact, miR-423-3p precursor showed an unexpected upregulation effect. As shown in Fig. 5B, in Smad4 3′UTR luciferase reporter assays, miR-150 precursor and miR-486 precursor did not show the expected downregulation effect. The antisense inhibitor of miR-150 showed a clear downregulation effect (decreased to 40% of control). The upregulation effect of miR-423-3p precursor and the downregulation effect of miR-150 inhibitor are of unclear origin, and possibilities are reviewed in the Discussion section.
Fig.5.
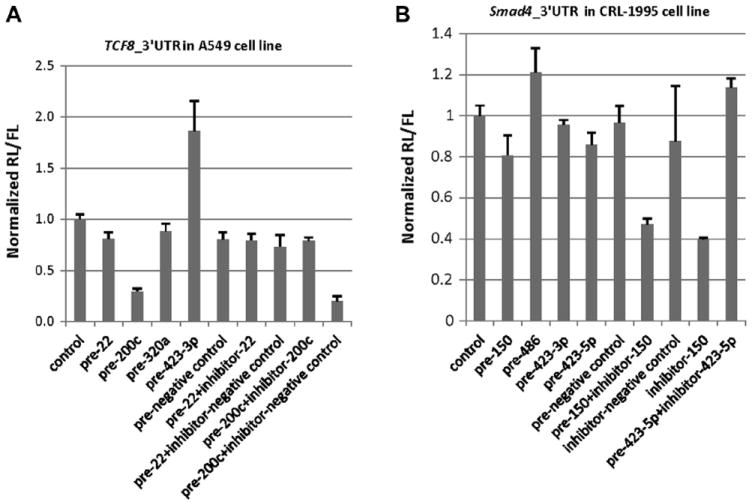
Luciferase reporter assay showing miRNA mimic/inhibitor effects on gene 3′UTR. (A) Luciferase reporter assay showing the miRNA mimic/inhibitor effects on TCF8 3′UTR in A549 cells. The miRNA mimics/inhibitors were chosen from TCF8 3′UTR pull-down. (B) Luciferase reporter assay showing the miRNA mimic/inhibitor effects on Smad4 3′UTR in CRL-1995 cells. The miRNA mimics/inhibitors were chosen from Smad4 3′UTR pull-down. “Pre-negative control” represents miRNA precursor negative control, and “inhibitor-negative control” represents miRNA antisense inhibitor negative control.
Native mRNA responses to transfected miRNA mimics/inhibitors
Native mRNA patterns generally followed the luciferase reporter pattern. Fig. 6A shows the amplification plot of TCF8 real-time qRT–PCR for the miR-transfected A549 samples, and Fig. 6B shows the PCR product size of TCF8. As shown in Fig. 6C, for native TCF8 mRNA transcript levels, transfections of miR-200c precursor did inhibit TCF8 expression (to 24% of control); miR-200c inhibitor cotransfection restored this inhibition. Conversely, precursors of miR-22, miR-320a, and miR-423-3p that had been previously released and cloned, but did not show much binding affinity or Luc reporter activity above, also did not show the inhibition of the native TCF8 mRNA level. As shown in Fig. 6D, transfected candidate precursors of miR-150, 423-3p, 423-5p, and miR-486 did not affect Smad4 expression at the mRNA level.
Fig.6.
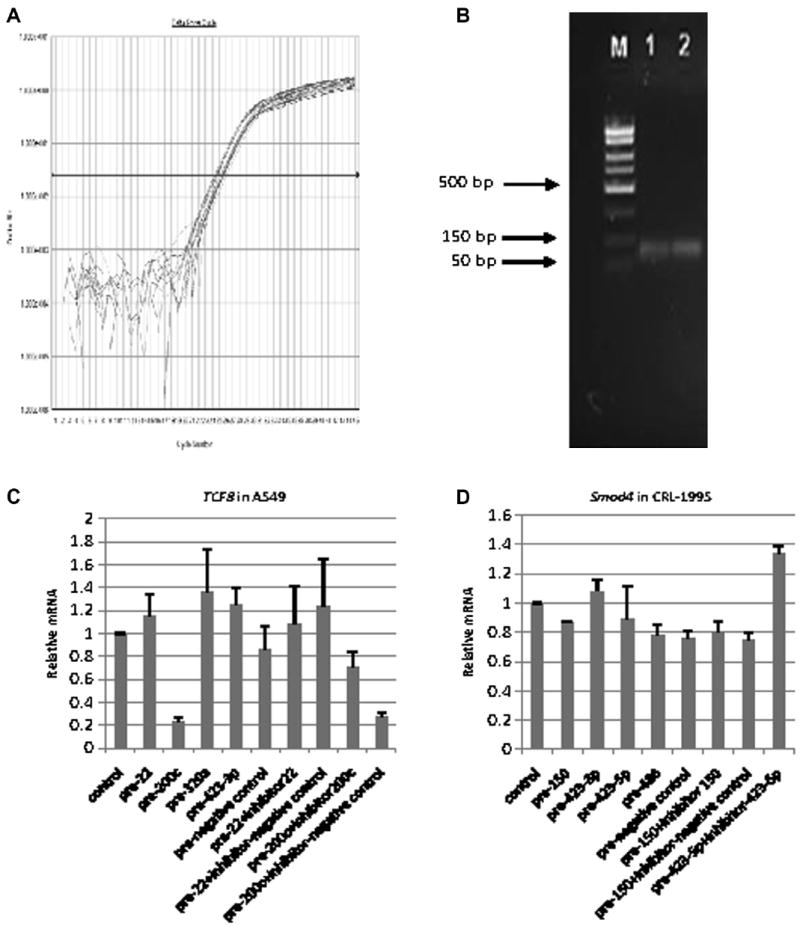
TCF8 and Smad4 real-time PCR results showing native mRNA responses to transfected miRNA mimics/inhibitors. (A) Amplification plot of TCF8 mRNA real-time RT–PCR for the transfected A549 cells. (B) PCR product size of TCF8 mRNA real-time RT–PCR. M represents DNA marker, and 1 and 2 represent two samples from the TCF8 real-time PCR products. (C) Native TCF8 mRNA responses to transfected miRNA mimics/inhibitors in A549 cells. All miRNA mimics/inhibitors were selected from TCF8 3′UTR pull-down. (D) Native Smad4 mRNA responses to transfected miRNA mimics/inhibitors in CRL-1995 cells. These miRNA mimics/inhibitors were selected from Smad4 3′UTR pull-down.
Native protein responses to transfected miRNA mimics/inhibitors
Protein levels by Western immunoblotting generally followed the luciferase reporter pattern and native mRNA levels. As shown in Fig. 7A and C, at the native protein level, transfected miR-200c precursor inhibited A549 TCF8 expression (decreased to 3% of control); antisense inhibitor of miR-200c was able to restore this inhibition. As shown in Fig. 7B and D, at the protein level, precursors of miR-150, 423-3p, 423-5p, and miR-486 did not show inhibitory effects on Smad4 immunoreactive protein levels. In Smad4, the pairs of pre-miR and antisense inhibitor had several unpredicted effects (Fig. 7B and D).
Fig.7.
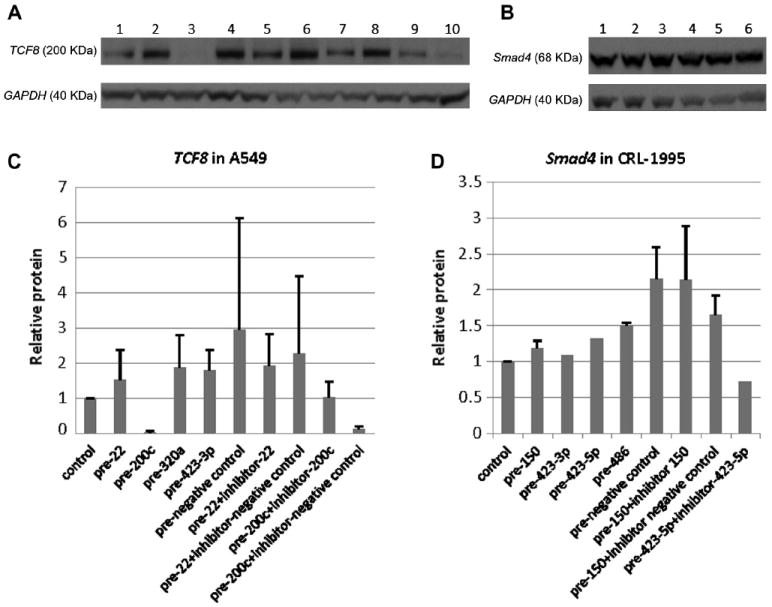
Western blotting results showing miRNA mimic/inhibitor effects on TCF8 and Smad4 on protein levels. (A,C) TCF8 Western blotting results showing TCF8 protein responses to transfected miRNA mimics/inhibitors in A549 cells. All miRNA mimics/inhibitors were selected from TCF8 3′UTR pull-down. (B,D) Smad4 Western blotting results showing Smad4 protein responses to transfected miRNA mimics/inhibitors in CRL-1995. All miRNA mimics/inhibitors were selected from Smad4 3′UTR pull-down. The sample lane order for panels A and C is the same, as is the sample lane order for panels B and D.
Thus, only those miRNAs showing very high binding affinity in this affinity assay (miR-200c, ~100%) showed significant activity on validating studies, which included transfection of the miR precursor into cells, and resulting Luc reporter activity, native mRNA level, and native protein level. Those miRs with lower binding affinity (<40%) did not show any such activity.
Association among miRNA cloning rate, binding rate, binding free energy, and biological effect
Based on the sequencing results of the released miRNAs from the 3′ end biotin-labeled TCF8 3′UTR pull-downs, miR-17, miR-20a, miR-22, miR-200c, miR-221, miR-320a, and miR-423-3p were chosen to evaluate the relationship among miR binding rate alone, miR cloning rate (believed to be a composite reflection of both miR concentration and miR binding rate), and informatically predicted binding free energy (mfe). All miR binding rate and miR cloning rate data were from the 3′ end biotin-labeled TCF8 3′UTR pulldown. Based on the sequencing results of the released miRNAs from the 3′ end biotin-labeled Smad4 3′UTR pull-down, miR-29a, miR-92a, miR-150, miR-423-3p, miR-423-5p, miR-483*, miR-484, and miR-486 were chosen to evaluate the relationship among miR binding rate, miR cloning rate, and binding free energy.
miR cloning rate, miR binding rate, binding free energy, and biological effect of each miRNA are shown in Table 3. The scatter plot of miR binding rate and calculated binding free energy was made to investigate the correlation between miR binding rate and calculated binding free energy. As shown in Fig. 8A, the Spearman rank correlation was 0.51 and the P value was 0.06. It can be concluded that the correlation between miR binding rate and calculated binding free energy is not robust. To investigate the correlation between miRNA binding rate and miR cloning rate, the scatter plot of miR binding rate and miR cloning rate was made because the data were non-normally distributed. As shown in Fig. 8B, the Spearman rank correlation was 0.43 and the P value was 0.12. It can be concluded that the correlation between miR binding rate and miR cloning rate is not robust.
Table 3.
miRNA:mRNA binding parameters and their prediction of biological effect.
| Gene 3′UTR | Function | miRNA | Observed miR cloning rate (end label, cellular pool) (%) | Observed miR binding rate (%) | Predicted binding free energy (kcal/mol) from RNAhybrid software | Observed biological effect |
|---|---|---|---|---|---|---|
| TCF8/ZEB1 | Regulate E-cadherin | miR-17 | 0.0 | 1.0 | −29.4 | 0 |
| miR-20a | 0.0 | 0.2 | −27.5 | 0 | ||
| miR-22 | 4.4 | 13.0 | −28.3 | 0 | ||
| miR-200c | 67.6 | 204.0 | −29.6 | 3 | ||
| miR-221 | 2.9 | 0.3 | −24.1 | 0 | ||
| miR-320a | 1.5 | 6.4 | −26.8 | 0 | ||
| miR-423-3p | 5.9 | 8.7 | −28.5 | 0 | ||
| Smad4 | TGF-β signaling pathway | miR-29a | 3.3 | 1.60 | −25.4 | 0 |
| miR-92a | 6.7 | 0.02 | −24.7 | 0 | ||
| miR-150 | 21.67 | 39.40 | −22.9 | 0 | ||
| miR-423-3p | 0.00 | 19.60 | −30.5 | 0 | ||
| miR-423-5p | 1.67 | 9.36 | −29.4 | 0 | ||
| miR-483* | 3.33 | 1.02 | −22.5 | 0 | ||
| miR-484 | 3.33 | 0.74 | −24.7 | 0 | ||
| miR-486 | 15.00 | 14.10 | −31.5 | 0 |
Note: For TCF8 and Smad4 3′UTRs, we list the experimentally determined miR cloning rate, experimentally determined miR binding rate, informatically predicted binding free energy, and experimentally determined biological effect index. miR cloning rate represents the fraction of the colonies bound and released from a particular miRNA. miR binding rate represents the percentage of the original input miRNA molecule versus the bound and released miRNAs. Binding free energy represents how strong the RNAhybrid software predicted binding interaction between miRNA sequence and target 3′UTR sequence. It was obtained by submitting miRNA sequence and gene 3′UTR sequence to the RNAhybrid website (http://bibiserv.techfak.uni-bielefeld.de/rnahybrid). Biological effect represents experimentally determined miRNA modulating effects on gene products at three levels: gene transcript 3′UTR integrated luciferase reporter assay, native mRNA level effect, and native protein level effect. If an miRNA has an effect at one level, the value is 1. If an miRNA has no effect at a given level, the value is 0. Because miR-200c had an effect at all three levels, the biological effect value is 3.
Fig.8.
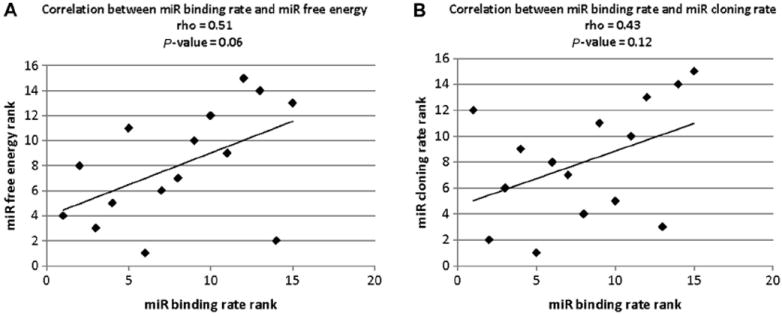
Spearman rank correlation among miR cloning rate, binding free energy, and miR binding rate. (A) Spearman rank correlation between experimentally demonstrated miRNA binding rate and software-predicted binding free energy. (B) Spearman rank correlation between experimentally demonstrated miR binding rate and miR cloning rate.
Discussion
Our miRNA affinity assay is a unique mRNA-based way to discover, identify, and evaluate multiple miRNAs that target a single mRNA transcript, whereby miRNAs bind the immobilized 3′UTR in a cell-free system. The process is an innovative assembly of some commonly used reagents and procedures. Here, we display the method’s performance and biological validation and also compare it with a conventional bioinformatic approach.
The other comparable mRNA-based miRNA pull-down assays of which we are aware are quite different in strategy, also developed to find multiple miRNAs that target a single mRNA [15,16]. In Vo and coworkers’ approach [15], endogenous cellular miRNAs bind on the transfected 3′UTR in viable transfected cells. The 3′UTR (of the Hand2 mRNA example) is fused to an MS2 tag and cloned downstream from a GFP reporter. The MS2-tagged 3′UTR is then expressed in HEK293 cells. After cell lysis, the transcript of the MS2-tagged 3′UTR is isolated by an MS2 binding protein column. Therefore, the miRNAs associated with the MS2-tagged 3′UTR are isolated at the same time. One disadvantage of this method is that it depends on the 3′UTR vector being transfected into living cells. Tissue-based nonviable samples (histology- and pathology-originating miRNA pools) cannot be tested. In addition, this assay, of course, detects only those miRNAs embodied in the transfected cell’s miRNA complement. In Hassan and coworkers’ approach [16], a biotinylated antisense oligonucleotide was used to capture complementary mRNA. Because miRNAs and mRNAs form complexes with RISC in cells, the miRNAs associated with the complementary mRNA are isolated at the same time. The disadvantage of this method is that neither miRNAs not assembled into miRNA–RISC–mRNA complexes at the moment nor miRNAs not expressed in that cell type can be captured.
Our assay is quite different in approach in several ways. Notably, our approach requires only construction of an immobilized 3′UTR RNA and an miRNA pool that may derive from any source. It entails no requirements for living cells or effective transfection of these cells. Therefore, our miRNA sources, for example, may include precious clinical and pathological samples as long as they contain intact miRNAs. This approach is perhaps, in this respect, more broadly applicable for many translational and molecular pathology situations. Synthetic miRNAs can also be used as miRNA sources. Therefore, the miRNAs unexpressed in one cell type can be tested for targeting the mRNA of interest. Different sources of miRNA pools can be mixed together as a new pool in order to increase the diversity of miRNAs. In addition, the 3′UTR RNA in our approach does not require extensive RNA engineering/fusion. Because purified miRNAs and 3′UTR RNA are used in the miRNA affinity assay, our cell-free system may plausibly be more stable than the cell-based systems.
The advantage mirrors the disadvantage of our approach, of course; that is, in a cell-free system, miRNA:mRNA 3′UTR binding in our system might not fully reflect the actual cellular conditions. Therefore, captured miRNAs need to be subsequently validated for biological activity in cells, as we have done here by transient transfections coupled to reporter assays, and for added rigor, resulting in native mRNA and native protein responses as well. Therefore, we suggest that there is a role for our assay in screening for targeting miRNAs that require subsequent verification for actual targeting in vivo.
We tested two kinds of biotin labeling methods for the 3′UTR RNA: full-length biotin labeling and 3′ end biotin labeling. In the full-length biotin labeling, biotin-16-UTP is incorporated approximately every 20th to 25th nucleotide of the transcript. We hypothesized that the 3′ end biotin labeling was more physiological than the full-length biotin labeling for our miRNA affinity assay because multiple binding sites on one RNA molecule may sterically hinder the hybridization of miRNAs and 3′UTR RNA. Our experiments appear to validate our hypothesis.
As shown in Fig. 3C, as well as in Figs. S1B and S2B of the supplementary material, all recovery rates of miR-200c were more than 100% in the three TCF8-3′UTR pull-downs. We know that the recovery rate cannot biologically be more than 100% (i.e., more than the input amount). This numerical anomaly might be attributable to one or more possible reasons: some primer nonspecificity, pipetting error, PCR imprecision, imperfect RNA specificity of RT–PCR, and so forth. With respect to primer nonspecificity, as mentioned earlier among miR-200b, miR-200c, and miR-429, any one of three miRNA primers can be used to amplify the other two miR-200 family miRNAs, and this could not be further resolved by several primer designs. Therefore, it is possible that there was an undetected different amplification mix of miRNAs or buffer stringency in the output pool as compared with the input pool, altering the output:input ratio consistently in a positive direction, although this is speculative. The real-time miRNA PCR approach uses a universal reverse primer, an RNA-specific tag on cDNA, to exclude false DNA templates, and it uses a sequence-specific forward primer, with an miR-specific 3-base barcode to exclude PCR artifact along with no reverse transcription controls, so we are confident in the miRNA (as opposed to mRNA or genomic DNA [gDNA]) origin of the PCR signal. With respect to Fig. 2A specifically (a highly controlled pull-down of a pool of synthetic miRNAs), the Ct value of the unbound miR-200c is approximately 2.5 cycles less than that of the original input miR-200c, implying that the unbound rate of miR-200c is approximately 18%. However, the sum of its unbound rate (18%) and its estimated binding rate (100%) is greater than 100%, and this is within PCR error. Regardless, miR-200c binding affinity is very high, that is, greater than 80%.
In validation studies, only miR-200c showed clear down-regulation of TCF8 reporter and gene products in the cellular system. One possible reason why this was a unique finding among this particular set of miRNAs is that there may be a threshold of binding affinity required for biological activity. We speculate that if the binding rate of an miRNA during the pull-down is less than this hypothetical threshold, this miRNA will not be effective in transcript/protein level regulation. Many previous studies, including our own, have validated that miR-200c targetsTCF8 mRNA [19-21].
Based on our data, the association between the experimentally determined binding rate and software predicted that free energy (mfe) was not always obvious. For miR-200c, the experimentally determined binding rate was approximately 100% and the calculated free energy was high at −29.6 kcal/mol; indeed, this proved to be the clearest case of biological modulation of target gene (TCF8) expression in cells. For miR-150, the observed binding rate was 39.4% and the calculated free energy was low at −22.9 kcal/mol; there was no obvious biological modulation of Smad4 levels. Therefore, we speculate that there might be a composite threshold of (i) directly observed binding rate and (ii) predicted binding free energy that, when combined, best predicts biological effect. If the composite values of the observed binding rate and predicted binding free energy are less than the relevant thresholds, the miRNA is very unlikely to target the given mRNA transcript robustly. Further studies on a broad array of miRNAs are required to explore this issue.
Our miRNA affinity assay applies to screening the miRNAs that target an mRNA transcript. Bioinformatic software programs often misclassify/overcall the miRNAs targeting an mRNA transcript, and we speculate that they may also undercall miRNAs that do target an mRNA transcript (e.g., Tables 1 and 2). So, for some mRNA transcripts, experimental approaches such as ours may be particularly useful for initial evaluation steps of target identification. Among the most commonly employed experimental approaches, transfection of the miRNA and readout from a luciferase reporter assay is used to evaluate whether there is an interaction between a known miRNA and 3′UTR of an mRNA transcript in cells. However, if one has many predicted miRNA candidates for a given mRNA transcript, it will take significant resources to individually clone each reporter and to express and transfect each of these many miRNAs. Importantly, when limiting tests to miRNAs whose identity relies on prior knowledge-based reporter approaches, many unpredicted miRNAs will invariably be missed.
The miRNA affinity pull-down assay, therefore, can be used for discovery because it can screen an unknown pool of miRNAs consisting of hundreds of miRNAs. Because the miRNA affinity assay is performed in a cell-free system, the screen positive affinity assay miRNAs need to be validated in cell systems at a minimum by luciferase reporter or equivalent assays. In this way, a limited number of miRNAs chosen from many candidate miRNAs can be effectively validated. Native mRNA and protein level modulation assays can then follow if additional certainty is required, as we demonstrate.
We speculate that the assay, although not tested, can potentially be flipped and adapted to identify multiple mRNAs that a given bait miRNA appears to target [14,22].
Currently, we use a conventional cloning and Sanger sequencing protocol to discover the miRNAs in the released miRNA pool. Dozens of colonies are randomly chosen for sequencing every time. Because the number of colonies is not large, the depth of discovery is not high. If one uses next-generation sequencing technology to sequence the entire released miRNA pool, the depth can be greatly increased and the results would likely be more robust. For multiplexing, because the complexity of the released miRNA pool is not high for any one 3′UTR pull-down, a barcode primer approach can be used to improve the efficiency of next-generation sequencing to save expenses.
In the luciferase reporter assay, miR-423-3p precursor upregulated TCF8 expression and miR-150 inhibitor downregulated Smad4 expression. Although it has been reported that most miRNAs inhibit the expression of their mRNA targets, some researchers reported that miRNAs could upregulate the expression of their mRNA targets [23,24]. Therefore, the upregulation effect of miR-423-3p precursor and the downregulation effect of miR-150 inhibitor need to be further investigated.
In summary, we offer an experimental tool for directly demonstrating miRNA:mRNA interaction worthy of further development and application.
Supplementary Material
Acknowledgments
We thank Gregory Hurteau (State University of New York at Albany) for initial discussions. We thank the Charles Rogler (Einstein) laboratory for helpful discussions and several conventional reagents of the Smad4 pull-down material. We thank Lingling Liu in the Hayley M. McDaid (Molecular Pharmacology, Einstein) laboratory for kindly providing psiCHECK-2 vector. We thank Tao Wang (Biostatistics, Einstein) for advice on statistical analyses.
Appendix A. Supplementary material
Supplementary data associated with this article can be found, in the online version, at http://dx.doi.org/10.1016/j.ab.2013.08.002.
Footnotes
Abbreviations used: miRNA, microRNA; mRNA, messenger RNA; qRT–PCR, quantitative reverse transcription polymerase chain reaction; RISC, RNA-induced silencing complex; NHBE, normal human bronchial epithelial; cDNA, complementary DNA; Ct, cycle threshold.
References
- 1.Chen K, Rajewsky N. The evolution of gene regulation by transcription factors and microRNAs. Nat Rev Genet. 2007;8:93–103. doi: 10.1038/nrg1990. [DOI] [PubMed] [Google Scholar]
- 2.Bartel DP. MicroRNAs: target recognition and regulatory functions. Cell. 2009;136:215–233. doi: 10.1016/j.cell.2009.01.002. [DOI] [PMC free article] [PubMed] [Google Scholar]
- 3.Carthew RW, Sontheimer EJ. Origins and mechanisms of miRNAs and siRNAs. Cell. 2009;136:642–655. doi: 10.1016/j.cell.2009.01.035. [DOI] [PMC free article] [PubMed] [Google Scholar]
- 4.Krek A, Grun D, Poy MN, Wolf R, Rosenberg L, Epstein EJ, MacMenamin P, da Piedade I, Gunsalus KC, Stoffel M, Rajewsky N. Combinatorial microRNA target predictions. Nat Genet. 2005;37:495–500. doi: 10.1038/ng1536. [DOI] [PubMed] [Google Scholar]
- 5.Lewis BP, Burge CB, Bartel DP. Conserved seed pairing, often flanked by adenosines, indicates that thousands of human genes are microRNA targets. Cell. 2005;120:15–20. doi: 10.1016/j.cell.2004.12.035. [DOI] [PubMed] [Google Scholar]
- 6.Rehmsmeier M, Steffen P, Hochsmann M, Giegerich R. Fast and effective prediction of microRNA/target duplexes. RNA. 2004;10:1507–1517. doi: 10.1261/rna.5248604. [DOI] [PMC free article] [PubMed] [Google Scholar]
- 7.Lewis BP, Shih IH, Jones-Rhoades MW, Bartel DP, Burge CB. Prediction of mammalian microRNA targets. Cell. 2003;115:787–798. doi: 10.1016/s0092-8674(03)01018-3. [DOI] [PubMed] [Google Scholar]
- 8.Rajewsky N. MicroRNA target predictions in animals. Nat Genet. 2006;38(suppl):S8–S13. doi: 10.1038/ng1798. [DOI] [PubMed] [Google Scholar]
- 9.Watanabe Y, Tomita M, Kanai A. Computational methods for microRNA target prediction. Methods Enzymol. 2007;427:65–86. doi: 10.1016/S0076-6879(07)27004-1. [DOI] [PubMed] [Google Scholar]
- 10.Kuhn DE, Martin MM, Feldman DS, Terry AV, Jr, Nuovo GJ, Elton TS. Experimental validation of miRNA targets. Methods. 2008;44:47–54. doi: 10.1016/j.ymeth.2007.09.005. [DOI] [PMC free article] [PubMed] [Google Scholar]
- 11.Chi SW, Zang JB, Mele A, Darnell RB. Argonaute HITS–CLIP decodes microRNA–mRNA interaction maps. Nature. 2009;460:479–486. doi: 10.1038/nature08170. [DOI] [PMC free article] [PubMed] [Google Scholar]
- 12.Hafner M, Landthaler M, Burger L, Khorshid M, Hausser J, Berninger P, Rothballer A, Ascano M, Jr, Jungkamp AC, Munschauer M, Ulrich A, Wardle GS, Dewell S, Zavolan M, Tuschl T. Transcriptome-wide identification of RNA-binding protein and microRNA target sites by PAR-CLIP. Cell. 2010;141:129–141. doi: 10.1016/j.cell.2010.03.009. [DOI] [PMC free article] [PubMed] [Google Scholar]
- 13.Nonne N, Ameyar-Zazoua M, Souidi M, Harel-Bellan A. Tandem affinity purification of miRNA target mRNAs (TAP–Tar) Nucleic Acids Res. 2010;38:e20. doi: 10.1093/nar/gkp1100. [DOI] [PMC free article] [PubMed] [Google Scholar]
- 14.Orom UA, Lund AH. Isolation of microRNA targets using biotinylated synthetic microRNAs. Methods. 2007;43:162–165. doi: 10.1016/j.ymeth.2007.04.007. [DOI] [PubMed] [Google Scholar]
- 15.Vo NK, Dalton RP, Liu N, Olson EN, Goodman RH. Affinity purification of microRNA-133a with the cardiac transcription factor, Hand2. Proc Natl Acad Sci U S A. 2010;107:19231–19236. doi: 10.1073/pnas.1013162107. [DOI] [PMC free article] [PubMed] [Google Scholar]
- 16.Hassan T, Smith SG, Gaughan K, Oglesby IK, O’Neill S, McElvaney NG, Greene CM. Isolation and identification of cell-specific microRNAs targeting a messenger RNA using a biotinylated anti-sense oligonucleotide capture affinity technique. Nucleic Acids Res. 2013;41:e71. doi: 10.1093/nar/gks1466. [DOI] [PMC free article] [PubMed] [Google Scholar]
- 17.Hurteau GJ, Spivack SD. MRNA-specific reverse transcription–polymerase chain reaction from human tissue extracts. Anal Biochem. 2002;307:304–315. doi: 10.1016/s0003-2697(02)00058-1. [DOI] [PubMed] [Google Scholar]
- 18.Hurteau GJ, Spivack SD, Brock GJ. Potential mRNA degradation targets of hsa-miR-200c, identified using informatics and qRT–PCR. Cell Cycle. 2006;5:1951–1956. doi: 10.4161/cc.5.17.3133. [DOI] [PubMed] [Google Scholar]
- 19.Renthal NE, Chen C-C, Williams KC, Gerard RD, Prange-Kiel J, Mendelson CR. MiR-200 family and targets, ZEB1 and ZEB2, modulate uterine quiescence and contractility during pregnancy and labor. Proc Natl Acad Sci U S A. 2010;107:20828–20833. doi: 10.1073/pnas.1008301107. [DOI] [PMC free article] [PubMed] [Google Scholar]
- 20.Gregory PA, Bert AG, Paterson EL, Barry SC, Tsykin A, Farshid G, Vadas MA, Khew-Goodall Y, Goodall GJ. The miR-200 family and miR-205 regulate epithelial to mesenchymal transition by targeting ZEB1 and SIP1. Nat Cell Biol. 2008;10:593–601. doi: 10.1038/ncb1722. [DOI] [PubMed] [Google Scholar]
- 21.Hurteau GJ, Carlson JA, Spivack SD, Brock GJ. Overexpression of the microRNA hsa-miR-200c leads to reduced expression of transcription factor 8 and increased expression of E-cadherin. Cancer Res. 2007;67:7972–7976. doi: 10.1158/0008-5472.CAN-07-1058. [DOI] [PubMed] [Google Scholar]
- 22.Lal A, Thomas MP, Altschuler G, Navarro F, O’Day E, Li XL, Concepcion C, Han YC, Thiery J, Rajani DK, Deutsch A, Hofmann O, Ventura A, Hide W, Lieberman J. Capture of microRNA-bound mRNAs identifies the tumor suppressor miR-34a as a regulator of growth factor signaling. PLoS Genet. 2011;7:e1002363. doi: 10.1371/journal.pgen.1002363. [DOI] [PMC free article] [PubMed] [Google Scholar]
- 23.Place RF, Li LC, Pookot D, Noonan EJ, Dahiya R. MicroRNA-373 induces expression of genes with complementary promoter sequences. Proc Natl Acad Sci U S A. 2008;105:1608–1613. doi: 10.1073/pnas.0707594105. [DOI] [PMC free article] [PubMed] [Google Scholar]
- 24.Vasudevan S, Tong Y, Steitz JA. Switching from repression to activation: MicroRNAs can up-regulate translation. Science. 2007;318:1931–1934. doi: 10.1126/science.1149460. [DOI] [PubMed] [Google Scholar]
Associated Data
This section collects any data citations, data availability statements, or supplementary materials included in this article.


