

Abstract
Non-high-density lipoprotein cholesterol (NHDL) is an independent and superior predictor of CVD risk as compared to LDL alone. It represents a spectrum of atherogenic lipid fractions with possibly a distinct genomic signature. We performed genome-wide association studies (GWAS) to identify loci influencing baseline NHDL and its postprandial lipemic (PPL) response. We carried out GWAS in 4,241 participants of European descent. Our discovery cohort included 928 subjects from the Genetics of Lipid-Lowering Drugs and Diet Network (GOLDN) Study. Our replication cohorts included 3,313 subjects from the Heredity and Phenotype Intervention (HAPI) Heart Study and Family Heart Study (FamHS). A linear mixed model using the kinship matrix was used for association tests. The best association signal was found in a tri-genic region at RHOQ-PIGF-CRIPT for baseline NHDL (lead SNP rs6544903, discovery p = 7e-7, MAF = 2%; validation p = 6e-4 at 0.1 kb upstream neighboring SNP rs3768725, and 5e-4 at 0.7 kb downstream neighboring SNP rs6733143, MAF = 10%). The lead and neighboring SNPs were not perfect surrogate proxies to each other (D′ = 1, r2 = 0.003) but they seemed to be partially dependent (likelihood ration test p = 0.04). Other suggestive loci (discovery p < 1e-6) included LOC100419812 and LOC100288337 for baseline NHDL, and LOC100420502 and CDH13 for NHDL PPL response that were not replicated (p > 0.01). The current and first GWAS of NHDL yielded an interesting common variant in RHOQ-PIGF-CRIPT influencing baseline NHDL levels. Another common variant in CDH13 for NHDL response to dietary high fat intake challenge was also suggested. Further validations for both loci from large independent studies, especially interventional studies, are warranted.
Introduction
In contrast to all other lipid fractions, non-high-density lipoprotein cholesterol (NHDL), calculated by subtracting the amount of cholesterol in the HDL fraction from total cholesterol, quantifies almost all potentially atherogenic apolipoprotein B containing lipoproteins encompassing cholesterol bound to low-density lipoproteins (LDL), very low-density lipoproteins, intermediate-density lipoproteins, lipoprotein(a), chylomicrons, and chylomicron remnants (Miller et al. 2008; Robinson 2009; Robinson 2010). NHDL represents a superior predictor of cardiovascular risk in contrast to other lipid measures, even LDL cholesterol (Robinson 2009; Robinson 2010; Mahajan et al. 2012; ERFC 2009; Liu et al. 2006). Further, NHDL is an independent predictor of cardiovascular disease among other lipid measures, even among patients with normal triglyceride and LDL levels (Mahajan et al. 2012). A possible explanation is NHDL's well-established role in accelerating coronary atherosclerosis (Mahajan et al. 2012). According to a recent report, NHDL also can be a biomarker for nonalcoholic fatty liver disease, specifically, nonalcoholic steatohepatitis (Corey et al. 2012).
There is an increasing interest in better characterizing NHDL. While total cholesterol, TG, LDL and HDL have been extensively assessed in conventional family studies and GWA studies, NHDL has not been reported to date (Teslovich et al. 2010). In the present study, we evaluated the heritability of NHDL, and carried out GWA studies using data on families participating in the Genetics of Lipid-Lowering Drugs and Diet Network (GOLDN) Study for baseline fasting values, as well as response to a standardized dietary fat intake challenge. Replications of genomic findings were sought in two independent cohorts including the Heredity and Phenotype Intervention (HAPI) Heart Study for both baseline NHDL and NHDL response to dietary high fat intake challenge (i.e., its post-prandial lipemic response or response to PPL), and the non-overlapping Family Heart Study (FamHS) for baseline NHDL only (NHDL response to PPL phenotype was not available from the FamHS).
Materials and Methods
Ethics Statement
Written informed consent including consent to participate in genetic studies was obtained from each participant. All studies received approval from local ethical oversight committees.
The GOLDN Study
The GOLDN Study was one of several NIH-funded family-intervention studies within the Program for Genetic Interaction Network which targeted gene-environment interactions. One of the two primary aims of the GOLDN study was to characterize the role of genetic factors on an individual's lipemic response to dietary fat challenge. The GOLDN population consisted of a total of 1122 subjects (540 men and 582 women, all of European descent, mean age 48.2±16.2 years) from 189 families recruited from two field centers (Minneapolis, Minnesota and Salt Lake City, Utah) previously identified in the Family Heart Study (Higgins et al. 1996). Eligible inclusion criteria included (1) age 19 years and older; (2) fasting TG levels less than 1,500 mg/dl; (3) willingness to participate in the study and attend the scheduled clinic exams; (4) member of a family with at least two members in a sibship; (5) normal AST and ALT levels; and (6) creatinine levels of 2 mg/dl or lower. Exclusion criteria included (1) history of liver, kidney, pancreas, gall bladder or malabsorption diseases; (2) current pregnancy; (3) use of insulin; (4) use of lipid-lowering drugs (prescription, over the counter, and nutriceuticals; volunteers taking these agents were withdrawn from them at least 4 weeks prior to the study with physician's approval); (5) use of warfarin; (6) childbearing women with potentiality of not using an acceptable form of contraception; (7) known hypersensitivity to fenofibrate; (8) history of pancreatitis within 12 months prior to enrollment (http://clinicaltrials.gov/show/NCT00083369; Kabagambe et al. 2009; Wojczynski et al. 2010). Written informed consent was obtained from each participant, and the Institutional Review Board at each participating institution approved the study protocol.
The GOLDN study aimed to identify loci for phenotypic variation in response to dietary intake of a standardized high-fat meal and fenofibrate therapy. All participants were instructed to stop using other lipid-lowering drugs and/or nutriceuticals which may affect serum lipids for at least four weeks, fast for at least eight hours, and abstain from alcohol for at least 24 hours prior to study visits. For the current analysis, we assessed baseline NHDL (total cholesterol minus HDL) and its postprandial lipemic (PPL) response derived from total cholesterol and HDL measurements at 0, 3.5 and 6 hours after a high-fat intake prior to any exposure to the study drug (fenofibrate). The analysis sample consisted of 812 subjects (404 men and 408 women, mean age 48.3 ± 15.9 years, 59% or 479 subjects with their baseline NHDL levels ≥ 130 mg/dL) who had complete baseline phenotypic and genotypic information. Characteristics from the 137 subjects (134 men, 3 women) with incomplete baseline phenotypic and genotypic information were in general compatible with the analysis sample characteristics (e.g., age, BMI, baseline NHDL). Of the 1,122 willing and eligible subjects, 1,035 subjects had complete NHDL PPL response phenotypic information, where 743 subjects had complete genotypic information.
We followed a standard protocol in performing the high-fat meal challenge (Patsch et al. 1992). The caloric intake of the intervention meal was determined by body surface area, and contained 700 kilocalories per m2 body surface area. The meal composition was 83%, 14% and 3% of calories from fat, carbohydrates, and protein, respectively. The meal was formulated to have a cholesterol content of 240 mg and a polyunsaturated:saturated fat ratio of 0.06. Based on these guidelines, the average individual ingested 175 mL of heavy whipping cream (39.5% fat) combined with 7.5 mL powdered, instant, non-fat, dry milk, and blended with ice. To increase palatability of the drink, 15 mL of chocolate- or strawberry-flavored syrup was also added. Participants had 15 minutes to ingest this meal and were required to fast for at least 8 hours prior to the meal. Immediately before ingestion, we drew blood samples on all participants (0 hour, fasting, baseline), and then again at 3.5 and 6 hours after the high-fat meal intake. Participants rested and remained otherwise fasting during the 6 hours post-fat challenge. Participants underwent interventions of acute fat loading dietary challenge both before and after a 3 week open-label intervention trial of fenofibrate. In this analysis, we only assessed baseline NHDL and its response to high fat challenge prior to any fenofibrate administration.
The Family Heart Study (FamHS)
The FamHS began in 1992 with the ascertainment of 1,200 white families, half randomly sampled, and half selected because of an excess of CHD or risk factor abnormalities as compared with age- and sex-specific population rates (Higgins et al. 1996). The families with about 6,000 individuals were sampled on the basis of information on probands from population-based parent studies including the Framingham Heart Study, the Utah Family Tree Study, and the Atherosclerosis Risk in Communities Study. After providing appropriate informed consent, the subjects attended a visit (visit 1) between the years 1994 to 1996. A broad range of phenotypes including total cholesterol, TG and HDL levels were assessed in the general domains of CHD, atherosclerosis, cardiac and vascular function, inflammation and homeostasis, lipids and lipoproteins, blood pressure (BP), diabetes and insulin resistance, pulmonary function, diet, habitual physical activity, anthropometry, medical history and medication use.
The HAPI Heart Study
The HAPI Heart Study began in 2003 to identify genes that interact with environmental exposures to influence risk for CVD (Mitchell et al. 2008). The replication study described here was carried out in 843 Old Order Amish participants (of a total of 868 participants) who underwent a high fat feeding intervention and were successfully genotyped using the Affymetrix GeneChip® Human Mapping 500K Array Set. The sample consisted of 453 men and 390 women (mean age 44 ± 14 years, inbreeding coefficient 0.03 ± 0.01). All subjects could be connected to a single 14-generation pedigree (Agarwala et al. 2001). They underwent a medical history interview including assessment of CVD risk factors, prescription and nonprescription medication usage and questions about prior history of CVD. Physical examinations were conducted at the Amish Research Clinic (Strasburg, PA), and blood samples were obtained following an overnight fast. Those taking lipid-lowering medications at enrollment (1.3%) discontinued usage 7 days prior to the examination.
The high fat challenge administered to the HAPI Heart Study subjects after an overnight fast was prepared in the form of a whipping cream milk shake. It was standardized to consist of 782 calories per m2 of body surface area with 77.7%, 19.2 and 3.1% of calories from fat, carbohydrate and protein, respectively. Blood was drawn from each subject just prior to (time=0 hour, fasting, baseline) and 1, 2, 3, 4 and 6 hours after ingestion of the fat load to assess the TG excursion. The subject rested and remained otherwise fasting during the 6 hours post-fat challenge. Total cholesterol, TG and HDL were measured at each time point.
NHDL and Other Lipid Measurements in the GOLDN Study
Serum and EDTA-anticoagulant tubes were collected and processed using a standardized protocol, aliquoted, and stored at -70°C until time of use. Analysis was completed on all stored samples at the end of the study, and all samples for an individual were processed in the same batch to reduce measurement error. TG measurement was calculated using the glycerol-blanked enzymatic method on the Roche COBAS FARA centrifugal analyzer (Roche Diagnostics Corporation, IN). Hyper-triglyceridemia was defined as a baseline TG ⩾ 150 mg/dL. HDL measurement was calculated using the same procedure as TG measurement after precipitation of NHDL with magnesium/dextran. LDL measurement employed a homogeneous direct method (LDL Direct Liquid Select™ Cholesterol Reagent, Equal Diagnostics, PA) on a Hitachi 911 Automatic Analyzer.
Genotyping in the GOLDN Study
Genetic material was processed and hybridized using Puregene reagents (Gentra System, Inc, Minneapolis, MN), according to the manufacturer's instructions. A total of 906,600 SNPs were genotyped on the Affymetrix Genome-Wide Human SNP Array 6.0 using the Birdseed calling algorithm (Korn et al. 2008). Genotyping was completed in two batches by two different technicians with no significant variation between batches. Participants with an overall call rate of < 96% were excluded (n = 16). Monomorphic SNPs (n = 55,530) and SNPs with a call rate < 96% (n = 82,462) across all participants were also excluded. We assessed Mendelian errors using LOKI (Heath 1997) and familial relationships based on identity by state were checked using the GRR software (Abecasis et al. 2001). Corrections to the family relationships were made as warranted by the data. SNPs were excluded from the analysis if they displayed excess Mendelian errors within the families (n = 45,778 SNPs). After these exclusions, we also excluded SNPs with MAF < 0.01 (n = 63,908) or a Hardy-Weinberg equilibrium (HWE) p < 1E-06 (n = 12). This resulted in 658,910 genotyped SNPs (or 584,060 genotyped autosomal SNPs) passing quality control filters and used for the imputation. We employed MACH version1.0.16 (Li et al. 2009; Li et al. 2010) to impute genotype data for un-typed SNPs using the CEU Human Genome release 22, build 36 as the reference. All SNPs were strand oriented to the mlinfo file from MACH. We created a hybrid dataset by combining genotyped and imputed SNPs, which contains 2,543,887 SNPs of which 584,029 SNPs were genotyped (31 of 584,060 SNPs with unknown strand orientation information were excluded from the hybrid dataset).
Genotyping - GOLDN Subjects Genotyped in the FamHS (GOLDN-FamHS)
A subset of GOLDN participants were phenotyped for PPL response, however their genotyping was performed by the parent study, the FamHS. For these individuals (total n = 210, current analysis n = 116), we obtained their genotype from FamHS. All FamHS subjects were genotyped on one of three Illumina platforms: (i) Illumina HumMap 550K chip with 547,353 SNP markers, (ii) Illumina Human 610-Quadv1 chip with 576,888 SNP markers, or (iii) Illumina Human 1M-Duov3 chip with 1,111,639 SNP markers. Quality control was performed before imputation by checking pedigree relationships (using GRR software), and excluding SNPs with low call rates (< 98%). A framework map for imputation was defined by choosing SNPs on all platforms, and restricting to those with MAF >1%, and excluding SNPs with significant (p < 1e-6) departure from HWE. This panel was used to impute ∼2.5 M SNPs based on phased haplotypes from HapMap (release 22, build 36, CEU, http://hapmap.ncbi.nlm.nih.gov/downloads/phasing/2007-08_rel22/phased/) using MACH (version 1.0.16, http://www.sph.umich.edu/csg/abecasis/mach/). Genetic analyses for these subjects was similar to the subjects genotyped by GOLDN, however additional adjustment was performed to control for differences due to the use of different genotyping platforms (550K, 610 and 1M).
Genotyping in the HAPI Heart Study
Replication SNPs were extracted from the HAPI Heart Study HapMap imputation file, which was constructed using genotypes from the Affymetrix GeneChip Human Mapping 500K Array Set (Affymetrix, Santa Clara, California). Briefly, 500,568 SNP calls on each subject were generated using the BRLMM genotype-calling algorithm, resulting in a mean genotype call rate of 98.3%. A total of 369,241 SNPs with MAF > 1% that passed quality control, Mendel checks and HWE checks (at p < 1e-6) were retained for imputation up to HapMap (release 22, build 36, CEU, http://hapmap.ncbinlm.nih.gov/downloads/phasing/2007-08_rel22/phased/) using MACH (version 1.0.16, http://www.sph.umich.edu/csg/abecasis/mach/).
Statistical Methods
Cryptic population substructure was assessed by estimating the first 10 principal components (PCs) using the EIGENSTRAT computer software in the genotype data (Price et al. 2006). NHDL was calculated by subtracting HDL from total cholesterol at baseline, 3.5 and 6 hours after PPL. We calculated the area under the curve (AUC) using the trapezoid method to describe the change in NHDL during PPL using the growth curve method (Madsen et al. 1986; Corbett et al. 2003; Wojczynski et al. 2010), and used standardized NHDL AUC residuals as the response phenotype. The idea of growth curves is to simultaneously estimate each subject's response under a mixed model using everyone's data. This modeling offers a method to reduce measurement error at the price of making a few assumptions. Mainly, it assumes that the intercepts, slopes and any higher order terms are normally distributed. Baseline NHDL was adjusted for age, age2, age3, BMI, centers and 10 PCs, by sex. NHDL response to PPL was similarly adjusted adding baseline NHDL.
Heritability estimates were calculated using maximum-likelihood variance components methods implemented in the SOLAR (v2.2.4) software (Almasy and Blangero 1998). A linear mixed model in R using the kinship matrix was used for single SNP association testing assuming an additive dosage model. A criterion of p < 5e-8 was used to declare GWA significance; a criterion of p < 1e-6 was used to flag suggestive GWA signals and were taken forward for replication. GWA tests were performed separately in the GOLDN Study and GOLDN-FamHS, followed by an uncorrelated beta meta-analysis using beta and standard error estimates from both GWA studies (Province 2001; Province and Borecki 2013). The quantile-quantile (Q-Q) plots of p-values were used to inspect deviations from the expected test statistic distribution. The Manhattan plots were generated to illustrate the discovery results for both baseline NHDL and the response to PPL.
Replication Strategy
The HAPI Heart Study cohort was used as a replication sample of emerged association signals from the discovery cohorts for baseline NHDL as well as NHDL response to PPL. The association analyses were performed in MMAP (O'Connell 2009) using a mixed model measuring the additive effect of genotype on the quantitative trait while simultaneously estimating the fixed effects of age, age2, age3, sex and BMI (and baseline NHDL for NHDL response to PPL), and random polygenic and residual effects. The polygenic component was modeled using the relationship matrix derived from the complete Amish pedigree structure available through the Anabaptist Genealogy Database (Agarwala et al. 1998; Agarwala et al. 1999). Additionally, the non-overlapping FamHS (n = 2,470) was used to replicate emerged association signals from the discovery cohorts for baseline NHDL. Similarly, baseline NHDL was adjusted for age, age2, age3, BMI, centers and 10 PCs, by sex, in the non-overlapping FamHS. A linear mixed model in R using the kinship matrix was used for single SNP association testing assuming an additive dosage model. A Bonferroni correction was used to account for multiple tests.
Results
Clinical Characteristics
The discovery cohorts comprised 928 adult subjects from the GOLDN Study (n = 812 genotyped by the GOLDN Study and GOLDN-FamHS (116 GOLDN participants genotyped by the FamHS). There were no sex differences of mean age (p = 0.89), BMI (p = 0.63) and baseline NHDL (p = 0.41) in the GOLDN Study. There were also no sex differences of mean age (p = 0.82), BMI (p = 0.63) and baseline NHDL (p = 0.57) in the GOLDN-FamHS. While subjects in the GOLDN-FamHS were significantly older than those in the GOLDN Study (p < 0.0001 in men and women), no significant mean differences in BMI (p = 0.98 in men and p = 0.72 in women) and baseline NHDL (p = 0.57 in men and p = 0.40 in women) were observed between the two groups (Table 1). The replication cohorts comprised 843 adult subjects from the HAPI Heart Study for both baseline NHDL and NHDL response to PPL as well as 2,470 adult subjects from the non-overlapping FamHS for baseline NHDL. Details of sample sizes and characteristics including age and BMI along with NHDL measurements at baseline and 3.5 (3 for the HAPI Heart Study) and 6 hours after high fat intake challenge were given separately by sex in Table 1. Heritability estimates ± standard errors were 59 ± 7% (p = 8e-21) for baseline NHDL and 18 ± 7% (p = 0.003) for NHDL response to PPL in the GOLDN Study.
Table 1. Sample Characteristics (Mean, Standard Deviation, SD) of the Discovery and Replication Study Cohorts.
| Variable | Discovery GOLDN Men |
(N= 12) | GOLDN_FamHS Men |
(N=116) Women | Replication HAPI Men |
(N=843) Women | FamHS Men |
(N=2470) Women |
|---|---|---|---|---|---|---|---|---|
| N | 404 | 408 | 54 | 62 | 453 | 390 | 1176 | 1294 |
| Age (years) | 48.3±16.0 | 48.4±15.9 | 58.3±14.9 | 57.7±13.9 | 42.3±13.6 | 45.3±14.2 | 49.3±14.3 | 49.3±13.2 |
| BMI (kg/m2) | 28.6±4.6 | 28.3±6.2 | 28.6±5.3 | 28.0±7.2 | 25.6±3.2 | 27.7±5.4 | 27.9±4.8 | 27.1±6.3 |
| NHDL (mg/dL) | ||||||||
| 0 hour | 142±36 | 139±42 | 139±36 | 135±38 | 150±43 | 156±49 | 149±35 | 137±36 |
| 3.5 hours* | 147±36 | 145±42 | 142±39 | 136±37 | 158±44 | 162±48 | N/A | N/A |
| 6 hours | 148±37 | 146±44 | 145±42 | 138±39 | 162±45 | 165±50 | N/A | N/A |
The HAPI Heart Study samples were collected at 0, 3 (instead of 3.5 hours in the GOLDN Study) and 6 hours.
GWAS Discoveries
Using GWAS/QT (Feng et al. 2011) computer software, we found that the GOLDN Study and the HAPI Heart Study had 80% power to detect a variant with about 3 – 4% heritability; the FamHS had 80% power to detect a variant with about 1 – 2% heritability. Due to the different genotyping platforms employed, we performed an overall meta-analysis of results from GWAS data (beta estimates and standard errors) from the discovery cohort subjects that were genotyped on different genotyping technologies. Results were depicted in Fig. 1A for baseline NHDL and Fig. 1B for NHDL response to PPL. Genomic control λ inflation factor estimates were 0.94 (standard error 4e-5) for baseline NHDL and 0.88 (standard error 4e-5) for NHDL response to PPL. Our top GWAS signals (MAF > 1%, discovery p < 1e-6) were summarized in Table 2. These included three loci (2p21, 2q32.3, 4q34.3) for baseline NHDL and two loci (9p22.3, 16q23.3) for NHDL response to PPL. For baseline NHDL, the first locus involved three intronic SNPs at RHOQ-PIGF-CRIPT (rs7557785, rs17035304, rs6544903, MAF = 0.02, only rs6544903 data shown in Table 2). This extensive cluster of association signals were in linkage disequilibrium (LD) spanning a narrow tri-genic region (r2 > 0.99, ∼51 kb, Fig. 2). The second locus also involved three SNPs near LOC100419812 (rs17513156 in LD with rs16835793, MAF = 0.26, r2 = 0.98; rs11688042 not in LD with rs16835793, MAF = 0.14, r2 = 0.40; only rs16835793 data shown in Table 2). The third locus involved a SNP near LOC100288337 (rs10446830, MAF = 0.40, Table 2). The SNPs rs6544903, rs16835793 and rs10446830 accounted for 3%, 2% and 1%, respectively, of phenotypic variation in baseline NHDL, and these three loci collectively accounted for 5.2% of phenotypic variation in baseline NHDL. The three loci were significantly associated with baseline LDL (p < 0.0001) and TG (p = 0.003 to < 0.0001) but not with HDL (p > 0.05) except for rs6544903 which was also significantly associated with HDL (p = 0.004). For NHDL response to PPL, the first locus involved a SNP near LOC100420502 (rs927969, MAF = 0.11, Table 2) and the second locus involved an intronic SNP at CDH13 (rs17756260, MAF = 0.10, Table 2). Each of the SNPs rs927969 and rs17756260 accounted for 1% of phenotypic variation in NHDL response to PPL, and the two loci collectively accounted for 1.5% of phenotypic variation in NHDL response to PPL. The two loci were also significantly associated with LDL PPL response (p < 0.0025) but not with TG and HDL PPL responses (p > 0.05). Further, adjusted mean with standard error for each of the five lead SNPs by genotypes in the GOLDN Study were depicted in Fig. 3A (rs6544903) – 3B (rs16835793) – 3C (rs10446830) for baseline NHDL and Fig. 3D (rs927969) – 3E (rs17756260) for NHDL response to PPL. For convenience of reference, the estimated effect size (r2) for each of the five lead SNPs was also given in each figure subtitle (Fig. 3A-3E).
Fig. 1.
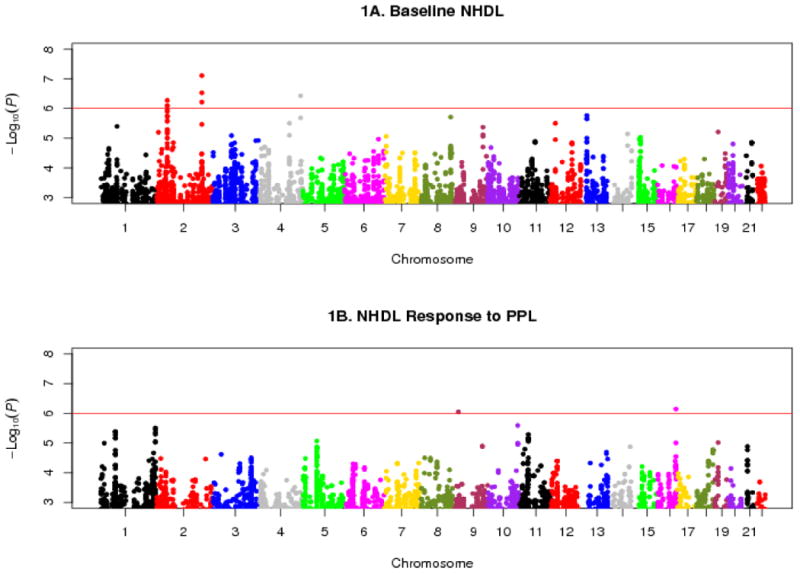
Manhattan plots of GWAS results for baseline NHDL (1A) and NHDL PPL response (1B). Horizontal reference line denotes p = 1e-6 on a -log10 scale (6.0).
Table 2. Top GWAS Signals at P < 1e-6 for Baseline NHDL and NHDL PPL Response from the Discovery and Replication Cohorts.
| SNP | Region | Gene | Position | Discovery EA/NEA |
EAF | B | SE | P | HAPI EA/NEA |
EAF | B | SE | P | FamHS EA/NEA |
EAF | B | SE | P |
|---|---|---|---|---|---|---|---|---|---|---|---|---|---|---|---|---|---|---|
| Baseline | ||||||||||||||||||
| rs6544903 | 2p21 | RHOQ-PIGF-CRIPT | 46820910 | C/T | 0.98 | -0.79 | 0.16 | 7e-7 | C/T | 0.99 | 0.05 | 0.27 | 0.84 | C/T | 0.98 | -0.17 | 0.11 | 0.11 |
| C/G† | 0.10 | 0.17 | 0.05 | 6e- | ||||||||||||||
| A/G† | 0.10 | 0.17 | 0.05 | 5ê | ||||||||||||||
| rs16835793 | 2q32.3 | LOC100419812- | 195254584 | A/G | 0.74 | -0.30 | 0.06 | 8e-8 | A/G | 0.65 | 0.10 | 0.05 | 0.06 | A/G | 0.65 | -0.04 | 0.04 | 0.30 |
| C/G† | 0.70 | 0.003 | 0.03 | 0.93 | ||||||||||||||
| C/T† | 0.05 | -0.14 | 0.07 | 0.03 | ||||||||||||||
| rs10446830 | 4q34.3 | LOC100288337- | 181213513 | A/G | 0.60 | -0.27 | 0.05 | 4e-7 | A/G | 0.61 | 0.14 | 0.08 | 0.07 | A/G | 0.60 | -0.01 | 0.03 | 0.83 |
| C/G† | 0.17 | 0.11 | 0.04 | 0.01 | ||||||||||||||
| C/T† | 0.17 | 0.004 | 0.04 | 0.92 | ||||||||||||||
| Response | ||||||||||||||||||
| rs927969 | 9p22.3 | LOC100420502- | 14524438 | A/C | 0.89 | 0.45 | 0.09 | 9e-7 | A/C | 0.83 | 0.03 | 0.07 | 0.64 | N/A‡ | N/A | N/A | N/A | N/A |
| rs17756260 | 16q23.3 | CDH13 | 83290017 | A/G | 0.90 | -0.41 | 0.08 | 7e-7 | A/G | 0.90 | 0.12 | 0.08 | 0.13 | N/A | N/A | N/A | N/A | N/A |
: EA/NEA, effect/non-effect alleles; EAF, effect allele frequency.
: Upstream and downstream neighboring SNPs for baseline NHDL in FamHS (see Results).
: Not available.
Fig. 2.
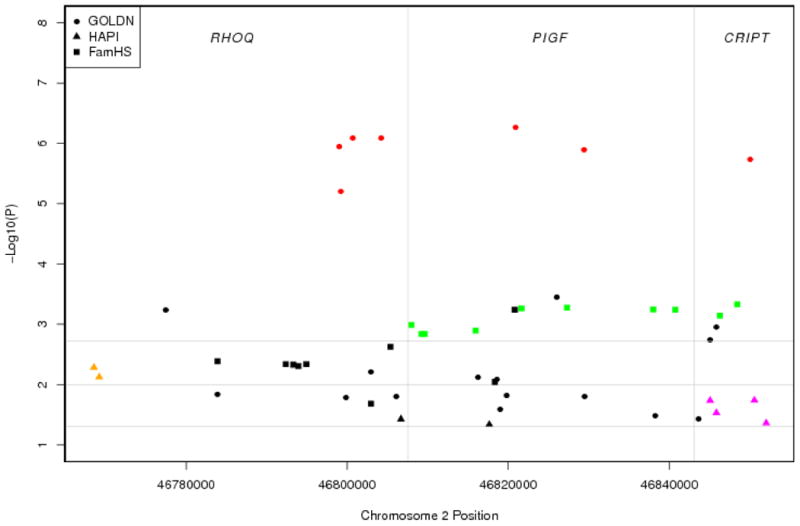
Region plot of RHOQ-PIGF-CRIPT genes in the GOLDN Study (solid dots), HAPI Heart Study (solid triangles) and also the non-overlapping FamHS (solid rectangles) for baseline NHDL (shown only SNPs with p < 0.05). Color symbols denote SNPs in LD (r2 > 0.8) in the GOLDN Study (red), HAPI Heart Study (yellow and purple) and non-overlapping FamHS (green). Horizontal reference lines denote p = 0.05 on a -log10 scale (1.3), p = 0.01 on a -log10 scale (2.0) and p = 0.0019 on a -log10 scale (2.7).
Fig. 3.
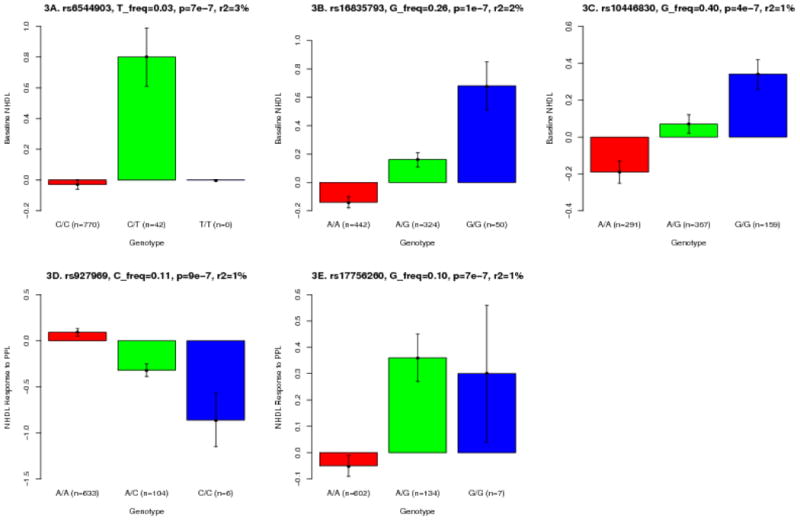
Histogram plots of means and standard errors by genotypes in the GOLDN Study: PIGF rs6544903 (3A), LOC100419812- rs16835793 (3B), LOC100288337- rs10446830 (3C) for baseline NHDL, and LOC100420502- rs927969 (3D), CDH13 rs17756260 (3E) for NHDL PPL response.
GWAS Replications
Using Bonferroni corrected significance criterion p < 0.01 (0.05/5) for five replication tests, we found that all the 5 lead SNPs were not exactly replicated in the HAPI Heart Study (rs6544903, p = 0.84; rs16835793, p = 0.06; rs10446830, p = 0.07; with B estimates approaching zero or in opposite association directions; and rs927969, p = 0.64; rs17756260, p = 0.13; Table 2). We determined the effective number of independent SNPs in the LD region in RHOQ-PIGF-CRIPT using the simpleM method (Gao et al. 2008). The Bonferroni corrected p criterion < 0.0019 (0.05/26 for the estimated 26 independent SNPs) was used. In the HAPI Heart Study, no significant replications were found (only with two SNPs approaching significance borderline – rs1376405, p = 0.005; rs17819022, p = 0.018; r2 < 0.60; Fig. 2). In the FamHS data, where the tri-genic region was similarly surveyed, we found that a cluster of neighboring SNPs surrounding the lead SNP rs6544903 within a haplotype block (rs3768725 and rs6733143 in complete and perfect LD, D′ = 1, r2 = 1) attained replication significance criterion (e.g., rs3768725, 108 bp upstream from rs6544903, p = 6e-4; rs6733143, 730 bp downstream from rs6544903, p = 5e-4; D′ = 1, r2 = 0.003, incomplete LD with the lead SNP; Table 2, Fig. 2). Upstream and downstream neighboring SNPs for the two remaining baseline NHDL signals were similarly queried; they were either borderline or non-significant for rs16835793 (rs981143, r2 = 0.74, p = 0.93; rs2884392, r2 = 0.02, p = 0.03) and for rs10446830 (rs13120551, r2 = 0.39, p = 0.014; rs9993694, r2 = 0.14, p = 0.92; Table 2). Same effort could not be exercised for NHDL PPL response because the phenotype was not measured or derived in the FamHS.
Discussion
GWAS of NHDL has not been reported previously. The absence of genetic analysis using NHDL as a phenotype may in part result from its relatively recent recognition as an important, independent and superior predictor of cardiovascular outcomes relative to other atherogenic measures (Robinson 2009; Robinson 2010; Mahajan et al. 2012; ERFC 2009; Liu et al. 2006). In this analysis, we identified five suggestive common loci influencing NHDL levels; one locus for the baseline within a region of LD in RHOQ-PIGF-CRIPT was replicated at neighboring SNPs in the FamHS, two loci (near LOC100419812, near LOC100288337) for the baseline, and two loci for the PPL response (near LOC100420502, within CDH13) were not replicated in the available studies.
The first and most interesting locus for baseline NHDL resides within the PIGF gene that encodes phosphatidylinositol (GPI) glycan anchor biosynthesis, class F protein, involved in GPI-anchor biosynthesis. The GPI-anchor is a glycolipid which contains three mannose molecules in its core backbone. The GPI-anchor is found on many blood cells and serves to anchor proteins to the cell surface. This protein and another GPI synthesis protein, PIGO, function in the transfer of ethanolaminephosphate (EtNP) to the third mannose in GPI. At least two alternatively spliced transcripts encoding distinct isoforms have been found for this gene. It is noteworthy that multiple association signals (mostly in high LD) were found within a tight three-gene (RHOQ-PIGF-CRIPT) region in the GOLDN Study with a similar pattern in the HAPI Heart Study and the non-overlapping FamHS (Fig. 2). The RHOQ gene encodes a member of the Rho family of small GTPases, which cycle between inactive GDP-bound and active GTP-bound states and function as molecular switches in signal transduction cascades. Rho proteins promote reorganization of the actin cytoskeleton and regulate cell shape, attachment, and motility. The encoded protein is an important signaling protein for sarcomere assembly and has been shown to play a significant role in the exocytosis of the solute carrier family 2, facilitated glucose transporter member 4 and other proteins, possibly acting as the signal that turns on the membrane fusion machinery. The CRIPT gene encodes cysteine-rich POZ-binding protein. This locus has also been reportedly associated with type 2 diabetes (Ban et al. 2010) and anthropometric traits with evidence of interaction with age (Croteau-Chonka et al. 2011). We took advantage of knowledge of this association to further examine several relevant traits (LDL, TG, BP) within the GOLDN Study and the non-overlapping FamHS data. We found that PIGF rs6544903 was also associated with LDL (p = 1e-3), SBP (p = 6e-4), DBP (p < 1e-4) in the GOLDN Study and TG (p = 0.03) in the non-overlapping FamHS (unpublished data). Interestingly, the clustering of multiple relevant traits or risk factors for atherosclerotic cardiovascular disease at or near this locus would infer it to be pleiotropic and consequential to functions fundamental to mechanisms of lipid metabolism and thus the development of atherosclerosis.
The second association signal for baseline NHDL was found between GLULP6 and LOC100419812 that was marginally replicated (p = 0.06 in the HAPI Heart Study, Table 2; p = 0.05 in the non-overlapping FamHS, not shown in Table 2). However, this association signal was likely not replicated because the B estimates in the discovery and replication cohorts were in opposite directions (Table 2). Both GLULP6 (glutamate-ammonia ligase, glutamine synthetase, pseudogene 6) and LOC100419812 (COBW domain containing 7 pseudogene) are pseudogenes. Knowledge of their function is currently lacking. Previous studies identified this locus was associated with a wide spectrum of relevant traits including blood lipid profiles (Kathiresan et al. 2007), BP and arterial stiffness (Levy et al. 2007), BMI and waist circumference (Fox et al. 2007), hemostatic status and hematologic phenotypes (Yang et al. 2007) as well as bipolar disorder (Psychiatric GWAS Consortium 2011). Again, these observations seem to imply a relevance of these loci to NHDL's significance as a biomarker for cardiovascular disease. Finally, our third association signal for baseline NHDL was found near LOC100288337 (NADH dehydrogenase, ubiquinone, 1 beta subcomplex, 5, 16kDa pseudogene). Associations of this locus with heart failure, heart rate, stroke, BMI and BP have been reported before (Levy et al. 2007; Johansson et al. 2010), and again are consistent with the theme of NHDL's relationship with cardiovascular disease. The first association signal for NHDL response to PPL was found near LOC100420502 (cell division cycle associated 4 pseudogene). This locus was also reportedly associated with TG (dbGap data source). However, it appeared to be premature to speculate as to the biological relevance of these pseudogene elements in the absence of solid replication from this study and other independent studies. It is also possible that the novel locus between the pseudogenes reflects a nearby region harboring additional yet unidentified functional elements, possibly including non-coding RNA genes. Future studies that can statistically validate (or refute) this locus are needed, as well as more precise physical localization of causal variants and their functionality.
Our best association signal for NHDL response to PPL was found within CDH13 codifying for cadherin-13 (also known as T-cadherin or H-cadherin) which is considered a vascular adiponectin receptor. Further, CDH13 has been reportedly associated with adiponectin levels in several studies (Ling et al. 2009; Jee et al. 2010; Chung et al. 2011; Aslibekyan et al. 2012) including the GOLDN Study (Aslibekyan et al. 2012 et al. 2010). Besides, CDH13 has also found associated with BMI, coronary artery disease, hypertension, myocardial infarction, dyslipidemia and metabolic syndrome (Fox et al. 2007; Wellcome Trust Case Control Consortium 2007; Org et al. 2009; Shia et al. 2011; Fava et al. 2011). Again, this locus for NHDL response to PPL needs to be reconfirmed among independent cohorts though this phenotype was even rarely measured in interventional studies. The observation of such a locus clustered with multiple relevant risk factors would suggest that this locus is responsible for functions fundamental to mechanisms of lipid metabolism and atherosclerosis.
An interesting note is worthy to be briefed. In the GOLDN Study, we have observed that the top association signal PIGF rs6544903 for baseline NHDL (p = 7e-7) was also with significant (p < 0.01) influential effects on NHDL response to PPL (data not shown). This observation would suggest that the locus may regulate both baseline NHDL and its response to PPL through shared pathway(s) or mechanism(s). At the remaining loci, we did not find significant evidence for both traits indicating that the gene effects at these loci may be specific to the baseline or the response to PPL, and they may regulate the phenotypes differentially through different pathways or mechanisms.
The heritability estimate for baseline NHDL was 59% (SE = 7%, p = 8e-2), in line with previously reported heritability estimates of 48 - 87% for measured plasma apolipoprotein and lipid levels (Beekman et al. 2002). The heritability estimate for NHDL PPL response was modest but significant (18%, SE = 7%, p = 0.0026), indicating that genetic loci also may influence response to dietary fat load. Understanding the genetic underpinnings of such dietary responses can be important in identifying individuals who may not tolerate fatty diets and preserve their cardiovascular health, although larger sample sizes may be needed to discover these loci.
Two upstream and downstream neighboring SNPs rs3768725 and rs6733143 (MAF = 10%) of the PIGF rs6544903 (the lead SNP) were in perfect LD with each other, but each of these neighboring SNPs was not in complete LD with the lead SNP (MAF = 2%). The observed variations in LD measures (D′ → 1, r2 → 0) may be explained by low MAF of the lead SNP (Marroni et al. 2011; Muller 2004; Hedrick and Kumar 2001). We took advantage of the larger FamHS data, compared the unconditional model (rs3768725 only) against conditional model (rs3768725 and rs6544903) using a likelihood ratio test, and found support for partial dependence of rs3768725 on rs6544903 (χ2 = 4.1, df = 1, p = 0.04; data not shown in Results). Even though these SNPs may not be perfect surrogate proxies for each other, the validation from the FamHS for these variants associated by LD, together with the sound biology of the RHOQ-PIGF-CRIPT genes in lipid metabolism, support their role influencing NHDL levels at baseline. Search for actual causal variants can be pursued through complete sequencing of the region.
This study has some limitations. The power for the discovery and replication cohorts (not including the FamHS) is limited, and therefore, variants with low effect size could have been missed in discovery. Likewise, failure to replicate associated variants may be hampered by the limited power of the replication cohort. Future studies of baseline NHDL could be conducted in a consortium context with a considerably larger sample size; however, few studies have assessed the unique PPL response phenotype.
In summary, two common associated variants were identified for NHDL, one at RHOQ-PIGF-CRIPT associated with the baseline, one at CDH13 associated with the PPL response. The findings, if further replicated, potentially advance our current understanding of physiology of blood lipid metabolism and pathophysiology of CVD.
Acknowledgments
The authors thank the other investigators, the staff and the participants of the GOLDN Study, the HAPI Heart Study and the Family Heart Study.
Sources of Funding: The GOLDN Study support was provided by the NHLBI grant U01 HL072524. The FamHS was supported by NIH grants R01 HL087700 and R01 HL088215 (Michael A. Province, PI) from NHLBI, and R01 DK8925601 and R01 075681 (Ingrid B. Borecki, PI) from NIDDK. The investigators thank the GOLDN and FamHS participants and staff for their valuable contributions. The HAPI Heart Study was supported by NIH research grants U01 HL072515, R01 HL104193, U01 HL084756 and the Mid Atlantic Nutrition and Obesity Research Center grant P30 DK072488. We thank the staff at the Amish Research Clinic for their outstanding efforts and our Amish research volunteers for their long-standing partnership in research.
Footnotes
Disclosures: None.
Contributor Information
Ping An, Email: anping@wustl.edu, Department of Genetics Division of Statistical Genomics (campus box 8506), Washington University School of Medicine, 4444 Forest Park Blvd, St. Louis, MO 63108, USA.
Robert J. Straka, Email: strak001@umn.edu, Department of Experimental and Clinical Pharmacology, University of Minnesota, Minneapolis, MN, USA
Toni I. Pollin, Department of Medicine, University of Maryland School of Medicine, Baltimore, MD, USA
Mary F. Feitosa, Department of Genetics Division of Statistical Genomics (campus box 8506), Washington University School of Medicine, 4444 Forest Park Blvd, St. Louis, MO 63108, USA
Mary K. Wojczynski, Department of Genetics Division of Statistical Genomics (campus box 8506), Washington University School of Medicine, 4444 Forest Park Blvd, St. Louis, MO 63108, USA
E. Warwick Daw, Department of Genetics Division of Statistical Genomics (campus box 8506), Washington University School of Medicine, 4444 Forest Park Blvd, St. Louis, MO 63108, USA.
Jeffrey R. O'Connell, Department of Medicine, University of Maryland School of Medicine, Baltimore, MD, USA
Quince Gibson, Department of Medicine, University of Maryland School of Medicine, Baltimore, MD, USA.
Kathleen A. Ryan, Department of Medicine, University of Maryland School of Medicine, Baltimore, MD, USA
Paul N. Hopkins, Department of Internal Medicine, University of Utah Health Sciences Center, Salt Lake City, UT, USA
Michael Y. Tsai, Department of Laboratory Medicine and Pathology, School of Medicine, University of Minnesota, Minneapolis, MN, USA
Chao-Qiang Lai, Nutrition and Genomics Laboratory, US Department of Agriculture Human Nutrition Research Center on Aging, Tufts University, Boston, MA, USA.
Michael A. Province, Department of Genetics Division of Statistical Genomics (campus box 8506), Washington University School of Medicine, 4444 Forest Park Blvd, St. Louis, MO 63108, USA
Jose M. Ordovas, Nutrition and Genomics Laboratory, US Department of Agriculture Human Nutrition Research Center on Aging, Tufts University, Boston, MA, USA; IMDEA-Alimentacion, Madrid, Spain, Department of Cardiovascular Epidemiology and Population Genetics, Centro Nacional de Investigacions Cardiovasculares, Madrid, Spain
Alan R Shuldiner, Department of Medicine, University of Maryland School of Medicine, Baltimore, MD, USA; Geriatric Research and Education Clinical Center, Baltimore Veterans Administration Medical Center, Baltimore, MD, USA.
Donna K. Arnett, Department of Epidemiology, School of Public Health, University of Alabama at Birmingham, Birmingham, AL, USA
Ingrid B. Borecki, Department of Genetics Division of Statistical Genomics (campus box 8506), Washington University School of Medicine, 4444 Forest Park Blvd, St. Louis, MO 63108, USA
References
- Abecasis GR, Cherny SS, Cookson WO, Cardon LR. GRR: graphical representation of relationship errors. Bioinformatics. 2001;17:742–743. doi: 10.1093/bioinformatics/17.8.742. [DOI] [PubMed] [Google Scholar]
- Agarwala R, Biesecker LG, Hopkins KA, Francomano CA, Schaffer AA. Software for constructing and verifying pedigrees within large genealogies and an application to the Old Order Amish of Lancaster County. Genome Res. 1998;8:211–221. doi: 10.1101/gr.8.3.211. [DOI] [PubMed] [Google Scholar]
- Agarwala R, Biesecker LG, Tomlin JF, Schäffer AA. Towards a complete North American Anabaptist genealogy: A systematic approach to merging partially overlapping genealogy resources. Am J Med Genet. 1999;86:156–161. doi: 10.1002/(sici)1096-8628(19990910)86:2<156::aid-ajmg13>3.0.co;2-5. [DOI] [PubMed] [Google Scholar]
- Agarwala R, Schaffer AA, Tomlin JF. Towards a complete North American Anabaptist Genealogy II: analysis of inbreeding. Hum Biol. 2001;73:533–545. doi: 10.1353/hub.2001.0045. [DOI] [PubMed] [Google Scholar]
- Almasy L, Blangero J. Multipoint quantitative-trait linkage analysis in general pedigrees. Am J Hum Genet. 1998;62:1198–1211. doi: 10.1086/301844. [DOI] [PMC free article] [PubMed] [Google Scholar]
- Aslibekyan S, An P, Frazier-Wood AC, Kabagambe EK, Irvin MR, Straka RJ, et al. Preliminary evidence of genetic determinants of adiponectin response to fenofibrate in the Genetics of Lipid Lowering Drugs and Diet Network. Nutr Metab Cardiovasc Dis. 2013;23:987–994. doi: 10.1016/j.numecd.2012.07.010. [DOI] [PMC free article] [PubMed] [Google Scholar]
- Ban HJ, Heo JY, Oh KS, Park KJ. Identification of type 2 diabetes-associated combination of SNPs using support vector machine. BMC Genet. 2010;11:26. doi: 10.1186/1471-2156-11-26. [DOI] [PMC free article] [PubMed] [Google Scholar]
- Beekman M, Heijmana BT, Martin NG, Pedersen NL, Whitfield JB, DeFaire U, et al. Heritabilities of apolipoprotein and lipid levels in three countries. Twin Research. 2002;5:87–97. doi: 10.1375/1369052022956. [DOI] [PubMed] [Google Scholar]
- Chung CM, Lin TH, Chen JW, Leu HB, Yang HC, Ho HY, et al. A genome-wide association study reveals a quantitative trait locus of adiponectin on CDH13 that predicts cardiometabolic outcomes. Diabetes. 2011;60:2417–2423. doi: 10.2337/db10-1321. [DOI] [PMC free article] [PubMed] [Google Scholar]
- Corbett J, Kraja A, Borecki IB, Province MA. Use of a random coefficient regression (RCR) model to estimate growth parameters. BMC Genet. 2003;4(Suppl 1):S5. doi: 10.1186/1471-2156-4-S1-S5. [DOI] [PMC free article] [PubMed] [Google Scholar]
- Corey KE, Lai M, Gelrud LG, Misdraji J, Barlow LL, Zheng H, et al. Non-high-density lipoprotein cholesterol as a biomarker for nonalcoholic steatohepatitis. Clinical Gastroenterology & Hepatology. 2012;10:651–656. doi: 10.1016/j.cgh.2012.01.017. [DOI] [PMC free article] [PubMed] [Google Scholar]
- Croteau-Chonka DC, Marvelle AF, Lange EM, Lee NR, Adair LS, Lange LA, et al. Genome-wide association study of anthropometric traits and evidence of interactions with age and study year in Filipino women. Obesity. 2011;19:1019–1027. doi: 10.1038/oby.2010.256. [DOI] [PMC free article] [PubMed] [Google Scholar]
- Emerging Risk Factors Collaboration (ERFC) Writing Committee. Major lipids, apolipoproteins, and risk of vascular disease. JAMA. 2009;302:1993–2000. doi: 10.1001/jama.2009.1619. [DOI] [PMC free article] [PubMed] [Google Scholar]
- Fava C, Danese E, Montagnana M, Sjögren M, Almgren M, Guidi GC, et al. A variant upstream of the CDH13 adiponectin receptor gene and metabolic syndrome in Swedes. Am J Cardiol. 2011;108:1432–1437. doi: 10.1016/j.amjcard.2011.06.068. [DOI] [PubMed] [Google Scholar]
- Feng S, Wang S, Chen CC, Lan L. GWAPower: a statistical power calculation software for genome-wide association studies with quantitative traits. BMC Genet. 2011;12:12. doi: 10.1186/1471-2156-12-12. [DOI] [PMC free article] [PubMed] [Google Scholar]
- Fox CS, Heard-Costa N, Cupples LA, Dupuis J, Vasan RS, Atwood LD. Genome-wide association to body mass index and waist circumference: the Framingham Heart Study 100K project. BMC Med Genet. 2007;8(Suppl 1):S18. doi: 10.1186/1471-2350-8-S1-S18. [DOI] [PMC free article] [PubMed] [Google Scholar]
- Gao X, Starmer J, Martin ER. A multiple testing correction method for genetic association studies using correlated single nucleotide polymorphisms. Genet Epidemiol. 2008;32:361–369. doi: 10.1002/gepi.20310. [DOI] [PubMed] [Google Scholar]
- Heath SC. Markov chain Monte Carlo segregation and linkage analysis for oligogenic models. Am J Hum Genet. 1997;61:748–760. doi: 10.1086/515506. [DOI] [PMC free article] [PubMed] [Google Scholar]
- Hedrick P, Kumar S. Mutations and linkage disequilibrium in human mtDNA. Eur J Hum Genet. 2001;9:969–972. doi: 10.1038/sj.ejhg.5200735. [DOI] [PubMed] [Google Scholar]
- Higgins M, Province M, Heiss G, Eckfeldt J, Ellison RC, Folsom AR, et al. NHLBI Family Heart Study: Objectives and Design. Am J Epidemiol. 1996;143:1219–1228. doi: 10.1093/oxfordjournals.aje.a008709. [DOI] [PubMed] [Google Scholar]
- Jee SH, Sull JW, Lee JE, Shin C, Park J, Kimm H, et al. Adiponectin concentration: a genome-wide association study. Am J Hum Genet. 2010;87:545–552. doi: 10.1016/j.ajhg.2010.09.004. [DOI] [PMC free article] [PubMed] [Google Scholar]
- Johansson A, Marroni F, Hayward C, Franklin CS, Kirichenko AV, Jonasson I, et al. Linkage and genome-wide association analysis of obesity-related phenotypes: association of weight with the MGAT1 gene. Obesity. 2010;18:803–808. doi: 10.1038/oby.2009.359. [DOI] [PubMed] [Google Scholar]
- Kabagambe EK, Ordovas JM, Tsai MY, Borecki IB, Hopkins PN, Glasser SP, et al. Smoking, inflammatory patterns and postprandial hypertriglyceridemia. Atherosclerosis. 2009;203:633–639. doi: 10.1016/j.atherosclerosis.2008.08.005. [DOI] [PMC free article] [PubMed] [Google Scholar]
- Kathiresan S, Manning AK, Demissie S, D'Agostino RB, Surti A, Guiducci C, et al. A genome-wide association study for blood lipid phenotypes in the Framingham Heart Study. BMC Med Genet. 2007;8(Suppl 1):S17. doi: 10.1186/1471-2350-8-S1-S17. [DOI] [PMC free article] [PubMed] [Google Scholar]
- Korn JM, Kuruvilla FG, McCarroll SA, Wysoker A, Nemesh J, Cawley S, et al. Integrated genotype calling and association analysis of SNPs, common copy number polymorphisms and rare CNVs. Nat Genet. 2008;40:1253–1260. doi: 10.1038/ng.237. [DOI] [PMC free article] [PubMed] [Google Scholar]
- Levy D, Larson MG, Benjamin EJ, Newton-Cheh C, Wang TJ, Hwang SJ, et al. Framingham Heart Study 100K Project: genome-wide associations for blood pressure and arterial stiffness. BMC Med Genet. 2007;8(Suppl 1):S3. doi: 10.1186/1471-2350-8-S1-S3. [DOI] [PMC free article] [PubMed] [Google Scholar]
- Li Y, Willer CJ, Ding J, Scheet P, Abecasis GR. MaCH: using sequence and genotype data to estimate haplotypes and unobserved genotypes. Genet Epidemiol. 2010;34:816–834. doi: 10.1002/gepi.20533. [DOI] [PMC free article] [PubMed] [Google Scholar]
- Li Y, Willer CJ, Sanna S, Abecasis GR. Genotype imputation. Annual Review of Genomics and Human Genetics. 2009;10:387–406. doi: 10.1146/annurev.genom.9.081307.164242. [DOI] [PMC free article] [PubMed] [Google Scholar]
- Ling H, Waterworth DM, Stirnadel HA, Pollin TI, Barter PJ, Kesäniemi YA, et al. Genome-wide linkage and association analyses to identify genes influencing adiponectin levels: the GEMS Study. Obesity. 2009;17:737–744. doi: 10.1038/oby.2008.625. [DOI] [PMC free article] [PubMed] [Google Scholar]
- Liu J, Sempos CT, Donahue RP, Dorn J, Trevisan M, Grundy SM. Non-high-density lipoprotein and very-low-density lipoprotein cholesterol and their risk predictive values in coronary heart disease. Am J Cardiol. 2006;98:1363–1368. doi: 10.1016/j.amjcard.2006.06.032. [DOI] [PubMed] [Google Scholar]
- Madsen KS, Miller JP, Province MA. The use of an extended baseline period in the evaluation of treatment in a longitudinal Duchenne muscular dystrophy trial. Stat Med. 1986;5:231–241. doi: 10.1002/sim.4780050304. [DOI] [PubMed] [Google Scholar]
- Mahajan N, Ference BA, Arora N, Madhavan R, Bhattacharya P, Sudhakar R, et al. Role of non-high-density lipoprotein cholesterol in predicting cerebrovascular events in patients following myocardial infarction. Am J Cardiol. 2012;109:1694–1699. doi: 10.1016/j.amjcard.2012.02.010. [DOI] [PubMed] [Google Scholar]
- Marroni F, Pinosio S, Zaina G, Fogolari F, Felice N, Cattonaro F, et al. Nucleotide diversity and linkage disequilibrium in Populus nigra cinnamyl alcohol dehydrogenase (CAD4) gene. Tree Genetics & Genomes. 2011;7:1011–1023. [Google Scholar]
- Miller M, Ginsberg HN, Schaefer EJ. Relative atherogenicity and predictive value of non high-density lipoprotein cholesterol for coronary heart disease. Am J Cardiol. 2008;101:1003–1008. doi: 10.1016/j.amjcard.2007.11.046. [DOI] [PubMed] [Google Scholar]
- Mitchell BD, McArdle PF, Shen H, Rampersaud E, Pollin TI, Bielak LF, et al. The genetic response to short term interventions affecting cardiovascular function: rationale and design of the Heredity and Phenotype Intervention (HAPI) Heart Study. Am Heart J. 2008;155:823–828. doi: 10.1016/j.ahj.2008.01.019. [DOI] [PMC free article] [PubMed] [Google Scholar]
- Muller JC. Linkage disequilibrium for different scales and applications. Brief Bioinform. 2004;5:355–364. doi: 10.1093/bib/5.4.355. [DOI] [PubMed] [Google Scholar]
- O'Connell JR. Optimizing measured genotype genome-wide association analysis for quantitative traits in pedigrees. American Society of Human Genetics 2009 [Google Scholar]
- Org E, Eyheramendy S, Juhanson P, Gieger C, Lichtner P, Klopp N, et al. Genome-wide scan identifies CDH13 as a novel susceptibility locus contributing to blood pressure determination in two European populations. Hum Mol Genet. 2009;18:2288–2296. doi: 10.1093/hmg/ddp135. [DOI] [PMC free article] [PubMed] [Google Scholar]
- Patsch JR, Miesenbock G, Hopferwieser T, Mühlberger V, Knapp E, Dunn JK, et al. Relation of triglyceride meyabolism and coronary artery disease. Studies in the postprandial state. Arterioscler Thromb. 1992;12:1336–1345. doi: 10.1161/01.atv.12.11.1336. [DOI] [PubMed] [Google Scholar]
- Price AL, Patterson NJ, Plenge RM, Weinblatt ME, Shadick NA, Reich D. Principal components analysis corrects for stratification in genome-wide association studies. Nat Genet. 2006;38:904–909. doi: 10.1038/ng1847. [DOI] [PubMed] [Google Scholar]
- Province MA. The significance of not finding a gene. Am J Hum Genet. 2001;69:660–663. doi: 10.1086/323316. [DOI] [PMC free article] [PubMed] [Google Scholar]
- Province MA, Borecki IB. A correlated meta-analysis strategy for data mining ‘omic’ scans. Pac Symp Biocomput. 2013:236–246. [PMC free article] [PubMed] [Google Scholar]
- Psychiatric GWAS Consortium Bipolar Disorder Working Group. Large-scale genome-wide association analysis of bipolar disorder identifies a new susceptibility locus near ODZ4. Nat Genet. 2011;43:977–983. doi: 10.1038/ng.943. [DOI] [PMC free article] [PubMed] [Google Scholar]
- Robinson JG. Are you targeting non-high-density lipoprotein cholesterol? J Am Coll Cardiol. 2009;55:42–44. doi: 10.1016/j.jacc.2009.07.056. [DOI] [PubMed] [Google Scholar]
- Robinson JG. Low high-density lipoprotein cholesterol and chronic disease risk marker or causal? J Am Coll Cardiol. 2010;55:2855–2857. doi: 10.1016/j.jacc.2010.01.053. [DOI] [PubMed] [Google Scholar]
- Shia WC, Ku TH, Tsao YM, Hsia CH, Chang YM, Huang CH, et al. Genetic copy number variants in myocardial infarction patients with hyperlipidemia. BMC Genomics. 2011;3(12 Suppl):S23. doi: 10.1186/1471-2164-12-S3-S23. [DOI] [PMC free article] [PubMed] [Google Scholar]
- Teslovich TM, Musunuru K, Smith AV, Edmondson AC, Stylianou IM, Koseki M, et al. Biological, clinical and population relevance of 95 loci for blood lipids. Nature. 2010;466:707–713. doi: 10.1038/nature09270. [DOI] [PMC free article] [PubMed] [Google Scholar]
- Wellcome Trust Case Control Consortium. Genome-wide association study of 14,000 cases of seven common diseases and 3,000 shared controls. Nature. 2007;447:661–678. doi: 10.1038/nature05911. [DOI] [PMC free article] [PubMed] [Google Scholar]
- Wojczynski MK, Gao G, Borecki IB, Hopkins PN, Parnell L, Lai CQ, et al. Apolipoprotein B genetic variants modify the response to fenofibrate: a GOLDN study. J Lipid Res. 2010;51:3316–3323. doi: 10.1194/jlr.P001834. [DOI] [PMC free article] [PubMed] [Google Scholar]
- Yang Q, Kathiresan S, Lin JP, Tofler GH, O'Donnell CJ. Genome-wide association and linkage analyses of hemostatic factors and hematological phenotypes in the Framingham Heart Study. BMC Med Genet. 2007;8(Suppl 1):S12. doi: 10.1186/1471-2350-8-S1-S12. [DOI] [PMC free article] [PubMed] [Google Scholar]