

ABSTRACT
The Tasmanian devil is under threat of extinction due to the transmissible devil facial tumor disease (DFTD). This fatal tumor is an allograft that does not induce an immune response, raising questions about the activity of Tasmanian devil immune cells. T and B cell analysis has been limited by a lack of antibodies, hence the need to produce such reagents. Amino acid sequence analysis revealed that CD4, CD8, IgM, and IgG were closely related to other marsupials. Monoclonal antibodies were produced against CD4, CD8, IgM, and IgG by generating bacterial fusion proteins. These, and commercial antibodies against CD1a and CD83, identified T cells, B cells and dendritic cells by immunohistochemistry. CD4+ and CD8+ T cells were identified in pouch young thymus, adult lymph nodes, spleen, bronchus‐ and gut‐associated lymphoid tissue. Their anatomical distribution was characteristic of mammalian lymphoid tissues with more CD4+ than CD8+ cells in lymph nodes and splenic white pulp. IgM+ and IgG+ B cells were identified in adult lymph nodes, spleen, bronchus‐associated lymphoid tissue and gut‐associated lymphoid tissue, with more IgM+ than IgG+ cells. Dendritic cells were identified in lymph node, spleen and skin. This distribution is consistent with eutherian mammals and other marsupials, indicating they have the immune cell subsets for an anti‐tumor immunity. Devil facial tumor disease tumors contained more CD8+ than CD4+ cells, but in low numbers. There were also low numbers of CD1a+ and MHC class II+ cells, but no CD83+ IgM+ or IgG+ B cells, consistent with poor immune cell infiltration. Anat Rec, 297:925–938, 2014. © 2014 The Authors. The Anatomical Record: Advances in Integrative Anatomy and Evolutionary Biology Published by Wiley Periodicals, Inc.
Keywords: devil facial tumour disease, immunohistochemistry, lymphocyte subsets, dendritic cells, marsupial immunology, monoclonal antibody development
Abbreviations used
- APC
antigen presenting cells
- BALT
bronchus‐associated lymphoid tissue
- CTVT
canine transmissible venereal tumor
- DFTD
devil facial tumour disease
- DPIPWE
Department of Primary Industries, Parks, Water and Environment (Tasmanian Government)
- GALT
gut‐associated lymphoid tissue
- Ig
immunoglobulin
- PCR
polymerase chain reaction.
INTRODUCTION
Devil facial tumor disease (DFTD) is a lethal transmissible cancer that is driving the Tasmanian devil (Sarcophilus harrisii) population to extinction. Since its discovery in 1996, the disease has spread rapidly through the population and threatens the survival of this endemic Tasmanian marsupial (Hawkins et al., 2006). Tasmanian devils were previously abundant in the wild, but since the emergence of DFTD there has been an overall population decline of 84% and local population declines of up to 97% (DPIPWE, 2012). A greater understanding of this tumor and how it is able to survive and transmit is vital for future interventions to preserve this species.
The tumor is an undifferentiated neoplasm of Schwann cell origin (Murchison et al., 2010). Lesions occur primarily around the face and neck and the tumors metastasize in 65% of cases (Loh et al., 2006a). After appearance of the first tumor, death usually occurs within six months due to metabolic starvation or complications due to metastases (Loh et al., 2006a). An unusual feature of DFTD is that it is transmitted as an allograft when Tasmanian devils bite each other (Pearse and Swift, 2006). This makes DFTD one of only two naturally occurring clonally‐derived transmissible tumors. The other is canine transmissible venereal tumor (CTVT), a sexually transmitted cell line found globally in dogs, believed to have arisen thousands of years ago (Murchison, 2008). A major difference between these tumors is their prognosis. The disease progression of CTVT has predictable phases of growth, stasis and finally regression as it succumbs to the host's anti‐tumor immune responses (reviewed by Mukaratirwa and Gruys, 2003). In contrast, DFTD results in the death of the host and there is no evidence of an effective immune response against the tumor. This has prompted research into the competency of the Tasmanian devil's immune system.
Our previous studies have indicated that the Tasmanian devil immune system has the fundamental structural and functional components for an effective adaptive immune response (Woods et al., 2007; Kreiss et al., 2009). The use of cross‐reactive antibodies against highly conserved antigens has enabled immunohistochemical investigation into Tasmanian devil immune cells. We have identified CD3+ T cells and CD79b+ B cells in Tasmanian devil lymphoid organs (Kreiss et al., 2009) and some tumor samples contained a scattering of CD3+ T cells (Loh et al., 2006b). We were also able to identify MHC class II+ antigen presenting cells (APC), incorporating dendritic cells and macrophages, which can process and present antigen to T cells (Kreiss et al., 2009).
T cells, B cells, and APC consist of phenotypically distinguishable subsets with specific functions in marsupial species (Bell, 1977; Duncan et al., 2012). In the Tasmanian devil the presence and localization of these subsets have not been determined. In mouse and human there are APC subset markers, particularly for dendritic cells, that are well conserved among species (Berchtold et al., 1999; Cisternas and Armati, 2000). Cross‐reactive antibodies for these markers have not yet been tested in the Tasmanian devil. Characterization of T cell and B cell subsets in the Tasmanian devil has been impeded by the lack of specific antibodies, in particular to CD4, CD8, IgM and IgG, which could help identify helper and cytotoxic T cells and Ig classes produced by B cells, respectively.
In this study our aim was to analyze the presence and location of dendritic cells, CD4+ and CD8+ T cells and IgM+ and IgG+ B cells, in both healthy and DFTD‐affected animals. To achieve this, we produced antibodies specific for Tasmanian devil CD4, CD8α, IgM, and IgG and used them in immunohistochemistry to characterize the presence of B cells and two major T cell subsets in lymphoid tissue and DFTD tumors. We also utilized cross‐reactive antibodies to identify subsets of APC.
Using these reagents, we describe for the first time the distribution of CD4+ and CD8+ T cells, IgM and IgG B cells and dendritic cells in Tasmanian devil lymphoid organs. Analysis of DFTD tumors revealed a poor infiltration by T cells and dendritic cells, which may in part explain why the animals are unable to reject what is essentially a foreign tissue.
MATERIALS AND METHODS
Animal Samples
Tissue samples were collected from road‐killed or severely injured (and therefore euthanized) wild non‐diseased Tasmanian devils, eastern quolls (Dasyurus viverrinus), spotted‐tail quolls (Dasyurus maculatus) and wombats (Vombatus ursinus). Non‐diseased Tasmanian devil tissue was also sourced from the Department of Primary Industries, Parks, Water and Environment (DPIPWE) from captive animals that had died. Tasmanian devils were considered non‐diseased following a thorough autopsy. All samples were taken from adult animals, except for thymuses, which were collected from the pouch young of a euthanized diseased mother. Permission to collect samples for scientific purposes from threatened fauna was given by DPIPWE (permit number: TFA 08088). Samples from DFTD‐affected Tasmanian devils were taken when diseased animals were removed from the wild and euthanized. Brushtail possum (Trichosurus vulpecula), eastern bettong (Bettongia gaimard), koala (Phascolarctos cinereus), red kangaroo (Macropus rufus) and ringtail possum (Pseudocheirus peregrinus) tissues were opportunistically collected and kindly donated by the Taronga Conservation Society. Australia. Opossum (Monodelphis domestica) tissue samples were obtained from captive animals at autopsy and kindly donated by The University of Melbourne. All samples were fixed in either RNAlater (Qiagen, Valencia, CA) or 10% buffered formalin.
Identification of IgM, IgG, CD4, and CD8α Genes
cDNA sequences encoding the constant regions of the heavy chains of IgM (Cμ) and IgG (Cγ) were obtained by searching the incomplete Tasmanian devil genome and transcriptomes of spleen and lymph node for sequences encoding proteins highly homologous to mouse, wallaby and possum Cμ and Cγ.
Sequences for CD4, CD8α and CD8β in the Tasmanian devil were obtained by aligning the tammar wallaby (Macropus eugenii) sequences (Wong et al., 2011) to the Tasmanian devil genome sequence (Murchison et al., 2012) using BLAST (Altschul et al., 1997). The exons/introns of the Tasmanian devil genes were identified by local alignment with tammar wallaby genes using the EMBOSS Matcher software. Sequence alignments were produced in BioEdit using the ClustalW tool (Thompson et al., 1994; Hall, 1999). The full‐length sequence was obtained for CD4 and CD8β. Only a partial sequence was identified for CD8α due to missing sequences in the genome. Full CD8α sequence length was obtained by RACE‐PCR. The CD4 and CD8 sequences have been deposited in Genbank under the following accession numbers; devil CD4: KF640217 and devil cd8 alpha: KF640218
RACE‐PCR for CD8α
Tasmanian devil mononuclear cells were isolated using density gradient centrifugation over Histopaque‐1077 (Sigma‐Aldrich, NSW, Australia) and RNA extracted from these cells using RNeasy micro kit (QIAGEN). RNA quality was checked using the Agilent Bioanalyzer. RACE‐ready cDNA was produced using Generacer kit with Superscript III (Invitrogen, CA) following the manufacturer's instructions. A reverse CD8α primer was designed using Oligo 6 and the partial CD8α sequence (Table 1). The 50 μL RACE‐PCR reaction contained 50 ng RACE‐ready DNA, 1× High Fidelity PCR Buffer (Invitrogen), 200 µM dNTP (Sigma‐Aldrich), 10 pM of CD8α primer (5′‐TGGTGGTGGTCAGCAGAGTGGTAGT‐3′) (Sigma‐Aldrich), 5 pM of 5′ RACE primer (Invitrogen) 1 U of Platinum Taq DNA Polymerase High Fidelity (Invitrogen) and 2 mM MgSO4 (Invitrogen). PCR cycling parameters were 94°C for 2 min, five cycles of 94°C for 30 sec and 72°C for 1 min, five cycles of 94°C for 30 sec and 70°C for 1 min, 30 cycles of 94°C for 30 sec, 64°C for 30 sec and 68°C for 1 min, with a final extension step at 68°C for 10 min. Samples were run on 2% agarose gel and bands excised. Bands were purified using the QIAquick Gel Extraction kit (QIAGEN) and cloned into plasmids using the pGEM®‐T Easy vector system (Promega, Madison, WI). Plasmids were transformed into JM109 Escherichia coli bacterial cells (Promega) and clones were individually picked and cultured overnight at 37°C. Plasmids were purified using the QIAprep Minispin Kit (QIAGEN). The plasmid DNA was sequenced at the Australian Genome Research Facility (AGRF, Westmead, NSW). Sequences were edited and quality checked using Sequencher 4.1.4 (Gene Codes Corp., Ann Arbor, MI).
Table 1. Primers used for cloning and protein expression.
| Primer | Use | Primer sequence 5′ to 3′ |
|---|---|---|
| CD4 | C | Forward: ATGGATGGAGGAACTTCC Reverse: CTAAAAATGATGGGGACACT |
| CD8α | C | Forward: AAAGATGGACTCCAGCTC Reverse: TTAAACATATCTCTCTGGTG |
| CD4 | P | Forward: gggatccCTTATTATTATGAGGGGCTTCAG Reverse: gggaaTTCAAAGTTTTCTTGTCTTGACTCAGG |
| CD8α | P | Forward: gggatccCAGCCCTTCGGGTCCCAAGCGCAG Reverse: ggaattCTGAAGTCCTTCACGGTCAGGCGG |
| Cμ | C and P | Forward: gggaTCCTGTGGGAGTTCTCAAACAG Reverse:gggaattCACTGAAACAGGTTGAGGAAAC |
| Cγ | C and P | Forward: gggatccGTCTTTCCCCTGGCACCCAACTG Reverse: ggaattcGAGATTGTCCTCTGGGAATATTGG |
Lower case indicates linker sequences appended to devil coding sequences (upper case).
C, cloning; P, protein expression.
IgM, IgG, CD4, and CD8α cDNA Cloning
Tasmanian devil spleen RNA was extracted using the RNeasy kit (QIAGEN) and quality checked using 1% agarose gel electrophoresis. The RNA was transcribed to cDNA using Superscript III following the manufacturer's instructions (Invitrogen). Primers for Cμ, Cγ, CD4, and CD8α were designed to amplify transcripts (Table 1). PCR reactions contained 50 ng cDNA, 1× High Fidelity PCR Buffer (Invitrogen), 200 µM dNTP (Sigma‐Aldrich, NSW, Australia), 10 pM of each primer (Sigma‐Aldrich), 1 U of Platinum Taq DNA Polymerase High Fidelity (Invitrogen) and 2 mM MgSO4 (Invitrogen) in a volume of 25 μL. PCR cycling parameters were: 94°C for 2 min, 32 cycles of 94°C for 30 sec, 60°C for 30 sec then 68°C for 1 min with a final extension step at 68°C for 10 min. Samples were cloned into plasmids using the pGEM®‐T Easy vector system (Promega) for sequence verification. Plasmids were transformed into JM109 E. coli bacterial cells (Promega) and clones were individually selected and cultured overnight at 37°C. Plasmids were purified using the QIAprep Minispin Kit (QIAGEN).
Production of Monoclonal Antibodies (mAbs)
Using virtual translation of the cDNA sequences encoding Tasmanian devil Cμ, Cγ, CD4, and CD8α, we identified regions of the proteins that were predicted to be extracellular, antigenic and hydrophilic (using the Protean tool of the DNASTAR suite of applications). These protein domains were chosen to generate bacterial fusion proteins for immunization and screening. For CD4, DNA sequence encoding aa 59 to 169 of the full‐length 467 aa predicted protein, and for CD8α, sequence encoding aa 19 to 113 of the predicted 243 aa proteins were selected to generate antigens. The cDNA sequences for each was amplified using primers described in Table 1, and cloned into two different bacterial expression vectors, pPROEX HTb (Life Technologies) and pGex‐KT (Hakes and Dixon, 1992), such that two recombinant fusion proteins (linked to hexa‐His and glutathione‐S‐transferase (GST) tags, respectively) were prepared for each antigen. As the Tasmanian devil genome is incomplete and not yet fully annotated, the antigen protein sequences were incorporated into the bacterial fusion proteins (for amino acid sequence see Table 2).
Table 2. Antigen peptide sequences used for antibody production.
| Antigen | Amino acid sequence used in immunization |
|---|---|
| IgM | SCGSSQTEDASFAVGCLAKNFLPDSINFSWNYQNRTAVSNTDLKVFPSLMIGSTYTATSQVILPANDVFQGQDSYLVCKTRHLKGEKEIKVPLPDRTINSPNVTVYIPPDAFSSSSLRKSKLICQATNFRPSRITLTWLREGRPVLSGFSPSQALPDGSGNYFLQSTLTISENDWLSQSTFTCRVDHEGNRIQKNVSSTCFSEF |
| IgG | GAISSGIQIYPSVLQSSGLYTLSSQLTVPADTWPSQSYICNVVHKATSTKINKKIEGPSSTPKPTECTCCKCSACDVGGLSVFIFPPNPKDTLKLSGSPKITCMVVDVSDASDVKIAWFKNNKEIDSPKPTQKEQNNGTIQVISTLSVVHQEWLKGTVYTCKVDTKELPFPETRTISHTSGDRKMPDMYVFAPHPDELKHKDTVSLTCFVKNFFPQDIVVEWQCNDHPEPEENYYTTPAMKEKDTFFVYSKLTLNKAKWQENNSYTCMVLHEGFPNQYSQRTIS |
| CD4 | LIIMRGFRKSSPPRVIGKTKMKDRVDSSTNEWDSGNFSLIIKKLEIADSGSYFCEVENRKQEVQLLVFKLTANPNDYIFSGKNMTLTLHSPSSLPGFKVEWNGPGDKSKRI |
| CD8α | GSQPFGSQAQPGFRMSPAEKRDVRPSEQVRLQCEALSASNTGCSWLRQSPGALTPTFLLYISGGTSSVKLAEGLDATKFAGERVSPSIYRLTVKDFRI |
Each fusion protein was then affinity purified using nickel‐ or glutathione‐coupled resins, as appropriate. One fusion protein was used as an immunogen and the other as a screening reagent for each antigen. This strategy ensured that only antibodies directed at the Tasmanian devil‐derived sequences, which are the only common elements of each pair of fusion proteins, were selected in the screening step. Antibody‐secreting hybridomas were produced from spleens of immunized mice (Monoclonal Antibody Facility, WEHI) and the supernatants screened by ELISA. The most promising hybridomas were cloned, and cell lines obtained that secreted pure mouse anti‐Tasmanian devil antibodies. These mAbs were screened using western blot (Fig. 1) and immunohistochemistry on secondary lymphoid tissues from Tasmanian devils to confirm specificity and reactivity. Two independent anti‐IgM clones (3A2 and 8B6), two anti‐IgG clones (1G7 and 9H3), two anti‐CD4 clones (5F7 and 8C9) and one mAb for CD8α (clone 10E8) were obtained. The mAbs were either IgG1 or IgG2a isotypes.
Figure 1.
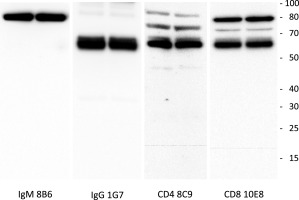
Western blot of anti‐IgM, IgG, CD4 and CD8 antibodies against devil protein extracted from devil lymph node lymphocytes. Some non‐specific staining at high molecular weight occurred with antibodies to CD4 and CD8. Scale bar (molecular weight) at the right of panel is in kDa.
Western Blot
Total protein (30 µg) extracted from Tasmanian devil lymph node was separated using gel electrophoresis and transferred onto to nitrocellulose membrane for immune detection using custom antibodies against IgM (clone 8B6), IgG (clone 1G7), CD4 (clone 8C9) and CD8 (clone 10E8). Signal was detected using a chemiluminescence substrate and images taken with a digital camera.
Immunohistochemistry
Tissue samples were embedded in paraffin wax. The tissues were sectioned (3 μm) onto 3‐aminotriethoxysilane (Sigma‐Aldrich) coated slides. Sections were deparaffinized by placing in a histology oven at 60°C for 15 min. Slides were incubated for 5 min (twice) in xylene followed by rehydration in successive grades of ethanol (100%, 95%, 70%) and washed for 5 min in water. Slides were placed in target retrieval solution (Dako, Carpinteria, CA) and heated in an electric pressure cooker (Russell Hobbs RHNHP401) on medium for 20 min. Slides were cooled to 35°C and endogenous peroxidase activity quenched by incubating in 3% H2O2 for 10 min. Slides were then incubated with serum‐free blocking solution (Dako) for 15 min. Primary antibodies were diluted to the required concentration with antibody diluent (Dako) and placed on slides for 1 hr (for antibody details see Table 3). The primary antibody was detected using anti‐mouse or ‐rabbit EnVision System, HRP (Dako) or LSAB+ System‐HRP (Dako) according to manufacturer's instructions. Liquid DAB+ Substrate Chromogen System (Dako) was then added to each slide and incubated for 10 min. The samples were counterstained with hematoxylin and mounted. Isotype controls underwent the same protocol except the primary antibody was replaced with a control antibody with the same isotype at the same concentration.
Table 3. List of antibodies used for immunohistochemistry.
| Antibody | Species | Dilution for IHC | Manufacturer/catalogue number |
|---|---|---|---|
| Anti‐human CD1a | Mouse IgG1 | 1:50 | Dako/M3571 |
| Anti‐human CD3 | Rabbit polyclonal | 1:200 | Dako/A0452 |
| Anti‐TD CD4 | Mouse IgG1 | 1:25 | WEHI |
| Anti‐TD CD8 | Mouse IgG1 | 1:10 | WEHI |
| Anti‐human CD83 | Mouse IgG | 1:80 | Serotec/MCA1582 |
| Anti‐human HLA‐DR, alpha‐chain | Mouse IgG1 | 1:50 | Dako/M0746 |
| Anti‐TD IgG | Mouse IgG2a | 1:1,000 | WEHI |
| Anti‐TD IgM | Mouse IgG2a | 1:1,000 | WEHI |
IHC, immunohistochemistry; TD, Tasmanian devil; WEHI, Walter and Eliza Hall Institute of Medical Research.
Cell Counts and Ratios
Tissues from lymph nodes and spleens from five DFTD and five non‐diseased animals were labeled with T cell markers. To ensure that equal areas for each animal were evaluated, five representative areas of each tissue region (cortex, paracortex, and medulla of lymph node and red and white pulp of spleen) were imaged at 630× magnification using Leica Application Suite V3 software (Leica Microsystems). The number of positive cells in each image was counted manually. The average for each of the five representative areas per animal was then calculated. The average ± standard deviation was calculated for the five diseased and non‐diseased animals. The averages were used to determine a cell ratio. Statistical significance was calculated using Student paired two‐tailed t test.
RESULTS
Comparison of Tasmanian Devil Amino Acid Sequence to Eutherian and Marsupial Sequences
Using the MegAlign alignment tool and the Lipman‐Pearson method, the predicted Tasmanian devil protein sequence obtained for Cμα (453 aa) and Cγ(274 aa) shared 81.7% and 67% aa identity, respectively with tammar wallaby. This sequence identity was reduced when comparing Cμ with eutherian proteins, with the Tasmanian devil sharing 55.3% aa identity with humans. When comparing Cγ, the sequence identity was reduced with the constant region of Tasmanian devil IgG sharing ∼33% to 47% aa identity with humans, with IgG1 being the most similar.
The CD4 (443 aa) and CD8 (224 aa) proteins shared 70.8% and 68.8% aa identity respectively with the tammar wallaby. This sequence identity was greatly reduced when comparing to eutherian proteins, with the Tasmanian devil sharing only 39.2% and 45.5% aa identity with humans. This knowledge of the Tasmanian devil IgM, IgG, CD4 and CD8α sequences made it possible to produce immunogenic peptides for the development of specific antibodies.
Identification of T Cell Subsets in Lymphoid Organs in Non‐diseased Animals
We have previously identified T cells in the Tasmanian devil (Kreiss et al., 2009). To determine the distribution of T cell subsets in healthy Tasmanian devils, sections of lymphoid organs were labeled using immunohistochemistry with antibodies against CD3, CD4, and CD8.
Thymus
Tasmanian devil pouch young thymus samples (n = 3) showed cells positive for T cell markers, which were more densely populated in the cortex than the medulla. Cells positive for CD3 were dense at the boundary of the cortex near the medulla and sparse in the outer cortex and medulla (Fig. 2A). Cells positive for CD4 were densely distributed across the cortex (Fig. 2B). Cells positive for CD8α were sparsely distributed across the cortex (Fig. 2C).
Figure 2.
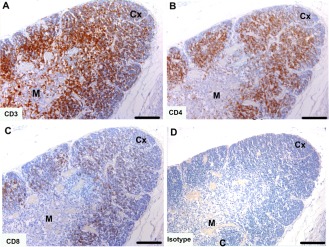
Immunohistochemical labeling with T cell subset markers in Tasmanian devil thymus. (A) anti‐CD3, (B) anti‐CD4 (C) anti‐CD8 and (D) isotype control. CD4+ T cells appear to be more prevalent than CD8+ T cells. Cx, cortex; M, medulla. Scale bar represents 100 μm.
Lymph node
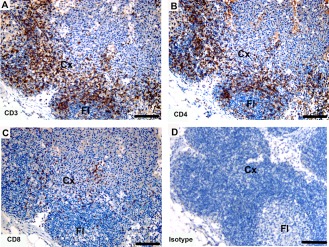
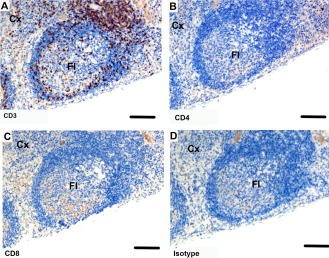
Tasmanian devil lymph node samples (n = 10) showed cells positive for T cell markers, which were primarily located in the cortex (CD3 = 217 ± 42 per high power field) and paracortex (CD3 = 301 ± 154 per high power field) with a small number of positive cells in the germinal center (CD3 = 49 ± 16 per high power field). There was a higher number of CD4+ cells compared with CD8+ cells with CD4:CD8 ratios of 3.3, 2.8, and 1.4 for cortex, paracortex and medulla respectively (Fig. 3 and Table 4).
Figure 3.
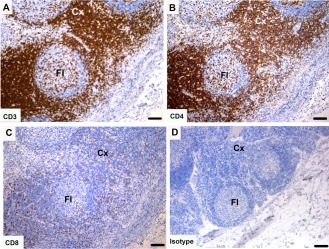
Immunohistochemical labeling with T cell subset markers in Tasmanian devil lymph node. (A) anti‐CD3, (B) anti‐CD4, (C) anti‐CD8 and (D) isotype control. T cells were predominantly identified in the cortex. CD4+ T cells appear to be more prevalent than CD8+ T cells. Cx, cortex; Fl, follicle. Scale bar represents 100 μm.
Table 4. T‐cell subtype counts in lymphoid tissue of non‐diseased versus devil facial tumor‐diseased animals.
| Lymph node cortex | Lymph node paracortex | Lymph node medulla | Spleen red pulp | Spleen white pulp | ||||||
|---|---|---|---|---|---|---|---|---|---|---|
| ND (n = 5) | DFTD (n = 5) | ND (n = 5) | DFTD (n = 5) | ND (n = 5) | DFTD (n = 5) | ND (n = 5) | DFTD (n = 5) | ND (n = 5) | DFTD (n = 5) | |
| Cell count | ||||||||||
| CD3 | 217 ± 42 | 216 ± 58 | 301 ± 154 | 327 ± 68 | 49 ± 16 | 49 ± 9 | 26 ± 12 | 14 ± 4 | 264 ± 108 | 245 ± 41 |
| CD4 | 206 ± 23 | 160 ± 77 | 249 ± 125 | 293 ± 75 | 38 ± 15 | 23 ± 12 | 3 ± 2 | 1 ± 1 | 193 ± 79 | 232 ± 75 |
| CD8 | 63 ± 21 | 36 ± 22* | 90 ± 35 | 91 ± 30 | 27 ± 11 | 20 ± 3 | 9 ± 6 | 13 ± 8 | 73 ± 53 | 101 ± 46 |
| Ratio | ||||||||||
| CD4:CD8 | 3.3 | 4.4 | 2.8 | 3.2 | 1.4 | 1.2 | 0.3 | 0.1 | 2.6 | 2.3 |
Cell count values represent the average number of cells per field of view (×630) ± standard deviation.
*Indicates significant (P < 0.05) difference compared with nondiseased animals.
n, number of animals; ND, non‐diseased animals; DFTD, devil facial tumor‐diseased animals.
Spleen
Tasmanian devil spleen samples (n = 10) showed dense aggregates of cells positive for T cell markers in the white pulp areas of the spleen (CD3 = 264 ± 108; Table 4), such as the periarterial lymphoid sheaths and splenic nodules (Fig. 4). In the white pulp there was a higher number of CD4+ cells, compared with CD8+ cells with a CD4:CD8 ratio of 2.6. The red pulp had a sparse distribution of positive cells and there was a higher number of CD8+ cells compared with CD4+ cells with a CD4:CD8 ratio of 0.3 (Fig. 4 and Table 4).
Figure 4.
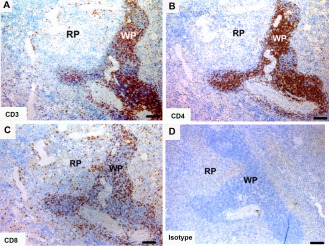
Immunohistochemical labeling with T cell subset markers in Tasmanian devil spleen. (A) anti‐CD3, (B) anti‐CD4, (C) anti‐CD8 and (D) isotype control. T cells were predominantly identified in the white pulp. CD4+ T cells appeared to be more prevalent than CD8+ T cells. RP, red pulp; WP, white pulp. Scale bar represents 100 μm.
BALT
Tasmanian devil lung samples (n = 2) showed cells positive for the T cell markers in BALT (Fig. 5). Both CD4+ cells and CD8+ cells were present.
Figure 5.
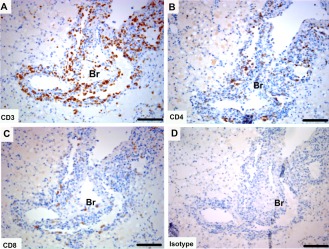
Immunohistochemical labeling with T cell subset markers in Tasmanian devil bronchus‐associated lymphoid tissue. (A) anti‐CD3, (B) anti‐CD4 (C), anti‐CD8 and (D) isotype control. Br, bronchus. Scale bar represents 100 μm.
GALT
Tasmanian devil small intestine samples (n = 3) showed cells positive for the T cell markers surrounding, and within, the lymphoid follicles of the GALT (Fig. 6). Cells positive for CD3 and CD8 were also located in the epithelia and lamina propria of the villi.
Figure 6.
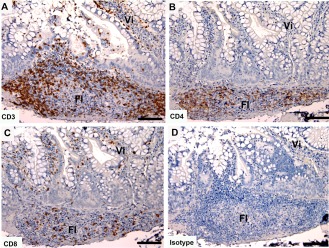
Immunohistochemical labeling with T cell subset markers in Tasmanian devil gut associated lymphoid tissue. (A) anti‐CD3, (B) anti‐CD4, (C) anti‐CD8 and (D) isotype control. Fl, follicle; Vi, villus. Scale bar represents 100 μm.
T Cell Subtype Cell Counts in Secondary Lymphoid Tissues in DFTD‐Affected Versus Nondiseased Animals
T cell marker counts for spleen and lymph node of DFTD‐affected (n = 5) and non‐diseased (n = 5) Tasmanian devils are presented in Table 4. The only significant difference between DFTD‐affected and non‐diseased groups was a lower number of CD8+ cells in the lymph node cortex in DFTD‐affected animals. The ratios showed that the proportion of CD4+ cells compared to CD8+ cells was greater in the cortex, paracortex, and medulla of the lymph node in both diseased and non‐diseased groups. In the spleen the white pulp had a greater number of CD4+ cells, however, the red pulp was the only lymphoid tissue region where CD8+ cells were greater than CD4+ cells.
Identification of B Cell Subtypes in Lymphoid Organs
We have previously identified B cells in the Tasmanian devil (Kreiss et al., 2009). To determine the distribution of B cells expressing switched immunoglobulin isotypes in the Tasmanian devil, sections of lymphoid organs were labeled using immunohistochemistry with antibodies against CD79b, IgM, and IgG.
Lymph node
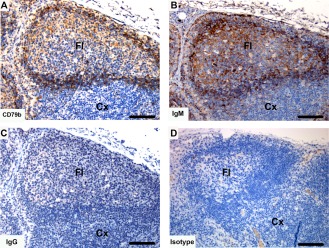
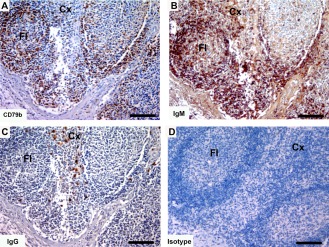
Tasmanian devil lymph node samples (n = 10) showed cells positive for B cell markers, which were primarily located in the cortex in association with the follicles (Fig. 7). Both CD79b and IgM shared a similar distribution, with a large number of positive cells in primary follicles and in the mantle zone and strong cytoplasmic labeling of cells within germinal center of secondary follicles. Cells positive for IgG were comparatively lower in number with high cytoplasmic labeling of cells located within the germinal centers of secondary follicles.
Figure 7.
Immunohistochemical labeling with B cell subset markers in Tasmanian devil lymph node. (A) anti‐CD79b, (B) anti‐devil IgM, (C) anti‐devil IgG and (D) isotype control. B cells were predominantly identified in the follicles. IgM+ cells appeared to be more prevalent than IgG+ cells. Cx, cortex; Fl, follicle. Scale bar represents 100 μm.
Spleen
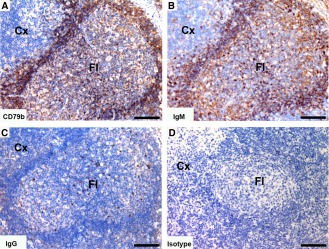
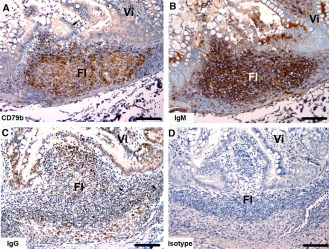
Tasmanian devil spleen samples (n = 10) showed dense distribution of cells positive for the B cell markers in the white pulp areas of the spleen (Fig. 8). In the white pulp the CD79b+ and IgM+ cells were densely distributed and IgG+ cells were sparsely distributed. In the red pulp there was a sparse distribution of all B cell subtypes.
Figure 8.
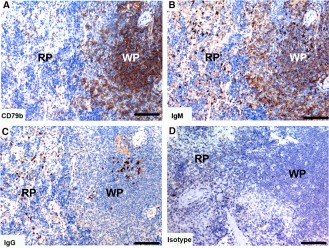
Immunohistochemical labeling with B cell subset markers in Tasmanian devil spleen. (A) anti‐CD79b, (B) anti‐devil IgM, (C) anti‐devil IgG and (D) isotype control. B cells were predominantly identified in the white pulp. IgM+ cells appeared to be more prevalent than IgG+ cells. RP, red pulp; WP, white pulp. Scale bar represents 100 μm.
BALT
Tasmanian devil lung samples (n = 2) showed cells positive for the B cell markers in BALT (Fig. 9). There was a sparse distribution of CD79b+, IgM+, and IgG+ cells. Both the IgM and IgG antibody showed background labeling of the lung connective tissue.
Figure 9.
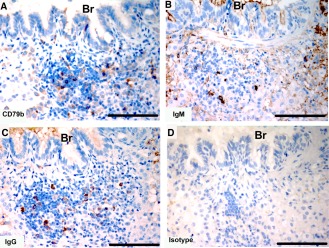
Immunohistochemical labeling with B cell subset markers in Tasmanian devil bronchus‐associated lymphoid tissue. (A) anti‐CD79b, (B) anti‐devil IgM, (C) anti‐devil IgG and (D) isotype control. Br, bronchus. Scale bar represents 100 μm.
GALT
Tasmanian devil small intestine samples (n = 3) showed cells positive for the B cell markers within the lymphoid follicles of the GALT (Fig. 10). The CD79b+ and IgM+ cells were densely distributed and the IgG+ cells sparsely distributed. For both IgG and IgM labeled tissues, there was a considerable level of background labeling that was not present in the isotype control (Fig. 10B,C). Both the IgM and IgG antibody showed background labeling of the small intestine connective tissue.
Figure 10.
Immunohistochemical labeling with B cell subset markers in Tasmanian devil gut‐associated lymphoid tissue. (A) anti‐CD79b, (B) anti‐devil IgM, (C) anti‐devil IgG and (D) isotype control. Fl, follicle; Vi villus. Scale bar represents 100 μm.
Identification of Dendritic Cells in Lymphoid Organs and Skin
To determine the presence and distribution of dendritic cells, sections of lymph node, spleen, and skin, where dendritic cells are expected to reside, were labeled by immunohistochemistry with MHC class II, the dendritic cell marker CD1a and the activated dendritic cell marker CD83.
Lymph node
Tasmanian devil lymph node samples (n = 4) showed cells positive for dendritic cell markers primarily in the paracortex and cortex (Fig. 11). The CD1a+ cells were mainly in the paracortex (Fig. 11B). Cells positive for CD83 were in the paracortical and cortical regions (Fig. 11C).
Figure 11.
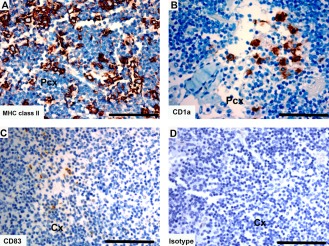
Immunohistochemical labeling with dendritic cell markers in Tasmanian devil lymph node. (A) anti‐HLA‐DR (MHC class II), (B) anti‐CD1a (C) anti‐CD83 and (D) isotype control. Cx, cortex; Pcx, paracortex. Scale bar represents 100 μm.
Spleen
Tasmanian devil spleen samples (n = 2) showed cells positive for dendritic cell markers in both the red and white pulp of the spleen (Fig. 12). The CD1a+ cells were sparsely distributed throughout the spleen in both the red and white pulp (Fig. 12B). Cells positive for CD83 were observed at a higher proportion to CD1a cells, and were located primarily in the red pulp region of the spleen (Fig. 12B,C).
Figure 12.
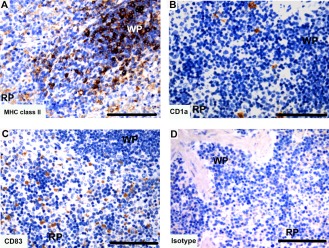
Immunohistochemical labeling with dendritic cell markers in Tasmanian devil spleen. (A) anti‐HLA‐DR (MHC class II), (B) anti‐CD1a, (C) anti‐CD83 and (D) isotype control. RP, red pulp; WP, white pulp. Scale bar represents 100 μm.
Skin
Tasmanian devil skin samples (n = 3) showed MHC class II+ cells in the epidermis and dermis of Tasmanian devil skin (Fig. 13A). Cells positive for CD1a were also scattered throughout the epidermis (Fig. 13B). There were no CD83+ cells in the skin samples examined (Fig. 13C).
Figure 13.
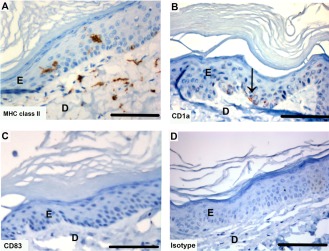
Immunohistochemical labeling with dendritic cell markers in Tasmanian devil skin. (A) anti‐HLA‐DR (MHC class II), (B) anti‐CD1a (arrow indicates positive cell), (C) anti‐CD83 (no positive cells) and (D) isotype control. E, epidermis; D, dermis. Scale bar represents 100 μm.
Identification of Dendritic Cells and T Cell Subsets in Devil Facial Tumor Samples
To determine the presence and distribution of dendritic cells, T cell subsets and B cell subsets in devil facial tumor, sections of tumor (n = 10) were labeled by immunohistochemistry with T cell markers CD3, CD4 and CD8, B cell markers CD79b, IgM, and IgG and DC markers MHC class II, CD1a and CD83. To distinguish tumor from stroma, sections were also labeled with periaxin, a marker of devil facial tumor tissue (Tovar et al., 2011).
None of the Tasmanian devil facial tumor samples examined had cells positive for B cell markers (data not shown). Cells positive for CD3, CD4, or CD8 were in all tumor samples. Cells were labeled in both stromal and tumor cell regions. In all samples, CD8+ cells could be easily identified in the stroma whereas CD4+ cells were not always present (Fig. 14). Eight samples contained cells positive for T cell markers within the tumor tissue. Of these eight samples, all contained intra‐tumoral CD3+ and CD8+ cells, but only three contained intra‐tumoral CD4+ cells.
Figure 14.

Immunohistochemical labeling with T cell markers in Tasmanian devil DFTD tumors. (A) anti‐periaxin (DFTD tumor cell marker), (B) anti‐CD3, (C) anti‐CD4 (no positive cells), (D) anti‐CD8. The isotype control is shown in figure 15. S, stroma; T, tumor. Scale bar represents 100 μm.
Cells positive for MHC class II were present in all tumor sections, with the majority of positive cells located within the tumor tissue (Fig. 15). Cells positive for CD1a were observed in the stroma of the tumor samples that were directly below the skin (Fig. 15). Deeper sections of tumor did not have CD1a+ cells. Cells positive for CD83 were not detected in any tumor sections (data not shown).
Figure 15.
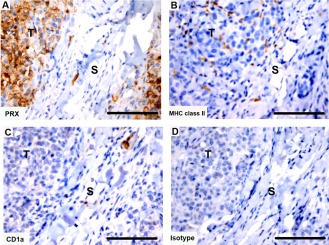
Immunohistochemical labeling with dendritic cell markers in Tasmanian devil DFTD tumors. (A) anti‐periaxin (DFTD tumor cell marker), (B) anti‐HLA‐DR (MHC class II), (C) anti‐CD1a and (D) isotype control. S, stroma; T, tumor. Scale bar represents 100 μm.
Tasmanian Devil‐Specific Antibody Cross‐Reactivity in Other Marsupial Species
To determine if the Tasmanian devil anti‐CD4, anti‐CD8, anti‐IgM, and anti‐IgG antibodies reacted with T cell and B cell subsets in other marsupials, they were tested by immunohistochemistry using peripheral lymph node sections from various marsupials. The marsupials tested were: brushtail possum, eastern bettong, eastern quoll, koala, opossum, red kangaroo, ringtail possum, spotted‐tail quoll, and wombat.
The anti‐CD3 antibody was used as a T cell control and anti‐CD79b as a B cell control, as they are established immune cell markers in marsupials (Jones et al., 1993; Hemsley et al., 1995). The results are summarized in Table 5 and representative immunohistochemistries are shown in Figs. 16 to 19. Anti‐IgM reacted against cells from all the marsupials tested whereas anti‐IgG, anti‐CD4 and anti‐CD8 only reacted against cells from the spotted‐tail quoll and the eastern quoll.
Table 5. Tasmanian devil antibodies cross‐reactivity with other marsupial species.
| Marsupial species | Anti‐CD4 | Anti‐CD8 | Anti‐IgM | Anti‐IgG |
|---|---|---|---|---|
| Brushtail possum | − | − | + | − |
| Eastern bettong | − | − | + | − |
| Eastern quoll | + | + | + | + |
| Koala | − | − | + | − |
| Opossum | − | − | + | − |
| Red kangaroo | − | − | + | − |
| Ringtail possum | − | − | + | − |
| Spotted‐tail quoll | + | + | + | + |
| Wombat | − | − | + | − |
All antibodies were tested by immunohistochemistry on lymph node sections.
+ indicates labeling with antibody, − indicates no labeling.
Figure 16.
Immunohistochemical labeling with T cell subset markers in eastern quoll lymph node. (A) anti‐CD3, (B) anti‐devil CD4, (C) anti‐devil CD8 and (D) isotype control. Cross species reactivity is shown for all three antibodies. Cx, cortex; Fl, follicle. Scale bar represents 100 μm.
Figure 19.
Immunohistochemical labeling with B cell subset markers in brushtail possum lymph node. (A) anti‐CD79b, (B) anti‐devil IgM and (C) anti‐devil IgG and (D) isotype control. Cross species reactivity is shown for all three antibodies. Cx, cortex; Fl, follicle. Scale bar represents 100 μm.
The majority of CD4+ and CD8+ cells were located in the cortex and lymphoid follicles of the lymph node of the eastern quoll (Fig. 16B,C). There were more CD4+ cells than CD8+ cells. The anti‐CD4 and anti‐CD8 antibodies did not cross‐react with brushtail possum (Fig. 17B,C), eastern bettong, koala, opossum, red kangaroo, ringtail possum or wombat.
Figure 17.
Immunohistochemical labeling with T cell subset markers in brushtail possum lymph node. (A) anti‐CD3, (B) anti‐devil CD4, (C) anti‐devil CD8 and (D) isotype control. Cross species reactivity is shown for all three antibodies. Cx, cortex; Fl, follicle. Scale bar represents 100 μm.
The anti‐IgM antibodies reacted against the B cell subset in all the marsupials tested and the results for eastern quoll are shown in Fig. 18 and brushtail possum are shown in Fig. 19. A high level of background labeling of connective tissue components with the IgM antibody was observed to varying degrees in the lymph node sections of the different species. The anti‐IgG antibody reactivity against eastern quoll is shown in Fig. 18C and lack of reactivity against brushtail possum B cells in Fig. 19C.
Figure 18.
Immunohistochemical labeling with B cell markers in eastern quoll lymph node. (A) anti‐CD79b, (B) anti‐devil IgM and (C) anti‐devil IgG and (D) isotype control. Cross species reactivity is shown for all three antibodies. Cx, cortex; Fl, follicle. Scale bar represents 100 μm..
DISCUSSION
We have successfully identified the full sequence of the CD4, CD8α, IgM, and IgG molecules in the Tasmanian devil. These genes were identified in silico from the Tasmanian devil genome sequence and the predictions were confirmed by PCR amplification and sequencing. As expected, CD4, CD8, IgM and IgG aa sequences are most closely related to the tammar wallaby and are more distantly related to eutherian mammals.
This sequencing enabled the production of the first Tasmanian devil specific anti‐CD4 anti‐CD8, anti‐IgM and anti‐IgG antibodies. Previous attempts to use commercial eutherian antibodies to study immune subsets in marsupials failed to show any cross‐reactivity (Cisternas and Armati, 2000; Old and Deane, 2002). The lack of cross‐reactivity is likely to be the result of the divergent protein sequences that prevents antibody binding. The development of Tasmanian devil‐specific antibodies allow us to study immune cell subsets in Tasmanian devil tissues.
We identified T cell subsets in pouch young thymus, a primary lymphoid organ where T cells develop. The T cell subsets had a distinct pattern of distribution. The CD3+ T cells were present in the cortex and medulla with a high density at the cortex‐medulla boundary. The majority of CD4+ and CD8+ T cells were observed in the cortex. This variation in T cell distribution is similar to that of other eutherian mammals as it reflects the developmental process of T cells. In the eutherian thymus, the developmental process involves the migration of developing T cells from the cortex to the medulla. As this occurs, double‐positive CD4+/CD8+ immature T cells lose expression of either CD4 or CD8 molecules and develop into single positive CD4+ or CD8+ mature T cells. Also during development, the CD3 molecule, which is not expressed on immature T cells, starts to be expressed on T cells (Smith, 1987; Egerton et al., 1990; Alvarez‐Vallina et al., 1993). This indicates that the development of T cell subsets in the Tasmanian devil is comparable to that of eutherian mammals. Normally, once mature T cells have developed they relocate to the secondary lymphoid organs.
In Tasmanian devil secondary lymphoid organs, where T and B cells are expected to produce immune responses, CD4+ T cells were the predominant T cell subset in most tissues. The predominant B cell subset was IgM in all tissues. In lymph nodes, T cells were more abundant in the paracortex and the average CD4:CD8 ratios of lymph node T cells were similar to the ratios reported in other eutherian mammals (Black et al., 1980; Endo et al., 1997). When we compared the CD4:CD8 ratios of DFTD‐affected and nondiseased animals, there was no significant difference in the medulla or paracortex of the lymph node. The cortex did show a significantly lower number of CD8+ T cells in diseased compared to nondiseased animals. The functional significance of this is not clear, but it is possibly a factor of the dynamic state of the cortical region of lymph nodes during immune responses (Katakai et al., 2004).
B cells were primarily located in the cortex associated with follicles. The IgM subset was most abundant and located in the primary follicles and mantle zones of secondary follicles. Cells containing IgG were found in the germinal centers. These subset distributions reflect the process of differentiation and maturation of B cells into immunogobobulin‐secreting plasma cells in the germinal center of follicles (Bhan et al., 1981). These results indicate that the distribution of T cell and B cell subsets in the lymph node is similar to eutherian mammals.
We identified T cells and B cells in BALT, which are lymphoid aggregates located near bronchioles in the lung. T cells were scattered along the bronchiole, whereas B cells were associated with lymphoid follicles. Both the IgM and IgG antibodies showed a significant level of background labeling of connective tissue components, for which soluble antibody may be a contributing factor. This may limit the usefulness of these antibodies in assessing B cell subsets in mucosal‐associated lymphoid tissues. The presence and frequency of BALT in eutherian and marsupial species varies in relation to animal maturity or whether antigenic challenge has occurred (Pabst and Gehrke, 1990; Old and Deane, 2003; Old et al., 2004). As BALT is a variable lymphoid tissue among species and due to the small sample size of this study, comparison of Tasmanian devil BALT with other species may not be valid.
Both T cells and B cells were identified in GALT, which are lymphoid aggregates associated with the mucosal lining of the small intestine. The B cell subsets were primarily located within lymphoid follicles of the mucosa. Background labeling of IgM and IgG antibodies, as previously discussed, limited visualization of B cell subsets in the mucosa. CD8+ T cells were scattered within the epithelia and lamina propria of villi. CD4+ T cells were found primarily on the outer regions of lymphoid follicles within the mucosa. This distribution of T cell subsets is similar to those reported in studies of eutherian mammal GALT, but the Tasmanian devil lamina propria appears to have a higher density of CD8+ T cells (Janossy et al., 1980; Veazey et al., 1997). This may be due to reported differences in both the structure and cellular composition of GALT across eutherian and marsupial species, which is influenced by both the diet and antigen exposure of the different animals (Young et al., 2003).
Tasmanian devil spleen had a variation in relative abundance of CD4+ T cells to CD8+ T cells. The white pulp of the spleen has a greater abundance of CD4+ T cells, similar to other Tasmanian devil secondary lymphoid tissues. However, the red pulp diverged from this trend as it consisted of more CD8+ T cells. This pattern of distribution has also been observed in eutherian mammal spleens (Steiniger et al., 2001) and functionally CD8+ cells have been described as accumulating in the red pulp in response to infection or activation (Potsch et al., 1999). When we compared DFTD‐affected versus non‐diseased animals, there was no significant difference in the number of cells in the red pulp or white pulp. Thus, our results suggest that both non‐diseased and DFTD‐affected Tasmanian devil CD8+ T cells appear to be activated in the spleen, in a similar way to the spleens of eutherian mammals. The B cell subsets were mainly associated with follicles in the white pulp areas of the spleen. There were a higher number of IgM+ cells compared to IgG+ cells in these regions, with labeling pattern similar to the organization of secondary follicles in the lymph node, as previously discussed.
The identification of T cell and B cell subsets and their distribution has provided some insight into the competency of the Tasmanian devil immune system, however, the function of T cells depends on the presence and function of APC, making APC an important cell to investigate.
In eutherian mammals, dendritic cells play an important role in processing and presenting antigen to CD4+ and CD8+ T cells (Inaba et al., 1990). A deficiency in these cells would lead to a deficiency in T cell activation. In a previous study we reported the presence of MHC class II+ cells in secondary lymphoid organs of Tasmanian devils (Kreiss et al., 2009). This provided early evidence for the presence of APC in the Tasmanian devil. In this study we analyzed this further by identifying cells positive for the dendritic cell markers CD1a and CD83 in the lymph node and spleen of Tasmanian devils. Furthermore, CD1a+ and MHC class II+ cells were observed in the skin of Tasmanian devils, likely representing the Langerhans cells and dermal dendritic cells observed in eutherian mammals (van de Rijn et al., 1984). The identification of APC and the localization in skin and lymphoid organs is consistent with previous studies assessing marsupial immune systems (Coutinho et al., 1995; Cisternas and Armati, 2000). The identification of these cells suggests that the Tasmanian devil immune system is composed of the important APC subsets required for an effective immune response. Of particular interest is the identification of dendritic cells in the skin, as these would be the APC expected to respond to DFTD. Thus, a lack of local APC cannot be the reason that the Tasmanian devil immune system does not reject the tumor tissue. This led to investigation of the immune cell subsets at the site of the tumor.
It has been previously reported that a limited number CD3+ cells infiltrate some devil facial tumors. This generated interest as to which T cell subsets are associated with the tumor. We determined that CD8+ T cells were the dominant T cell subset in devil facial tumors. This was a surprising result as we expected that the majority of T cells in tumors would be CD4+ T cells, as some of which could have represented CD4+ T‐regulatory cells, as they have been reported to exert immunosuppressive effects in a number of tumor microenvironments (Ganesan et al., 2013; Li et al., 2013). Low CD4/CD8 ratios in tumors have been associated with a favorable prognosis in studies of certain human cancers (Diederichsen et al., 2003; Sato et al., 2005), but not in others (Halliday et al., 1995). Thus, the role of infiltrating T cell subsets is still controversial and appears to differ depending on the tumor. As devil facial tumors cause 100% mortality, it can be inferred that the limited numbers of CD8+ T cells within tumors are not contributing to an effective anti‐tumor immune response and are not related to a favorable prognosis.
B cells were not identified in the devil facial tumor tissue, however, APC were present. We observed CD1a+ dendritic cells surrounding, but not within, devil facial tumors. The presence of CD1a+ dendritic cells is a relatively common observation in tumors (Hillenbrand et al., 1999; Troy et al., 1999; Bergeron et al., 2006). Despite their potential to process and present antigen, CD1a+ cells do not appear to correlate well with prognosis (Coventry and Morton, 2003). This is supported by our findings, as stromal CD1a+ cells do not correlate with a greater prognosis. There were no CD83+ cells present in the tumor tissue. This finding is similar to studies of human tumors, where the presence of CD83+ cells in the tumor environment is uncommon (Thurnher et al., 1996; Coventry et al., 2002). Absence of CD83+ cells in devil facial tumors supports the observed lack of immune response against devil facial tumors. We observed MHC class II+ cells both within, and surrounding, all devil facial tumors. The abundant presence of these cells may reflect pathological recruitment of APC, particularly macrophages, which have been implicated in enhancing tumor progression (reviewed by Lewis and Pollard, 2006). However, to confirm this, further research into specific macrophages markers is required. Thus, this study shows that although T cells and APC are present in the tumor tissue, none of the cells correlate with better prognosis, or fully elucidate why there is a lack of immune response against DFTD.
The usefulness of the antibodies produced against Tasmanian devil CD4, CD8, IgM, and IgG peptides is not limited to studying Tasmanian devil immune cell subsets. By testing the Tasmanian devil antibodies against a host of different marsupial species we found that the anti‐devil CD4 and anti‐devil CD8 antibodies could be used to characterize T cell subsets in the eastern quoll and spotted‐tail quoll. The anti‐devil IgM reacted with all marsupials tested and the anti‐devil IgG reacted with the eastern quoll and spotted‐tail quoll. This will provide tools for research in an area that has very limited reagents.
In conclusion, we have identified CD4+ and CD8+ T cells, IgM+, and IgG+ B cells, CD1a+ cells and CD83+ cells in the Tasmanian devil. The location and distribution of these cells reflects what has been observed in eutherian mammals. The findings of this study support our previous studies assessing the competency of the Tasmanian devil immune system (Woods et al., 2007; Kreiss et al., 2008). In addition, we have shown that the distribution of these cells in the tumor microenvironment suggests a complex interaction between devil facial tumor and the immune system that appears to be similar to some human cancers. Production of antibodies to these key immune cells provides an avenue to further investigate the Tasmanian devil's immune system. This will be particularly useful in analyzing responses to immunotherapy and vaccines.
ACKNOWLEDGEMENTS
The authors are grateful for the support provided by the staff of the Save the Tasmanian Devil Program. The authors are thankful to the Taronga Conservation Society Australia for the kind donation of marsupial lymphoid tissues; A/Prof. K. Dziegielewska and Prof. N. Saunders from University of Melbourne who donated opossum tissues; Mr. Dane Hayes Animal Health Laboratory, Department of Primary Industries Parks Water and Environment, for the GALT tissue, Mrs. Narelle Phillips, Menzies Research Institute Tasmania, for the histological preparations; Dr. D. Emslie for cloning and protein expression, to the Monoclonal Antibody Facility of the Walter and Eliza Hall Institute for expert antibody production and to Ms. Jo Hanuszewicz for valuable assistance with the figures. A.T.P. and L.C.'s contributions were made possible through Victorian State Government Operational Infrastructure Support and Australian Government NHMRC IRIISS.
LITERATURE CITED
- Altschul SF, Madden TL, Schaffer AA, Zhang J, Zhang Z, Miller W, Lipman DJ. 1997. Gapped BLAST and PSI‐BLAST: a new generation of protein database search programs. Nucleic Acids Res 25:3389–3402 [DOI] [PMC free article] [PubMed] [Google Scholar]
- Alvarez‐Vallina L, Gonzalez A, Gambon F, Kreisler M, Diaz‐Espada F. 1993. Delimitation of the proliferative stages in the human thymus indicates that cell expansion occurs before the expression of CD3 (T cell receptor). J Immunol 150:8–16 [PubMed] [Google Scholar]
- Bell RG. 1977. Marsupial immunoglobulins: the distribution and evolution of macropod IgG2, IgG1, IgM and light chain antigenic markers within the sub‐class Metatheria. Immunology 33:917–924 [PMC free article] [PubMed] [Google Scholar]
- Berchtold S, Muhl‐Zurbes P, Heufler C, Winklehner P, Schuler G, Steinkasserer A. 1999. Cloning, recombinant expression and biochemical characterization of the murine CD83 molecule which is specifically upregulated during dendritic cell maturation. FEBS Lett 461:211–216 [DOI] [PubMed] [Google Scholar]
- Bergeron A, El‐Hage F, Kambouchner M, Lecossier D, Tazi A. 2006. Characterisation of dendritic cell subsets in lung cancer micro‐environments. Eur Respir J 28:1170–1177 [DOI] [PubMed] [Google Scholar]
- Bhan AK, Nadler LM, Stashenko P, McCluskey RT, Schlossman SF. 1981. Stages of B cell differentiation in human lymphoid tissue. J Exp Med 154:737–749 [DOI] [PMC free article] [PubMed] [Google Scholar]
- Black RB, Leong AS, Cowled PA, Forbes IJ. 1980. Lymphocyte subpopulations in human lymph nodes: a normal range. Lymphology 13:86–90 [PubMed] [Google Scholar]
- Cisternas PA, Armati PJ. 2000. Immune system cell markers in the northern brown bandicoot, Isoodon macrourus. Dev Comp Immunol 24:771–782 [DOI] [PubMed] [Google Scholar]
- Coutinho HB, Sewell HF, Tighe P, King G, Nogueira JC, Robalinho TI, Coutinho VB, Cavalcanti VM. 1995. Immunocytochemical study of the ontogeny of the marsupial Didelphis albiventris immune system. J Anat 187:37–46 [PMC free article] [PubMed] [Google Scholar]
- Coventry BJ, Lee PL, Gibbs D, Hart DN. 2002. Dendritic cell density and activation status in human breast cancer ‐‐ CD1a, CMRF‐44, CMRF‐56 and CD‐83 expression. Br J Cancer 86:546–551 [DOI] [PMC free article] [PubMed] [Google Scholar]
- Coventry BJ, Morton J. 2003. CD1a‐positive infiltrating‐dendritic cell density and 5‐year survival from human breast cancer. Br J Cancer 89:533–538 [DOI] [PMC free article] [PubMed] [Google Scholar]
- Diederichsen AC, Hjelmborg JB, Christensen PB, Zeuthen J, Fenger C. 2003. Prognostic value of the CD4+/CD8+ ratio of tumour infiltrating lymphocytes in colorectal cancer and HLA‐DR expression on tumour cells. Cancer Immunol Immunother 52:423–428 [DOI] [PMC free article] [PubMed] [Google Scholar]
- DPIPWE . 2012. Save The Tasmanian Devil Program In: 2011/12 Annual program report. Tasmania: Department of Primary Industries, Parks, Water and Environment; [Google Scholar]
- Duncan LG, Nair SV, Deane EM. 2012. Immunohistochemical localization of T‐lymphocyte subsets in the developing lymphoid tissues of the tammar wallaby (Macropus eugenii). Dev Comp Immunol 38:475–486 [DOI] [PubMed] [Google Scholar]
- Egerton M, Scollay R, Shortman K. 1990. Kinetics of mature T‐cell development in the thymus. Proc Natl Acad Sci USA 87:2579–2582 [DOI] [PMC free article] [PubMed] [Google Scholar]
- Endo Y, Matsumura S, Washizu T, Ishida T. 1997. Alteration of T‐cell subsets in the lymph nodes from cats infected with feline immunodeficiency virus. J Vet Med Sci 59:739–746 [DOI] [PubMed] [Google Scholar]
- Ganesan AP, Johansson M, Ruffell B, Beltran A, Lau J, Jablons DM, Coussens LM. 2013. Tumor‐infiltrating regulatory T cells inhibit endogenous cytotoxic T cell responses to lung adenocarcinoma. J Immunol 191:2009–2017 [DOI] [PMC free article] [PubMed] [Google Scholar]
- Hakes DJ, Dixon JE. 1992. New vectors for high level expression of recombinant proteins in bacteria. Anal Biochem 202:293–298 [DOI] [PubMed] [Google Scholar]
- Hall TA. 1999. BioEdit: a user friendly biological sequence alignment editor and anlaysis program form Windows 95/98NT. Nucl Acids Symp Ser 41:95–98 [Google Scholar]
- Halliday GM, Patel A, Hunt MJ, Tefany FJ, Barnetson RS. 1995. Spontaneous regression of human melanoma/nonmelanoma skin cancer: association with infiltrating CD4+ T cells. World J Surg 19:352–358 [DOI] [PubMed] [Google Scholar]
- Hawkins C, Baars C, Hesterman H, Hocking G, Jones M, Lazenby B, Mann D, Mooney N, Pemberton D, Pyecroft S. 2006. Emerging disease and population decline of an island endemic, the Tasmanian devil Sarcophilus harrisii. Biol Conserv 131:307–324 [Google Scholar]
- Hemsley SW, Canfield PJ, Husband AJ. 1995. Immunohistological staining of lymphoid tissue in four Australian marsupial species using species cross‐reactive antibodies. Immunol Cell Biol 73:321–325 [DOI] [PubMed] [Google Scholar]
- Hillenbrand EE, Neville AM, Coventry BJ. 1999. Immunohistochemical localization of CD1a‐positive putative dendritic cells in human breast tumours. Br J Cancer 79:940–944 [DOI] [PMC free article] [PubMed] [Google Scholar]
- Inaba K, Metlay JP, Crowley MT, Witmer‐Pack M, Steinman RM. 1990. Dendritic cells as antigen presenting cells in vivo. Int Rev Immunol 6:197–206 [DOI] [PubMed] [Google Scholar]
- Janossy G, Tidman N, Selby WS, Thomas JA, Granger S, Kung PC, Goldstein G. 1980. Human T lymphocytes of inducer and suppressor type occupy different microenvironments. Nature 288:81–84 [DOI] [PubMed] [Google Scholar]
- Jones M, Cordell JL, Beyers AD, Tse AG, Mason DY. 1993. Detection of T and B cells in many animal species using cross‐reactive anti‐peptide antibodies. J Immunol 150:5429–5435 [PubMed] [Google Scholar]
- Katakai T, Hara T, Lee JH, Gonda H, Sugai M, Shimizu A. 2004. A novel reticular stromal structure in lymph node cortex: an immuno‐platform for interactions among dendritic cells, T cells and B cells. Int Immunol 16:1133–1142 [DOI] [PubMed] [Google Scholar]
- Kreiss A, Fox N, Bergfeld J, Quinn SJ, Pyecroft S, Woods GM. 2008. Assessment of cellular immune responses of healthy and diseased Tasmanian devils (Sarcophilus harrisii). Dev Comp Immunol 32:544–553 [DOI] [PubMed] [Google Scholar]
- Kreiss A, Obendorf DL, Hemsley S, Canfield PJ, Woods GM. 2009. A histological and immunohistochemical analysis of lymphoid tissues of the Tasmanian devil. Anat Rec 292:611–620 [DOI] [PubMed] [Google Scholar]
- Lewis CE, Pollard JW. 2006. Distinct role of macrophages in different tumor microenvironments. Cancer Res 66:605–612 [DOI] [PubMed] [Google Scholar]
- Li Q, Li Q, Chen J, Liu Y, Zhao X, Tan B, Ai J, Zhang Z, Song J, Shan B. 2013. Prevalence of Th17 and Treg cells in gastric cancer patients and its correlation with clinical parameters. Oncol Rep 30:1215–1222 [DOI] [PubMed] [Google Scholar]
- Loh R, Bergfeld J, Hayes D, O'Hara A, Pyecroft S, Raidal S, Sharpe R. 2006a. The pathology of devil facial tumor disease (DFTD) in Tasmanian devils (Sarcophilus harrisii). Vet Pathol 43:890–895 [DOI] [PubMed] [Google Scholar]
- Loh R, Hayes D, Mahjoor A, O'Hara A, Pyecroft S, Raidal S. 2006b. The immunohistochemical characterization of devil facial tumor disease (DFTD) in the Tasmanian devil (Sarcophilus harrisii). Vet Pathol 43:896–903 [DOI] [PubMed] [Google Scholar]
- Mukaratirwa S, Gruys E. 2003. Canine transmissible venereal tumour: cytogenetic origin, immunophenotype, and immunobiology. A review. Vet Q 25:101–111 [DOI] [PubMed] [Google Scholar]
- Murchison EP. 2008. Clonally transmissible cancers in dogs and Tasmanian devils. Oncogene 27(Suppl 2):S19–S30 [DOI] [PubMed] [Google Scholar]
- Murchison EP, Schulz‐Trieglaff OB, Ning Z, Alexandrov LB, Bauer MJ, Fu B, Hims M, Ding Z, Ivakhno S, Stewart C, Ng BL, Wong W, Aken B, White S, Alsop A, Becq J, Bignell GR, Cheetham RK, Cheng W, Connor TR, Cox AJ, Feng ZP, Gu Y, Grocock RJ, Harris SR, Khrebtukova I, Kingsbury Z, Kowarsky M, Kreiss A, Luo S, Marshall J, McBride DJ, Murray L, Pearse AM, Raine K, Rasolonjatovo I, Shaw R, Tedder P, Tregidgo C, Vilella AJ, Wedge DC, Woods GM, Gormley N, Humphray S, Schroth G, Smith G, Hall K, Searle SM, Carter NP, Papenfuss AT, Futreal PA, Campbell PJ, Yang F, Bentley DR, Evers DJ, Stratton MR. 2012. Genome sequencing and analysis of the Tasmanian devil and its transmissible cancer. Cell 148:780–791 [DOI] [PMC free article] [PubMed] [Google Scholar]
- Murchison EP, Tovar C, Hsu A, Bender HS, Kheradpour P, Rebbeck CA, Obendorf D, Conlan C, Bahlo M, Blizzard CA, Pyecroft S, Kreiss A, Kellis M, Stark A, Harkins TT, Marshall Graves JA, Woods GM, Hannon GJ, Papenfuss AT. 2010. The Tasmanian devil transcriptome reveals Schwann cell origins of a clonally transmissible cancer. Science 327:84–87 [DOI] [PMC free article] [PubMed] [Google Scholar]
- Old JM, Deane EM. 2002. Immunohistochemistry of the lymphoid tissues of the tammar wallaby, Macropus eugenii. J Anat 201:257–266 [DOI] [PMC free article] [PubMed] [Google Scholar]
- Old JM, Deane EM. 2003. The detection of mature T‐ and B‐cells during development of the lymphoid tissues of the tammar wallaby (Macropus eugenii). J Anat 203:123–131 [DOI] [PMC free article] [PubMed] [Google Scholar]
- Old JM, Selwood L, Deane EM. 2004. The appearance and distribution of mature T and B cells in the developing immune tissues of the stripe‐faced dunnart (Sminthopsis macroura). J Anat 205:25–33 [DOI] [PMC free article] [PubMed] [Google Scholar]
- Pabst R, Gehrke I. 1990. Is the bronchus‐associated lymphoid tissue (BALT) an integral structure of the lung in normal mammals, including humans? Am J Respir Cell Mol Biol 3:131–135 [DOI] [PubMed] [Google Scholar]
- Pearse AM, Swift K. 2006. Allograft theory: transmission of devil facial‐tumour disease. Nature 439:549 [DOI] [PubMed] [Google Scholar]
- Potsch C, Vohringer D, Pircher H. 1999. Distinct migration patterns of naive and effector CD8 T cells in the spleen: correlation with CCR7 receptor expression and chemokine reactivity. Eur J Immunol 29:3562–3570 [DOI] [PubMed] [Google Scholar]
- Sato E, Olson SH, Ahn J, Bundy B, Nishikawa H, Qian F, Jungbluth AA, Frosina D, Gnjatic S, Ambrosone C, Kepner J, Odunsi T, Ritter G, Lele S, Chen YT, Ohtani H, Old LJ, Odunsi K. 2005. Intraepithelial CD8+ tumor‐infiltrating lymphocytes and a high CD8+/regulatory T cell ratio are associated with favorable prognosis in ovarian cancer. Proc Natl Acad Sci USA 102:18538–18543 [DOI] [PMC free article] [PubMed] [Google Scholar]
- Smith L. 1987. CD4+ murine T cells develop from CD8+ precursors in vivo. Nature 326:798–800 [DOI] [PubMed] [Google Scholar]
- Steiniger B, Barth P, Hellinger A. 2001. The perifollicular and marginal zones of the human splenic white pulp : do fibroblasts guide lymphocyte immigration? Am J Pathol 159:501–512 [DOI] [PMC free article] [PubMed] [Google Scholar]
- Thompson JD, Higgins DG, Gibson TJ. 1994. CLUSTAL W: improving the sensitivity of progressive multiple sequence alignment through sequence weighting, position‐specific gap penalties and weight matrix choice. Nucleic Acids Res 22:4673–4680 [DOI] [PMC free article] [PubMed] [Google Scholar]
- Thurnher M, Radmayr C, Ramoner R, Ebner S, Böck G, Klocker H, Romani N, Bartsch G. 1996. Human renal cell carcinoma tissue contains dendritic cells. Int J Cancer 68:1–7 [DOI] [PubMed] [Google Scholar]
- Tovar C, Obendorf D, Murchison EP, Papenfuss AT, Kreiss A, Woods GM. 2011. Tumor‐specific diagnostic marker for transmissible facial tumors of Tasmanian devils: immunohistochemistry studies. Vet Pathol 48:1195–1203 [DOI] [PubMed] [Google Scholar]
- Troy AJ, Davidson PJ, Atkinson CH, Hart DN. 1999. CD1a dendritic cells predominate in transitional cell carcinoma of bladder and kidney but are minimally activated. J Urol 161:1962–1967 [PubMed] [Google Scholar]
- van de Rijn M, Lerch PG, Bronstein BR, Knowles RW, Bhan AK, Terhorst C. 1984. Human cutaneous dendritic cells express two glycoproteins T6 and M241 which are biochemically identical to those found on cortical thymocytes. Hum Immunol 9:201–210 [DOI] [PubMed] [Google Scholar]
- Veazey RS, Rosenzweig M, Shvetz DE, Pauley DR, DeMaria M, Chalifoux LV, Johnson RP, Lackner AA. 1997. Characterization of gut‐associated lymphoid tissue (GALT) of normal rhesus macaques. Clin Immunol Immunopathol 82:230–242 [DOI] [PubMed] [Google Scholar]
- Wong ES, Papenfuss AT, Belov K. 2011. Immunome database for marsupials and monotremes. BMC Immunol 12:48 [DOI] [PMC free article] [PubMed] [Google Scholar]
- Woods GM, Kreiss A, Belov K, Siddle HV, Obendorf DL, Muller HK. 2007. The immune response of the Tasmanian devil (Sarcophilus harrisii) and devil facial tumour disease. Ecohealth 4:338–345 [Google Scholar]
- Young LJ, McFarlane R, Slender AL, Deane EM. 2003. Histological and immunohistological investigation of the lymphoid tissue in normal and mycobacteria‐affected specimens of the Rufous Hare‐wallaby (Lagorchestes hirsutus). J Anat 202:315–325 [DOI] [PMC free article] [PubMed] [Google Scholar]