Short abstract
The mechanical effect of a partial thickness tear or laceration of a tendon is analytically modeled under various assumptions and results are compared with previous experimental data from porcine flexor tendons. Among several fibril-level models considered, a shear-lag model that incorporates fibril–matrix interaction and a fibril–fibril interaction defined by the contact area of the interposed matrix best matched published data for tendons with shallow cuts (less than 50% of the cross-sectional area). Application of this model to the case of many disrupted fibrils is based on linear superposition and is most successful when more fibrils are incorporated into the model. An equally distributed load sharing model for the fraction of remaining intact fibrils was inadequate in that it overestimates the strength for a cut less than half of the tendon's cross-sectional area. In a broader sense, results imply that shear-lag contributes significantly to the general mechanical behavior of tendons when axial loads are nonuniformly distributed over a cross section, although the predominant hierarchical level and microstructural mediators for this behavior require further inquiry.
Keywords: global load sharing, shear-lag, tendon, laceration
1. Introduction
When tears or lacerations occur, tendons exhibit diminished mechanical properties compared to normal; both ultimate load [1–6] and stiffness [3,4] are decreased, resulting in a lower load bearing capacity. From a microstructural perspective, the diminished number of intact fibrils in a partially torn or lacerated tendon must carry the entire physiologic load. When a critical tear size is reached, continued loading of the tissue results in continued tearing and potential failure. Surgical intervention, rehabilitation, or rest becomes necessary to heal or reconstruct damaged fibrils and thereby avoid further damage to those remaining.
A common guideline for surgical intervention is that a tear of more than 50% of the initial cross-sectional area (CSA) should be considered for repair [7–12]. This “50% rule” was originally based upon clinical outcomes in hand surgery, but has also been used for other tendon injuries such as rotator cuff tears [13]. Few studies have rigorously investigated the mechanics of partial tears in flexor tendons, and those studies report conflicting results for the 50% rule. These studies offer differing surgical criteria for digital flexor tendons based primarily on ultimate strength [2–6,14,15], without considering remaining tissue behavior under physiologic loads.
A study aimed at understanding mechanical compromise in porcine flexor tendons with partial thickness defects was completed by Kondratko et al. [16] by performing cyclic tests before and after transversely lacerating the tendons' midsubstance. Mean stress in the remaining tendon tissue was investigated at 4% strain following a laceration of approximately 10%, 20%, 50%, or 65% of the CSA. Mean stress decreased rapidly with smaller cuts but then remained nearly constant for lacerations between 20% and 50% of the CSA. Stress values were compared to a simple mechanical prediction in which the reduced stress at a given strain is proportional to the reduced cross-sectional area [17]. This model poorly fit experimental data, oversimplifying the observed experimental behavior and demonstrating the need to account for load redistribution within the remaining tendon. An appropriate redistribution model would more accurately estimate the reduced load that can be borne by a torn or lacerated tendon and may identify significant, shear-based mechanical features for future models.
Multiple analytical models with different underlying assumptions have been formulated to describe load redistribution in aligned fiber composites with broken fibers. The purpose of this study is to consider and compare three of these analytical methods to describe load redistribution in a partially lacerated tendon. The first analytical model, known as global load sharing (GLS) or equal load sharing (ELS), is based on the hypothesis of an equal redistribution of load among surviving fibers and is similar to the simple model considered by Kondratko et al. [16,17]. The other two models are based on a “shear-lag” hypothesis that fibers and matrix undergo different displacements when a load is applied, leading to a “lag” in the displacement in the vicinity of the fiber-matrix interface with respect to the matrix [18]. Several shear-lag models (SLM) have been developed in the past; two such models are employed in the present study, both of which utilize a relatively simple 2D arrangement for fibers. The first is an early model proposed by Hedgepeth [19]. The second is a later model proposed by Wagner and Eitan [20] which built upon a widely used model developed by Cox [18] and modified by Nairn [21]. Recently, SLMs have been applied to biological composite models to help describe behaviors [22,23]. By comparing models to previous experimental data, this study seeks to identify the mechanical elements that are essential to behaviors observed in partially torn or lacerated tendons. In a broader sense, such information may help identify key targets for future structure–function inquiry.
2. Theoretical Background
Several models to describe failure of fibrous composite materials have been developed [18–21,24]; many try to enhance an earlier global model such as GLS by looking at the interfacial (fiber–matrix) phenomena. The present section provides an overview of GLS and SLMs considered for a 2D composite material containing long aligned fibers analogous to the case of a cut or partially torn tendon.
2.1. Definition of Damage Parameters.
The stress concentration factor (SCF) provides a reasonable prediction of failure load for brittle materials with holes or notches. A definition commonly used in mechanics of materials for the SCF is expressed by
| (1) |
where σ average is the nominal or average stress value defined using the initial CSA, σ max is the maximum local stress in a material when a notch is present (σ max ≥ σ average), and Δσ = σ max − σ average is the stress increase corresponding to the SCF. When no notch is present, σ max = σ average, and SCF = 1; when a notch is present Eq. (1) is larger than unity.
This metric is not, in general, equal to the corresponding ratio of failure stresses in materials with some ductility. For example, if applied stress causes local yield or other damage attenuation mechanisms near the notch tip, the notch is effectively blunted [25,26]. That reduces the stress concentration, and the material breaks at a higher stress than predicted by its elastic SCF. Furthermore, calculation of SCF via analysis in the theory of elasticity or via finite element analyses (FEA) requires full knowledge of the constitutive equations describing the material. Tendons may exhibit local tearing when cut and other diffuse damage when stretched, but because of structural and compositional complexity, their local mechanical behavior is not yet fully described in terms of constitutive equations. SCF values are typically used as dimensionless ratios amplifying the potential of a load to cause damage. Alternatively, this study uses the inverse of the Eq. (1) metric to represent the reduced load bearing capacity of a partially lacerated tendon. The damage parameter K 1 is then
| (2) |
Equation (2) is smaller than 100% when a cut is present since it compares stress in cut versus intact specimens, the former always being smaller than the latter. The SCF is amenable to calculation but is not directly measurable. As discussed previously, the SCF does not predict strength here since tendons are not brittle.
Because it is straightforward to measure the mechanical strength of a specimen, a second damage parameter K 2 is defined as the percentage of failure stress σ failure for a damaged specimen to the corresponding failure stress for an undamaged specimen
| (3) |
Such a damage parameter is pertinent to the performance of materials intended to support load.
In tendon and ligament, functional failure (inability to fulfill physiologic function as normal) can occur even when damage is insufficient to cause complete rupture. Such damage, if of sufficient magnitude, can cause dysfunctional laxity of the joint. Our evaluation therefore utilizes the increased compliance caused by a cut. In that context, a third damage parameter K 3 is defined as the ratio of engineering stress σ to obtain a specified strain for a damaged specimen to the corresponding engineering stress for an undamaged specimen
| (4) |
The damage parameter K 3 is readily measurable from stress–strain curves.
2.2. Global Load Sharing Model.
GLS, sometimes referred to as ELS [27,28], is based on the hypothesis that unbranched fibers are the only load bearing elements in the material and thus the strength of the material is directly related to the number of intact fibers. Further, no shearing effect by the matrix is considered. Therefore, if a number of fibers, , out of the total number of aligned fibers, , is cut, stress is equally redistributed on the remaining, , intact fibers so that Eq. (5) is satisfied
| (5) |
The damage parameter relating to the nominal stress in the damaged structure at a given strain, as defined in Eq. (4), can then be obtained from Eq. (5)
| (6) |
or, as a function of the percentage of cut fibers
| (7) |
| (8) |
Figure 1 shows the behavior of according to the GLS model for different percentages of cut fibers; note that the relationship between and percentage of cut fibers is linear.
Fig. 1.
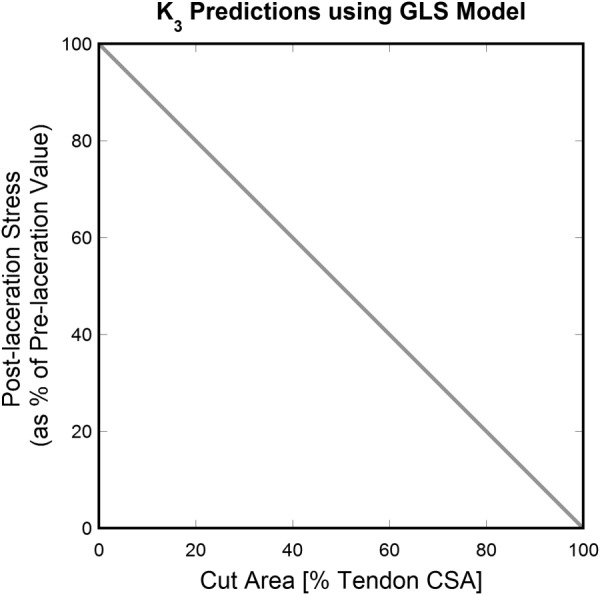
K 3 (postlaceration stress as a percentage of prelaceration value) predictions versus (percentage of cut fibers) using the GLS model. A simple linear relation between reduction in stress and percentage of broken fibers is obtained.
2.3. Shear-Lag Models.
GLS is a simplistic model that assumes that all intact fibers are subject to the same additional stress when some fibers are cut. However, when the matrix of a composite interacts with fibers, it biases the way intact fibers share stress released from the cut fibers [20]. Surviving fibers closest to a broken one absorb more of the released stress than those further away [20,28]. A model for this requires a local load sharing (LLS) rule to redistribute stress among the intact fibers such that fiber stress is greater near broken fibers and smaller for fibers at larger distances. LLS will be implemented using the shear-lag hypothesis in which fibers and matrix undergo different deformations that change radially from the fiber-matrix interface of a cut fiber, causing the fiber to lag in displacement with respect to the matrix [18,29].
Examples of SLMs are given in Secs. 2.3.1–2.3.4, each based on different assumptions and considerations. Some assumptions, however, are generally consistent with all of these models [30]:
-
(1)
Behaviors of the fiber and matrix are linearly elastic.
-
(2)
The fiber-matrix interface is infinitesimally thin.
-
(3)
No strain discontinuity is present across the fiber–matrix interface (i.e., the bond between the matrix and fibers on the fiber surface is perfect).
-
(4)
No bonding occurs between the matrix and the end faces of the fibers.
2.3.1. Cox's Shear-Lag Model.
The term “shear-lag” in this study is associated with the stress transfer analysis method developed by Cox [18]. The method was based on equilibrium between the average axial fiber stress in the z direction and the shear stress at the interface with the surrounding matrix, , defined for cylindrical geometry as
| (9) |
where is the average axial stress in the fiber and is the fiber radius. The assumption that
| (10) |
was introduced where is the matrix displacement and is the fiber displacement.
Shear stress is related to shear strain in elasticity as . Cox introduced a fundamental shear-lag assumption, that
| (11) |
From the equilibrium in Eq. (9) and the assumptions in Eqs. (10) and (11), Cox derived a one-dimensional equation for fiber stress which can be written as
| (12) |
where is the far-field stress, i.e., the average axial stress in the fiber at an infinite axial distance from the cut region, and is the shear-lag parameter, defined as
| (13) |
where is the matrix shear modulus, is the fiber axial modulus, and is the mean center-to-center fiber distance. When Cox's model is applied to concentric cylinders with matrix surrounding the fiber, is generally considered equal to (the outer radius of the matrix cylinder) [31]. A more literal interpretation of Cox's analysis might use [21].
The shear-lag concept presented here is used in the models in Secs. 2.3.2–2.3.4.
2.3.2. Nairn's Shear-Lag Model Modification.
The shear-lag coefficient defined by Eq. (13) was further developed by Nairn [21], who introduced simplifying assumptions into an analysis of Eq. (12) in a cylindrical geometry. The first assumption, in line with Cox's fundamental shear-lag assumption, is that
| (14) |
such that, in the expression for the interfacial shear stress, , it is assumed
| (15) |
The next assumption is that a shear-lag stress state admits , normally defined by linear functions of (fiber-direction), to be written in a more general form
| (16) |
where and are functions of [21], which are not necessarily linear.
Next, a one-dimensional Hooke's law is assumed, thereby ignoring transverse stresses. Therefore
| (17) |
or, more explicitly,
| (18) |
where denotes averaging over the considered cylinder (fiber or matrix) and is the strain due to an eventual temperature difference in the axial direction as specified by the subscript .
Finally, σ zz and the axial displacement w in a fiber should be independent of r but, since they in general depend on it, such dependence is assumed to be sufficiently weak.
The resulting coefficient for a fiber surrounded by matrix (modeled as two concentric cylinders, the inner cylinder a solid fiber cylinder, the outer cylinder a hollow matrix cylinder) is given by
| (19) |
where , , , and are the axial and shear moduli of the fiber and matrix, respectively, is the fiber radius, and and are the fiber and matrix volume fractions defined by
| (20) |
where is the outer radius of the matrix cylinder.
The assumptions for this analysis are the minimum number of assumptions required; additional assumptions may be appropriate for different problems [21].
2.3.3. Hedgepeth's Damage Model.
A study of overloading in an intact fiber was performed by Hedgepeth [19,24] in which the force in the nth fiber is given in terms of displacement by
| (21) |
The shear force per unit length between adjacent fibers is defined as , where d is the fiber spacing, such that the equilibrium of an element of the nth fiber requires
| (22) |
where m is the mass per unit length associated with a filament.
The shear-lag assumption in Eq. (14) was used to simplify the equilibrium equation defined in Eq. (22) by removing the transverse displacement dependence from the longitudinal equilibrium equation; thus, fiber stress and matrix shear stress can be determined without solving the transverse equilibrium equation. Additional assumptions were that the transverse distance between adjacent fibers, d, is constant, fibers carry only normal load and matrix only shear load, fiber breaks were on a transverse line, and small deflection elasticity theory is used for the analysis. Hedgepeth's analysis separates the static and the dynamic rupture cases; since only the former is of interest here, the right hand side in Eq. (22) is set to zero.
The maximum value of SCF (or, correspondingly, the minimum value for K 3) occurs at the edge of the cut, where boundary conditions yield equations in which the effects of the geometric properties dominate [19]. Moreover, when a constant value for the fiber distance is assumed, the most influential parameters for the value of SCF are the number of broken fibers and the total number of fibers in the model. The expression of the maximum stress concentration factor, occurring at the first intact fiber adjacent to the broken ones, generalized for the case of broken fibers is defined as
| (23) |
The subscript q denotes the dependence on q broken fibers. Note that Eq. (23) provides a SCF according to its traditional definition given by Eq. (1). The following expression for a damage parameter will be used in the present study:
| (24) |
Figure 2 graphically demonstrates the curve calculated in Eq. (24) when a 2D composite with 100 fibers is considered. Equations (23) and (24) do not allow a formulation of K 3 solely in terms of as it was in Eq. (8), so the relationship plotted in Fig. 2 is specific to the considered case. However, the general shape provided by the relationship in Eq. (24) for the damage parameter K 3 is asymptotic in behavior regardless of the number of fibers in the considered composite.
Fig. 2.
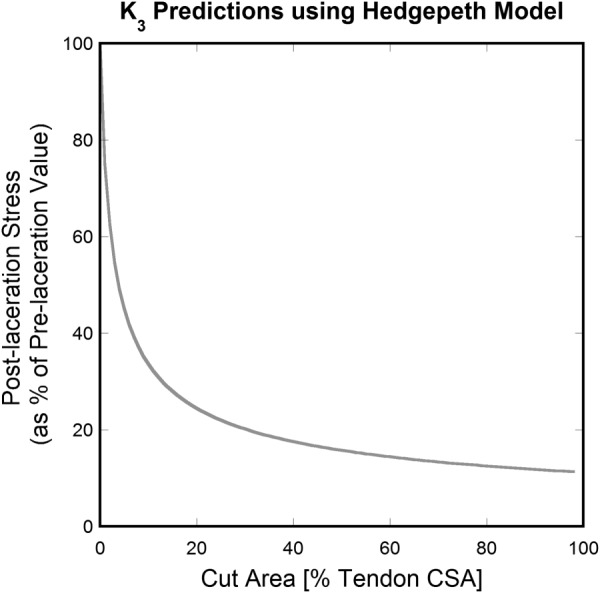
K 3 predictions versus (percent cut fibers for the 100 fiber case) according to the Hedgepeth model. An asymptotic shape is obtained. Note that values of depend directly on the absolute number of cut fibers in the material rather than on the percent of cut fibers.
2.3.4. Wagner and Eitan's Damage Model.
Wagner and Eitan [20] extend Cox's model to a case with many cut fibers using linear superposition of the stress increases due to each of the broken fibers. Wagner and Eitan then compute an overall for a cluster of broken fibers. A 2D geometry with aligned fibers is considered (no restriction from the generalization to a 3D case is made provided that a reliable representation of the composite's 3D geometry is available). Computation of the nominal load borne by each intact fiber in a lacerated object is possible using the Cox and Nairn shear-lag approaches, which consider the geometrical and material properties of the composite.
The following expression for the locally effective on the first intact fiber next to a cluster of broken fibers is obtained (subscript q denotes that more than one broken fiber is considered for the calculation):
| (25) |
where is the shear-lag coefficient for the cut fiber; is the corresponding nondimensional radial distance from the ith broken fiber to the center of the first intact fiber; is the dimensional distance; is the cut fiber's radius; is the stress (or shear) transfer length, i.e., twice the distance from the cut region over which the fiber's strain corresponds to the matrix value (doubled since the behavior is symmetric moving further from the cut region in both directions along the fiber's length); and is the variable accounting for the axial distance from the cut region. Equation (25) is then valid for . is defined as
| (26) |
where is the maximum angle under which the cut of the ith fiber still affects the next intact neighbor (see Fig. 3).
Fig. 3.
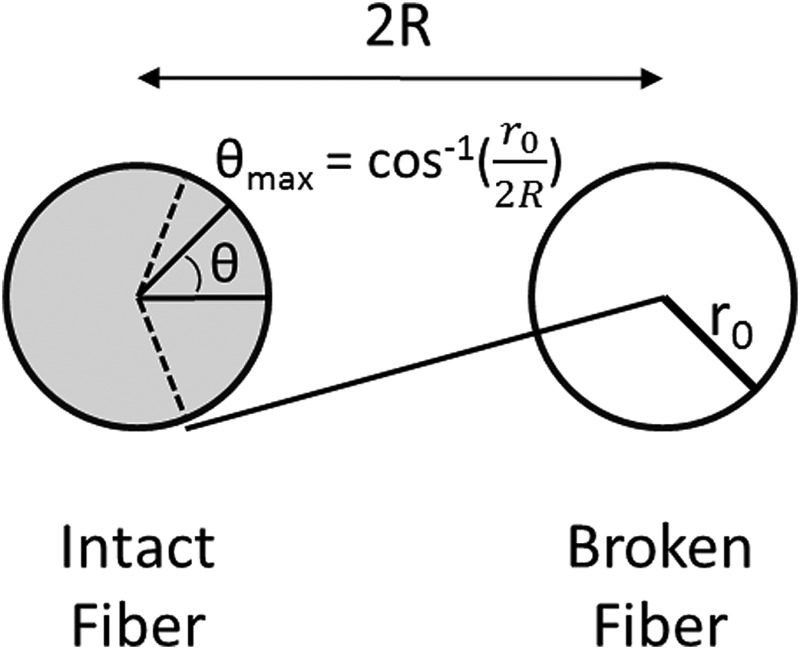
Model composite demonstrating intact and broken fibers. ranges from 0, along the line from the center of the intact fiber to the center of the broken fiber, to , at the intersection between the fiber radius and the tangent drawn from the center of the broken fiber, where . Adapted from Ref. [20].
Equations (25) and (26) are then used to compute local at every location along every intact fiber resulting from a cluster of breaks; linear superposition is assumed once again and the following formula is obtained for the overall local on the fiber:
| (27) |
The meaning of the variables is analogous to those defined for Eq. (25), referring to the intact fiber rather than to the next neighbor only. Since no specification for the shear-lag coefficient is made, either the Cox or the Nairn definition can be used; however, the latter demonstrated more favorable results in comparison with FEA data [21].
Wagner and Eitan also present an expression to calculate the maximum in the composite, regarded as the global SCF for the lacerated specimen, which is obtained by observing that Eq. (27) provides values that decrease when or values increase so that the maximum occurs at , i.e., at the cut's boundary on the first intact fiber next to the cluster of breaks
| (28) |
Eq. (28) does not include the shear-lag coefficient ; therefore approaches based on Cox's and Nairn's definitions of coincide when only the maximum stress concentration is considered. In the present study, the of the whole structure (based upon LLS assumptions) occurs on the fiber adjacent to the cut.
Based on Eqs. (25)–(28), the following expressions for the damage parameter can be defined:
| (29) |
| (30) |
Equations (29) and (30) are employed in Sec. 3 with reference to the cut tendon case; the former helps visualize the results of the application of Wagner and Eitan's model, while the latter provides results that can be related to experimental data published in Ref. [16].
3. Application to the Partially Cut Tendon Case
Tendon extracellular matrix is characterized by collagen fibrils organized into higher level structures (fibers and fascicles) and immersed in a “ground substance” composed mainly of proteoglycans, glycoproteins, and water. The terms “fiber” and “fibril” are not to be confused here. The term “fiber” has been used up to this point in compliance with the composite material nomenclature and refers to the main load bearing elements in such materials, whereas the term “fibril” refers to the smaller fibrous structures (predominantly collagen I) within tendon fibers (tendon fibers being a higher-order organizational structure). The mechanical properties of the fibril and ground substance components are very different, the former quite stiff and the latter much more compliant. Moreover, fibrils are prominently oriented along the tendon longitudinal axis such that the tissue mechanical properties are directionally dependent (stronger along the long axis). Conversely, ground substance appears to have no preferential orientation. We therefore study tendon behavior by modeling it as a fibrous composite material with long collagen fibrils interspaced by ground substance. Our study considers that the fibers in composite model terminology correspond to fibrils in tendon and the composite model matrix corresponds to the ground substance of tendon.
Determination of K 3 in a partially lacerated tendon (as a function of the percentage of cut fibrils) is attempted here by means of the three analytical models reviewed in Sec. 2. Geometrical and material parameters were obtained from the literature, with precise values of some parameters chosen after a sensitivity analysis was completed (analysis not reported in the present work). The values obtained by Wagner and Eitan's, GLS, and Hedgepeth's models are compared with published experimental results [16]. The effects the number of fibrils included in the 2D model of the studied tendon and of the fibril volume fraction, , have on K 3 are separately investigated.
3.1. Modeling of a 2D Simplified Tendon Comprised of 100 Aligned Elastic Fibrils.
The following example refers to a 2D composite material comprised of 100 aligned collagen fibrils embedded in a ground substance matrix (Fig. 4). Fibril behavior is assumed to be purely elastic (ignoring viscoelastic behavior), and higher level structures, fibril cross-linking, and crimp are neglected. The rationale for neglecting crimp is that it will be lost when the tendon is stretched enough to cause damage or rupture of the fibrils. After applying appropriate geometrical and material parameters, models will be compared based on their ability to predict the behavior of a partially torn tendon (as simulated with the published experiment [16]).
Fig. 4.
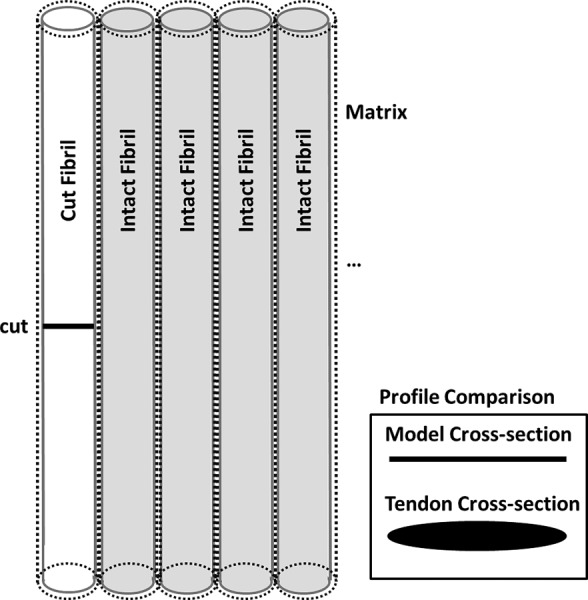
Model two-dimensional composite; this example contains multiple intact and one broken fibril. Inset illustrates the linear cross-sectional profile (compared to traditional, elliptical, three-dimensional profile of true tendon).
3.1.1. Geometrical and Material Parameters.
Geometrical and material properties for model components were obtained from the literature [30,32–36]. Wagner and Eitan's model incorporating either Cox's or Nairn's shear-lag parameter, β, requires knowledge of the geometry and composition of the considered tissue; this presents a significant complication to its application. Due to the complexity and variability in these tissues, the literature is inconsistent for material parameters and geometries. However, some meaningful ranges are provided by Herchenhan et al. [32], and ranges for fibril volume fraction can be found in studies by Lavagnino et al. [34]. Limited information is available on the sensitivity of these models to a variation in fibril and matrix volume fractions and , fibril average diameter , fibril Young's and shear moduli and , matrix Young's and shear moduli and , and stress transfer length .
Equation (27) requires estimation of in order to determine the stress distribution across the modeled composite. Several methods of determining λ c are considered in the composite literature [30], and two recent papers which apply shear-lag analysis to biological composites [22,23] follow a fully analytical approach also based on shear-lag models. In this study, a simple proportional relationship between E f /E m and λ c /d 0 in the fashion of Termonia [33,37] has been employed. This relationship provides results that are close to those obtained experimentally when a value of E f /E m = 100 is used, as in the present case [30]. An additional parameter related to must be defined to determine the distance over which a notch affects K 3 on the first uncut fibril. This parameter, called so that it can be distinguished from the corresponding initially assumed value for , is related to the distance, measured from the cut region, at which the effect of the cut is effectively negligible (or, the distance from the cut required to regain the fibril's original loading ability). It is usually assumed that a prescribed fraction of denotes the fraction of the nominal loading ability that is considered sufficiently close to a complete stress transfer. This fraction is often arbitrarily chosen [30]; values in excess of 90% are typically selected. The use of a 97% fraction, suggested by Termonia [33], is quite common in the literature. A value of 99.9% of the nominal loading ability of the tendon has been considered sufficiently close to a complete stress transfer in the present application (thus represents the distance away from the cut required to obtain 99.9% of the fibril's original loading ability).
A sensitivity analysis of parameters of Wagner and Eitan's model, using β from Cox's or Nairn's approach, was performed before their application to the cut tendon case. This analysis, not reported here, showed that the parameter with the largest influence on K 3 is the fibril volume fraction, as confirmed by Eqs. (28) and (30) where the fibrils' average distance, directly related to , is included in the computation of .
Sensitivity of the stress transfer length on multiple parameters was evaluated for the two approaches of Wagner and Eitan's model in Eq. (27). For the Cox approach, the most influential parameters are the fibril volume fraction, fibril axial Young's modulus, and matrix shear modulus. In contrast, is the most influential parameter when a Nairn approach is used, despite the fact that other geometrical and material parameters appear in the corresponding equations. A very weak dependence of on , , and is observed in this last case, with almost no dependence on or on the value assumed for . Likewise, when Cox's shear-lag coefficient is used, the dependence of on the value assumed for and on is only meaningful before a threshold is reached. More specifically, for the computed stress transfer length is almost constant with respect to a variation in . , expressed in number of fibril diameters , is plotted versus for in Fig. 5.
Fig. 5.
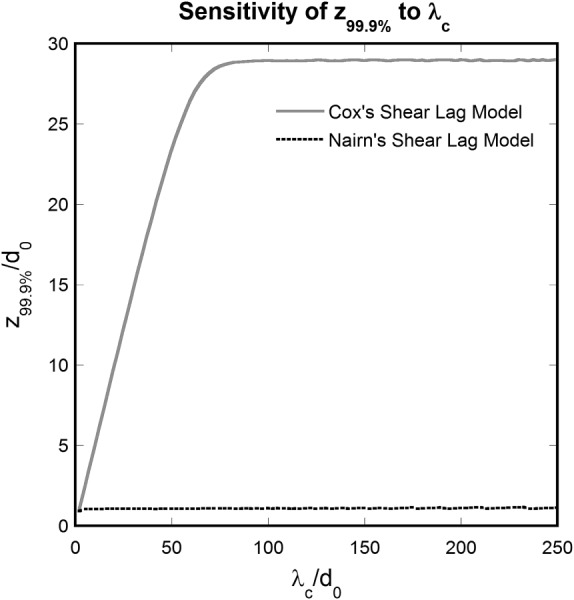
Sensitivity of to (both normalized to ) according to the Cox and Nairn models. The value assumed for is meaningful for .
Sensitivities to specific parameter changes differ between the Cox and Nairn approaches, affecting the values of K 3 along each fibril but not its local minimum. In both models, the fibrils' average diameter does not influence the values of K 3, provided that the fibril volume, which is related to it, is fixed.
Table 1 lists the parameter values used for the current application as determined from the literature and from the sensitivity analysis starting from the reference ranges provided in Ref. [32].
Table 1.
Tendon's geometric and material parameters
3.1.2. Results for a Prescribed Cut Depth.
Figure 6 shows K 3 for the lacerated tendon model as predicted by Eq. (29) when a Cox (Fig. 6(a)) or Nairn (Fig. 6(b)) approach is used, respectively. Regardless of approach, K 3 increases when moving further from the cut region in both directions, i.e., into the uncut fibril region and along each of these fibrils.
Fig. 6.
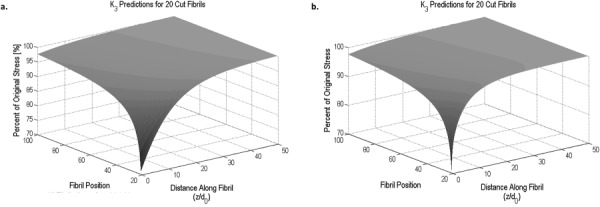
K 3 versus fibril position (number of fibrils away from the notch) and distance along the fibril normalized to fibril diameter using the (a) Cox model or (b) Nairn model shear-lag parameter with 20 cut fibrils in a simplified 100-fibril tendon model. K 3 increases with increased fibril position and distance along the fibril from the cut. The dependence on is stronger in Nairn's model.
The behavior of the surfaces shown in Fig. 6 with respect to the fibril position and distance along the fibril is further demonstrated in Figs. 7 and 8 by 2D “slices” of the 3D figures. Figure 7 shows K 3 values along the first intact fibril adjacent to the breaks; note that Nairn's model has a stronger dependence on (distance away from the cut) compared to Cox's model. This is due to different formulations for the shear-lag coefficient as a consequence of differing assumptions.
Fig. 7.
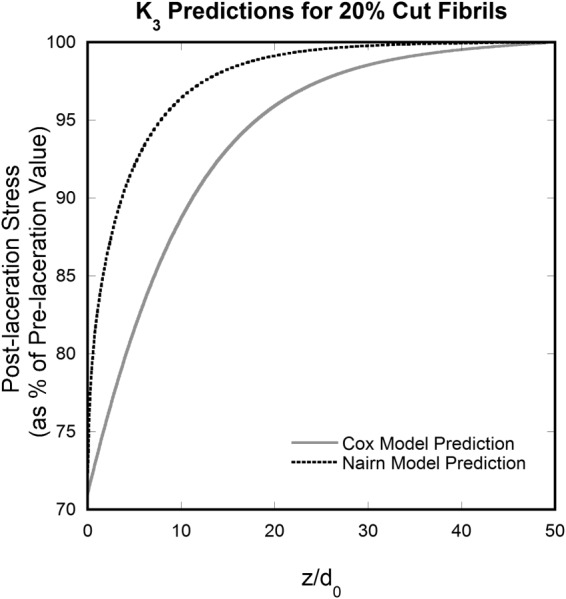
K 3 at the first intact fibril next to the notch (fibril position = 21) versus distance (along the fiber) normalized to fibril diameter calculated using Cox and Nairn models with 20 cut fibrils in a 100-fibril tendon model. The stronger dependence of Nairn's curve on can be observed.
Fig. 8.
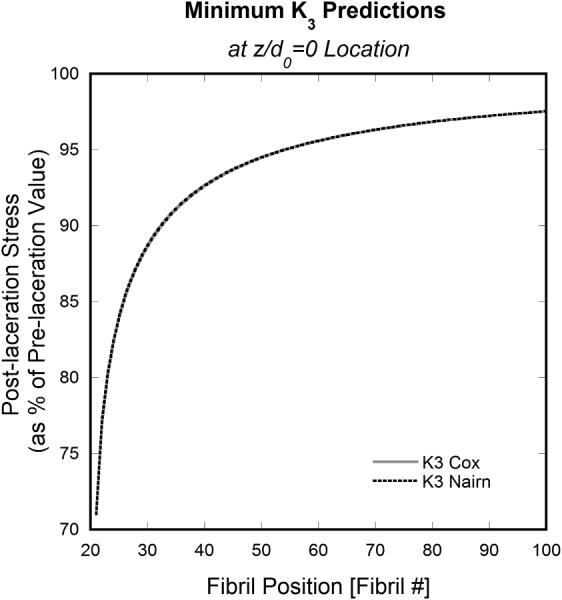
Minimum K 3 versus fibril position at calculated using Cox and Nairn models with 20 cut fibrils in a 100-fibril tendon model. The curves obtained with Cox's and Nairn's models are the same at the position .
Minimum K 3 values correspond to maximum stress concentrations, which occurs at z = 0. Therefore, Fig. 8 shows the minimum K 3 values, given as a percent of the original stress, for each of the uncut fibrils (Nos. 21–100) due to Nos. 1–20 being cut.
Figures 6–8 show the dependence of Wagner and Eitan's model, using the shear-lag formulations of both Cox and Nairn models, on the fibril position (number of fibrils away from the cut) and on (distance along the fibril away from the cut) for the case when 20 fibrils are cut in a 100-fibril model. Next, the results of the GLS, Hedgepeth, and Wagner and Eitan models for a range of cut depths will be compared to experimental data from a porcine flexor tendon with cut depths of approximately 10, 20, 50, and 65% of its CSA [16].
3.1.3. Results for Different Cut Depths: Curves.
The effect of laceration depth on a simplified tendon model with 100 fibrils is investigated and compared to experimental data [16]. Geometric and material parameters in Table 1 were employed in each of the models. The minimum values given by GLS model only require the knowledge of the percentage of cut fibrils, , while expressions given by Hedgepeth's model depend on the exact number of cut fibrils, q, and Wagner and Eitan's model depends on the number of cut fibrils, , and on the average fibril diameter, (related to the fibril volume fraction, , when the tendon size is fixed). When only the minimum K 3 is of interest (as in the current case, where the minimum determines whether cracks propagate), no distinction between Cox's and Nairn's approaches is needed since they coincide.
Figure 9 shows the effect of laceration depth for a tendon with 50% fibril volume fraction. The linearly decreasing curve provided by the GLS model is not adequate to describe the experimentally observed behavior for cut depths less than 50% of the tendon's CSA in Ref. [16]. It becomes a better approximation for deeper cuts (>50% of the tendon's CSA); however, there are only two data points in this region and more data may prove the simplistic model insufficient. Curves provided by Hedgepeth's and Wagner and Eitan's models follow the nonlinear shape of the experimental data, indicating that they should be preferred over the GLS model, especially for cuts less than 50% of the CSA. However, the two SLMs differ significantly in output values; those obtained from Hedgepeth's model were more different from the experimental data than Wagner and Eitan's in the shallow (<50% of CSA) cut region.
Fig. 9.
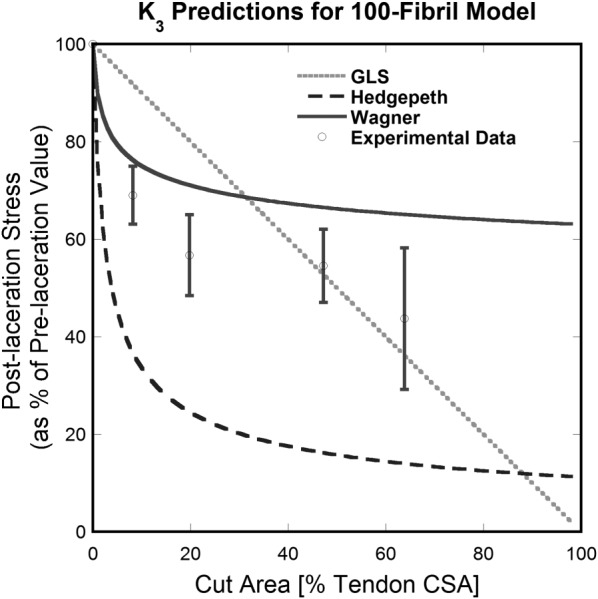
Comparison between theoretical models with 100 aligned fibrils and published experimental results [16]. Wagner and Eitan's model (Wagner) is preferred over the others in the shallow (<50% of tendon CSA) cut region. GLS is a better approximation available for deeper cuts.
3.2. Modeling of 2D Simplified Tendons With an Increasing Number of Aligned Elastic Fibrils.
GLS modeling defines the laceration in terms of a percentage of cut fibrils, which can be related to the percentage of the cross-sectional area which is cut. The SLMs depend on the absolute number of cut fibrils, which must be related to the total number of fibrils included in the model to get the percentage of cut fibrils; thus, the total number of fibrils in the SLMs will likely affect their outcome.
As Wagner and Eitan's model provides the best fit of the nonlinear experimental data behavior in a partially torn tendon among the models considered in the present study, this model will be used to investigate the effect of the model size on the minimum values of . The numbers of fibrils used for the model sizes are 10, 20, 50, 100, 200, 500, and 1000.
Figure 10 shows the effect of model size on the minimum values of for the considered laceration depths. In all four cases, the computed effectively bearable load approaches the corresponding experimental value as the number of fibrils included in the model increases. This is true especially for cut depths in the near-plateau region, i.e., 19.8% (Fig. 10(b)) and 47.2% (Fig. 10(c)) of the tendon's CSA. Here, the values predicted by the model converge upon the experimental values at high fibril numbers; lower fibril numbers result in a predicted value higher than the experimental. Model predictions for extremely shallow (8.2% tendon CSA) and extremely deep (63.8%) cuts are also improved by higher fibril numbers. Figure 10(a) shows that the model prediction for converges to a value lower than the corresponding experimental value for cuts of 8.2% of the tendon's CSA. Conversely, the model prediction obtained for the deepest cut (63.8% tendon CSA) in Fig. 10(d) converges to a value higher than the experimental data. As the predicted values became asymptotic at higher fibril numbers, model sizes greater than 1000 were not considered due to computation time.
Fig. 10.
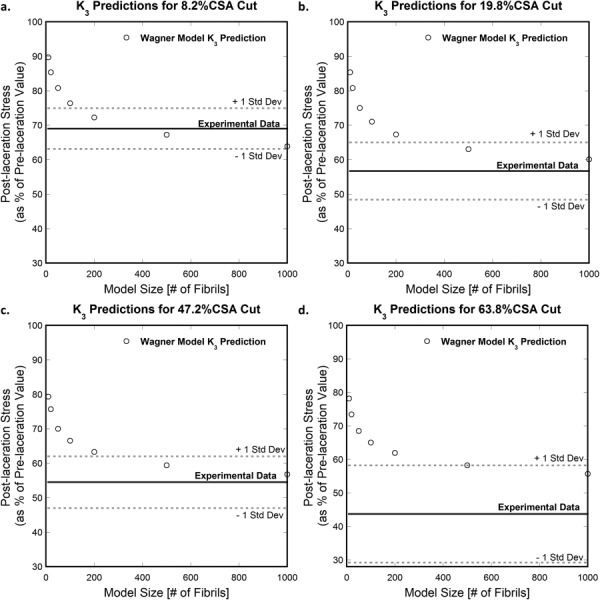
Effect of the number of fibrils included in Wagner and Eitan's model (Wagner) on the computed for cuts of depths (a) 8.2%, (b) 19.8%, (c) 47.2%, and (d) 63.8% of tendon CSA. The corresponding experimental value is also shown (mean experimental value (solid line) and one standard deviation above/below the mean (dotted lines)). The analytical result better approaches the experimental values when more fibrils are incorporated into the model (>300 fibrils), particularly in the midsize (19.8%, 47.2% tendon CSA) cut depths.
Thus, Wagner and Eitan's model best describes the behavior of a partially torn tendon when more fibrils (>300) are included in the model, and the 1000-fibril model converges on the experimental data for the middle-depth cuts.
3.3. Modeling of a 2D Simplified Tendon Comprised of 1000 Aligned Elastic Fibrils.
In a final comparison, the simplified tendon considered in Sec. 3.1 was modeled with an increased fibril number of 1000. Figure 11 shows the results of the application of GLS, Hedgepeth's, and Wagner and Eitan's models to the case of 1000 fibrils aligned in a 2D geometry, compared with the experimental values [16]. The GLS curve has not changed from the 100-fibril model as it does not depend on the number of fibrils incorporated into the model. Conversely, Hedgepeth's and Wagner and Eitan's curves have changed as a result of the increased fibril number. While the Hedgepeth predicted values deviate more from the experimental results for the larger fibril model, Wagner and Eitan's model predicted values give an improved representation of the experimental data.
Fig. 11.
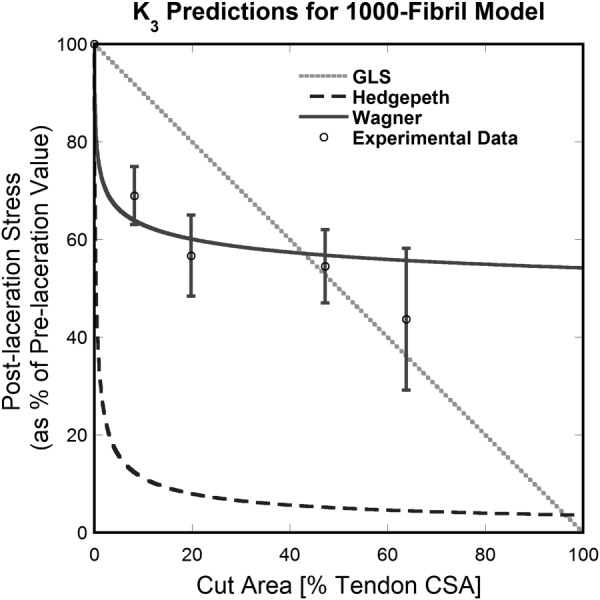
Comparison between theoretical models with 1000 aligned fibrils and published experimental results [16]. Wagner and Eitan's model (Wagner) performed best of the investigated models in the pre-50% cut region. The model has an asymptotic shape, precluding it from accurately predicting values at very high cut depths (e.g., predicted values do not go to zero after 100% of the fibrils are cut).
4. Discussion
Kondratko et al. examined the effect of partial thickness cuts on tendon mechanical behavior, demonstrating a structure with complex interactions in contrast to simple independent fibers [16]. Such interactions ubiquitously affect load distribution within a tendon when compromised by cuts, pathology, or simply during normal, but nonuniform physiologic loadings (e.g., entheses change relative orientations). The present study represents an initial, analytical attempt to explore this interesting phenomenon. We estimate the load bearing capacity in a partially cut tendon using three different theoretical methods—GLS, Hedgepeth's, and Wagner and Eitan's models—which were originally developed to predict failure in fibrous composite materials. These three methods were applied to a simplified tendon model that assumed: (1) A reduced number of aligned fibrils arranged in a 2D pattern, (2) no viscoelasticity in the tissue, and (3) linearly elastic behavior for the collagen fibrils. The presence of hierarchical structures such as fibers, bundles, and fascicles was neglected, as was the presence of crosslinking at any structural level. Material and geometrical properties of the modeled tissue were obtained from the literature.
Despite the simplicity of the tendon model, it was possible to identify Wagner and Eitan's approach as the best candidate among the three considered approaches to describe the experimental behavior of partially lacerated porcine flexor tendons [16]. The GLS model predicted a linear decrease of with increasing cut depth, which was a poor fit of the experimental data [16], especially for cut depths less than 50% of the tendon's CSA. Both shear-lag approaches account for the number of disrupted fibrils as well as geometrical and mechanical properties in the determination of ; however, results differed between the models. The Wagner and Eitan model assumes that the shear-lag effect is limited to a stress transfer length (centered at the location of the fibril break), that only a portion of each fibril's external circumference (corresponding to the fibrils' contact area) influences the residual load on each remaining fibril, and that the shear stress is variable along this portion of the circumference. Alternatively, Hedgepeth's model assumes that fibrils interact over their entire length and that is constant along each of the fibril–matrix interfaces [19]. Differences resulting from these assumptions can be observed in Figs. 9 and 11, which show that values obtained from the Wagner and Eitan's model are closer to experimental tendon behavior than values provided by GLS and Hedgepeth's models.
Wagner and Eitan's approach was then applied to a tendon model with varying number of fibrils (Sec. 3.2). For the purpose of reducing the computational time, reduced size models were considered; however, increasing the number of fibrils included in the model resulted in more accurate estimations of K 3, as can be observed when comparing Fig. 1 to Fig. 9. This suggests that a full-size model may lead to more accurate estimates, particularly in the mid-depth cut region between 20% and 50% of the tendon's CSA. With a full-size model, the maximum load that can be borne by a lacerated tendon with cut depths in this region could potentially provide mechanical insight on the 50% rule for surgical consideration.
In the shallowest cut region (less than 20% of the initial CSA), K 3 values predicted by Wagner and Eitan's model are lower than observed experimental values of mechanical compromise. In the deepest cut region (greater than 50% of tendon CSA), K 3 values predicted by Wagner and Eitan's model are higher than experimental compromise. This inconsistency may be due in part to the fact that the behavior in real tendon is variable with cut depth. One explanation for multimodal behavior in tendons with shallow cut depths relates to the formation of a fillet, a stress concentrator that has been ameliorated by increased radius of curvature [35]. When many fibrils are cut, the distance between the two severed ends in each fibril increases rapidly during tendon loading, such that the leading edge of the cut region becomes more of a fillet. The ratio between the fillet's radius and the thickness of the remaining intact portion of the tendon plays a role in determining the resulting (and, therefore, K 3). When a very shallow cut is present, the fillet is barely established due to minimal separation of the cut fibrils when load is applied. The relatively small radius results in rapid decreases in K 3. When the cut is sufficiently deep, a notable physiological fillet can be established such that the effect of the cut is better mitigated, leading K 3 to decrease much more slowly with increasing cut depth. Physiologically, such behavior would be advantageous, as the tissue spontaneously establishes a fillet to partially protect the tendon from the effect of the notch. Hierarchical structures and collagen cross-linking may also play a role in the establishment and behavior of a fillet-like structure. When the cut depth exceeds half of the tendon's CSA, the tissue appears compromised to an extent such that fillet formation no longer prevents the remaining fibrils from being progressively torn under external load, resulting in a rapid decline in K 3.
The SLMs provide physically impossible results at very large cut depths, as does not go to zero when 100% of the CSA is cut. The mathematical expressions assume fibers are always present away from the cut to share the load, which is a limitation to their application. Therefore, these models fail to capture the global effect of the cut on the behavior of the tendon.
A simple proportional relation between E f /E m and λ c /d 0, in the fashion of Termonia [33,37] has been employed in this study. This method was chosen because it provides results that are relatively close to those obtained experimentally when E f /E m = 100, however neither curve in Ref. [30] (one for the relation suggested by Termonia and one obtained using Cox's shear-lag model) quite match the experimental results. The method using the relationship obtained by Termonia was, however, a better fit. Our selection of the value for the ratio λ c/d 0 has also been supported by a sensitivity analysis, based on the evaluation of the true distance to which the load is redistributed among adjacent fibrils, as a function of the initially assumed value for λ c/d 0.
The modeling performed herein applied shear-lag at a fibril level albeit the phenomenon may occur at a different or even multiple hierarchical levels. We interpret results as proof of principle that shear-lag plays an important role in tendon behavior and not as proof of a specific fibril to fibril interaction. A comparison of the assumptions in the Wagner and Eitan's and Hedgepeth's models may provide insight into the load redistribution phenomena in a partially torn tendon and by extrapolation to other scenarios with nonuniform load distribution. Wagner and Eitan's model starts from a much more detailed set of information regarding the load redistribution in our model. Both a limited shear-interaction in the direction of fibrils' length and a limited interaction region between fibrils are assumed in Wagner and Eitan's model, which may indicate that, within a partially torn tendon, the externally applied load is shared among surviving load bearing subunits in a fashion similar to those requirements.
The simplifications introduced in our tendon model also play a role in the description of tendon behavior. For example, ignored phenomena (i.e., crosslinking between fibers or fibrils, and hierarchical structure and organization) may contribute to complex tendon behavior in the very shallow cut (<10% tendon CSA) region by altering the tissue's load redistribution to be more efficient, leading to a slower decrease in K 3 than the Wagner and Eitan model predicted. Conversely, as the cuts get deeper (larger than 50% of the tendon's CSA) and more of the native tendon structure is disrupted, the breakdown of these phenomena may result in load redistribution which is no longer effective. Furthermore, the effects of a geometry simplification to 2D and elastic assumption (ignoring the viscoelastic behavior) have not been assessed; these may have a substantial role in increasing the complexity of the tendon's behavior. Though simplified, these models are potentially reasonable to discriminate between methods in this study, increase our understanding of tendon behavior, and ultimately help determine which laceration depths warrant an operation based on predicted loading during activity.
It is worth noting that, while shear-lag models are sometimes used for long-fiber material applications, they are more widely used in short-fiber composites, though no restriction on long fibers is made in either Cox's or Nairn's derivation of shear-lag models. We represent the collagen fibrils as long fibers in our analysis, since modeling fibrils as short fibers would be a poor representation of the microstructure as Provenzano and Vanderby have previously shown ligamentous tissues to contain continuous, long collagen structures [36].
The current study represents a basic, shear-lag analysis of fibrils to describe observed behavior in a partially lacerated tendon. It introduces well-studied fibrous composite models into a new area. Future analyses would likely be improved by incorporating greater descriptive rigor from the composites literature. In particular, much effort has been devoted to the highly analogous problem of partially lacerated, highly cracked composites in which issues of local versus global load sharing are central. Although a ceramic-matrix composite is not directly analogous to tendon, basic concepts and methods introduced by Curtin [40] could be adjusted for use in future tendon models. One potential example is relating the fragmentation of each fiber in a multifiber composite to that of a single fiber embedded in a homogeneous matrix (for which a solution has been obtained) under the assumption that fibers fracture independently and that load redistribution occurs upon fiber fracture [40]. Further, developments in shear-lag modeling which account for local load sharing include the break influence superposition technique [41,42], an extension of Hedgepeth's model [19], and a formulation of the lattice Green's function technique adapted to composite failure [43]. The use of a Monte Carlo simulation model based on the 3D lattice Green's function technique, such as performed by Ibnabdeljalil and Curtin [44], may provide greater insight into future modeling applications, as this technique allows numerical analysis of relatively large composites, up to several orders of magnitude larger than is practical with finite element methods.
5. Conclusions
The present study identifies a promising analytical approach based on Wagner and Eitan's shear-lag model to describe the behavior of a partially cut tendon. Despite many simplifying assumptions, predictions are consistent with experimental observations [16] over a broad range of defect sizes. In particular, Wagner and Eitan's model best describes cut tendon behavior, among those considered in the present study, following lacerations up to 50% of the tendon's cross-sectional area. This encourages further research toward a more rigorous 3D model that incorporates the assumptions of Wagner and Eitan. However, both experimental and analytical research must be done to correlate and describe the biophysical mechanisms and hierarchical levels to be modeled.
Acknowledgment
The authors wish to thank the Alma Mater Studiorum—Università di Bologna's Overseas Program, Collegio Superiore dell'Università di Bologna, and the Indiana University's Bologna Consortial Studies Program (BCSP) that allowed Marco Pensalfini to spend the 2012-13 academic year at University of Wisconsin-Madison. Support by the National Science Foundation (Award No. 0553016) and National Institute of Health (Award Nos. EB008548 and AR059916) are gratefully acknowledged.
Appendix: Modeling of 2D Simplified Tendons With Different Fibril Volume Fractions
The effect of the fibril volume fraction on the computed on the 2D simplified tendon comprised of 100 aligned elastic fibrils defined in Sec. 3.1 is investigated here using Wagner and Eitan's model and compared to experimental data [16]. Fibril volume fraction, , is varied from 10 to 80% in 10% increments. Figure 12 shows the effect of varying fibril volume fraction. It should be noted that the effect of fibril volume on the computed was calculated using a small fibril number, and no convergence to the experimental results is observed. Rather, the model-calculated values remain higher than the experimental data, which is consistent with the results of Sec. 3.2.
Fig. 12.
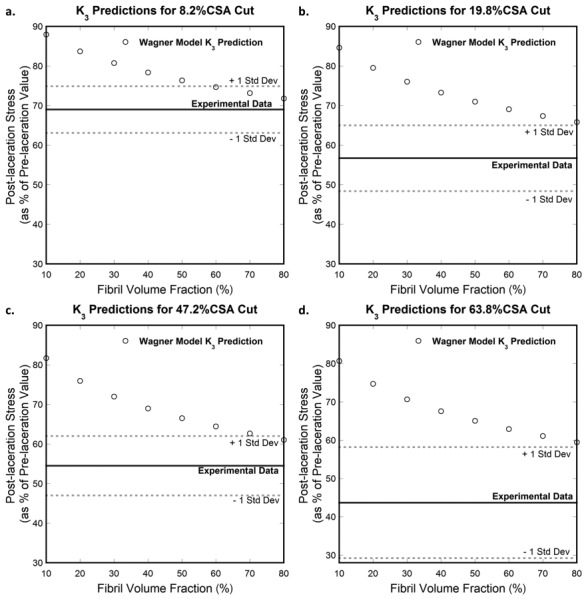
Effect of fibril volume fraction on computed with Wagner and Eitan's model (Wagner) for cut depths of (a) 8.2%, (b) 19.8%, (c) 47.2%, and (d) 63.8% of the tendon's CSA. No convergence between the model-predicted values and the experimental data is observed when fibril volume fraction is increased between 10% and 80%.
Contributor Information
Marco Pensalfini, Department of Industrial Engineering, , University of Bologna, , Bologna 33, 40126, Italy;; Department of Biomedical Engineering, , University of Wisconsin-Madison, , Madison, WI 53705
Sarah Duenwald-Kuehl, Department of Biomedical Engineering, , University of Wisconsin-Madison, , Madison, WI 53705; , Department of Orthopedic and Rehabilitation, , University of Wisconsin-Madison, , Madison, WI 53705 .
Jaclyn Kondratko-Mittnacht, Department of Biomedical Engineering, , University of Wisconsin-Madison, , Madison, WI 53705;; Department of Orthopedic and Rehabilitation, , University of Wisconsin-Madison, , Madison, WI 53705
Roderic Lakes, Department of Engineering Physics, , University of Wisconsin-Madison, , Madison, WI 53705;; Department of Materials Science, , University of Wisconsin-Madison, , Madison, WI 53705
Ray Vanderby, Department of Biomedical Engineering, , University of Wisconsin-Madison, , Madison, WI 53705;; Department of Orthopedic and Rehabilitation, , University of Wisconsin-Madison, , Madison, WI 53705; Materials Science Program, , University of Wisconsin-Madison, , Madison, WI 53705 , e-mail: vanderby@ortho.wisc.edu
References
- [1]. Mazzocca, A. D. , Rincon, L. M. , O'Connor, R. W. , Obopilwe, E. , Andersen, M. , Geaney, L. , and Arciero, R. A. , 2008, “Intra-Articular Partial-Thickness Rotator Cuff Tears,” Am. J. Sports Med., 36(1), pp. 110–116. 10.1177/0363546507307502 [DOI] [PubMed] [Google Scholar]
- [2]. Hariharan, J. S. , Diao, E. , Soejima, O. , and Lotz, J. C. , 1997, “Partial Lacerations of Human Digital Flexor Tendons: A Biomechanical Analysis,” J. Hand Surg., 22(6), pp. 1011–1015. 10.1016/S0363-5023(97)80040-8 [DOI] [PubMed] [Google Scholar]
- [3]. McCarthy, D. M. , Tramaglini, D. M. , Chan, S. S. , Schmidt, C. C. , Sotereanos, D. G. , and Herndon, J. H. , 1995, “Effect of Partial Laceration on the Structural Properties of the Canine FDP Tendon: An in Vitro Study,” J. Hand Surg., 20(5), pp. 795–800. 10.1016/S0363-5023(05)80434-4 [DOI] [PubMed] [Google Scholar]
- [4]. Bishop, A. T. , Cooney, W. P., III , and Wood, M. B. , 1986, “Treatment of Partial Flexor Tendon Lacerations: The Effect of Tenorrhaphy and Early Protected Mobilization,” J. Trauma, 26(4), pp. 301–312. 10.1097/00005373-198604000-00001 [DOI] [PubMed] [Google Scholar]
- [5]. Dobyns, R. C. , Cooney, W. C. , and Wood, M. B. , 1982, “Effect of Partial Lacerations on Canine Flexor Tendons,” Minn. Med., 65(1), pp. 27–32. [PubMed] [Google Scholar]
- [6]. Tan, J. , Wang, B. , Tan, B. , Xu, Y. , and Tang, J. B. , 2003, “Changes in Tendon Strength After Partial Cut and Effects of Running Peripheral Sutures,” J. Hand Surg. Br. Eur., 28(5), pp. 478–482. 10.1016/S0266-7681(03)00168-2 [DOI] [PubMed] [Google Scholar]
- [7]. Cordasco, F. A. , Backer, M. , Craig, E. V. , Klein, D. , and Warren, R. F. , “The Partial-Thickness Rotator Cuff Tear is Acromioplasty Without Repair Sufficient?,” Am. J. Sports Med., 30(2), pp. 257–260. [DOI] [PubMed] [Google Scholar]
- [8]. Flatow, E. L. , Altchek, D. W. , Gartsman, G. M. , Iannotti, J. P. , Miniaci, A. , Pollock, R. G. , Savoie, F. , and Warner, J. J. P. , 1997, “Atlas of Rotator Cuff Arthroscopy–Commentary,” Orthop. Clin. North Am., 28(2), pp. 277–294. 10.1016/S0030-5898(05)70286-8 [DOI] [PubMed] [Google Scholar]
- [9]. Weber, S. C. , 1997, “Arthroscopic Debridement and Acromioplasty Versus Mini-Open Repair in the Management of Significant Partial-Thickness Tears of the Rotator Cuff,” Orthop. Clin. North Am., 28(1), pp. 79–82. 10.1016/S0030-5898(05)70266-2 [DOI] [PubMed] [Google Scholar]
- [10]. Weber, S. C. , 1999, “Arthroscopic Debridement and Acromioplasty Versus Mini-Open Repair in the Treatment of Significant Partial-Thickness Rotator Cuff Tears,” Arthrosc. J. Arthrosc. Relat. Surg., 15(2), pp. 126–131. 10.1053/ar.1999.v15.0150121 [DOI] [PubMed] [Google Scholar]
- [11]. Lo, I. K. , and Burkhart, S. S. , 2004, “Transtendon Arthroscopic Repair of Partial-Thickness, Articular Surface Tears of the Rotator Cuff,” Arthrosc. J. Arthrosc. Relat. Surg., 20(2), pp. 214–220. 10.1016/j.arthro.2003.11.042 [DOI] [PubMed] [Google Scholar]
- [12]. Gartsman, G. M. , 1995, “Arthroscopic Treatment of Rotator Cuff Disease,” J. Shoulder Elbow Surg., 4(3), pp. 228–241. 10.1016/S1058-2746(05)80056-4 [DOI] [PubMed] [Google Scholar]
- [13]. Pedowitz, R. A. , Higashigawa, K. , and Nguyen, V. , 2011, “The ‘50% Rule’ in Arthroscopic and Orthopaedic Surgery,” Arthrosc. J. Arthrosc. Relat. Surg., 27(11), pp. 1584–1587. 10.1016/j.arthro.2011.06.014 [DOI] [PubMed] [Google Scholar]
- [14]. Schuind, F. , Garcia-Elias, M. , Cooney, W. P., III , and An, K.-N. , 1992, “Flexor Tendon Forces: in Vivo Measurements,” J. Hand Surg., 17(2), pp. 291–298. 10.1016/0363-5023(92)90408-H [DOI] [PubMed] [Google Scholar]
- [15]. Manning, D. W. , Spiguel, A. R. , and Mass, D. P. , 2010, “Biomechanical Analysis of Partial Flexor Tendon Lacerations in Zone II of Human Cadavers,” J. Hand Surg., 35(1), pp. 11–18. 10.1016/j.jhsa.2009.10.015 [DOI] [PubMed] [Google Scholar]
- [16]. Kondratko, J. , Duenwald-Kuehl, S. , Lakes, R. , and Vanderby, R. , 2013, “Mechanical Compromise of Partially Lacerated Flexor Tendons,” ASME J. Biomech. Eng., 135(1), p. 011001. 10.1115/1.4023092 [DOI] [PMC free article] [PubMed] [Google Scholar]
- [17]. Lemaitre, J. , 1984, “How to Use Damage Mechanics,” Nucl. Eng. Des., 80(2), pp. 233–245. 10.1016/0029-5493(84)90169-9 [DOI] [Google Scholar]
- [18]. Cox, H. L. , 1952, “The Elasticity and Strength of Paper and Other Fibrous Materials,” Br. J. Appl. Phys., 3(3), pp. 72–79. 10.1088/0508-3443/3/3/302 [DOI] [Google Scholar]
- [19]. Hedgepeth, J. M. , 1961, “Stress Concentrations in Filamentary Structures,” National Aeronautics and Space Administration, Washington DC, NASA Technical Note D-882.
- [20]. Wagner, H. D. , and Eitan, A. , 1993, “Stress Concentration Factors in Two-Dimensional Composites: Effects of Material and Geometrical Parameters,” Compos. Sci. Technol., 46(4), pp. 353–362. 10.1016/0266-3538(93)90181-F [DOI] [Google Scholar]
- [21]. Nairn, J. A. , 1997, “On the Use of Shear-Lag Methods for Analysis of Stress Transfer in Unidirectional Composites,” Mech. Mater., 26(2), pp. 63–80. 10.1016/S0167-6636(97)00023-9 [DOI] [Google Scholar]
- [22]. Ahmadzadeh, H. , Connizzo, B. K. , Freedman, B. R. , Soslowsky, L. J. , and Shenoy, V. B. , 2013, “Determining the Contribution of Glycosaminoglycans to Tendon Mechanical Properties With a Modified Shear-Lag Model,” J. Biomech., 46(14), pp. 2497–2503. 10.1016/j.jbiomech.2013.07.008 [DOI] [PMC free article] [PubMed] [Google Scholar]
- [23]. Chen, B. , Wu, P. D. , and Gao, H. , 2009, “A Characteristic Length for Stress Transfer in the Nanostructure of Biological Composites,” Compos. Sci. Technol., 69(7–8), pp. 1160–1164. 10.1016/j.compscitech.2009.02.012 [DOI] [Google Scholar]
- [24]. Hedgepeth, J. M. , and Dyke, P. V. , 1967, “Local Stress Concentrations in Imperfect Filamentary Composite Materials,” J. Compos. Mater., 1(3), pp. 294–309. 10.1177/002199836700100305 [DOI] [Google Scholar]
- [25]. Ritchie, R. O. , 1999, “Mechanisms of Fatigue-Crack Propagation in Ductile and Brittle Solids,” Int. J. Fract., 100(1), pp. 55–83. 10.1023/A:1018655917051 [DOI] [Google Scholar]
- [26]. McMeeking, R. M. , 1977, “Finite Deformation Analysis of Crack-Tip Opening in Elastic-Plastic Materials and Implications for Fracture,” J. Mech. Phys. Solids, 25(5), pp. 357–381. 10.1016/0022-5096(77)90003-5 [DOI] [Google Scholar]
- [27]. Daniels, H. E. , 1945, “The Statistical Theory of the Strength of Bundles of Threads. I,” Proc. R. Soc. London, Ser. A, 183(995), pp. 405–435. 10.1098/rspa.1945.0011 [DOI] [Google Scholar]
- [28]. Harlow, D. G. , and Phoenix, S. L. , 1978, “The Chain-of-Bundles Probability Model for the Strength of Fibrous Materials I: Analysis and Conjectures,” J. Compos. Mater., 12(2), pp. 195–214. 10.1177/002199837801200207 [DOI] [Google Scholar]
- [29]. Volkersen, O. , 1938, “Die Niektraftverteilung in Zugbeanspruchten mit Konstanten Laschenquerschritten,” Luftfahrtforschung, 15, pp. 41–47. [Google Scholar]
- [30]. Monette, L. , Anderson, M. P. , Ling, S. , and Grest, G. S. , 1992, “Effect of Modulus and Cohesive Energy on Critical Fibre Length in Fibre-Reinforced Composites,” J. Mater. Sci., 27(16), pp. 4393–4405. 10.1007/BF00541572 [DOI] [Google Scholar]
- [31]. Piggott, M. R. , 1987, “Debonding and Friction at Fibre-Polymer Interfaces. I: Criteria for Failure and Sliding,” Compos. Sci. Technol., 30(4), pp. 295–306. 10.1016/0266-3538(87)90017-0 [DOI] [Google Scholar]
- [32]. Herchenhan, A. , Kalson, N. S. , Holmes, D. F. , Hill, P. , Kadler, K. E. , and Margetts, L. , 2012, “Tenocyte Contraction Induces Crimp Formation in Tendon-Like Tissue,” Biomech. Model. Mechanobiol., 11(3–4), pp. 449–459. 10.1007/s10237-011-0324-0 [DOI] [PMC free article] [PubMed] [Google Scholar]
- [33]. Termonia, Y. , 1987, “Theoretical Study of the Stress Transfer in Single Fibre Composites,” J. Mater. Sci., 22(2), pp. 504–508. 10.1007/BF01160761 [DOI] [Google Scholar]
- [34]. Lavagnino, M. , Arnoczky, S. P. , Frank, K. , and Tian, T. , 2005, “Collagen Fibril Diameter Distribution Does not Reflect Changes in the Mechanical Properties of in Vitro Stress-Deprived Tendons,” J. Biomech., 38(1), pp. 69–75. 10.1016/j.jbiomech.2004.03.035 [DOI] [PubMed] [Google Scholar]
- [35]. Pilkey, W. D. , and Pilkey, D. F. , 2008, Peterson's Stress Concentration Factors, 3rd ed., John Wiley & Sons, New York. [Google Scholar]
- [36]. Provenzano, P. P. , and Vanderby, R., Jr. , 2006, “Collagen Fibril Morphology and Organization: Implications for Force Transmission in Ligament and Tendon,” Matrix Biol., 25(2), pp. 71–84. 10.1016/j.matbio.2005.09.005 [DOI] [PubMed] [Google Scholar]
- [37]. Termonia, Y. , 1987, “Computer Model for the Elastic Properties of Short Fibre and Particulate Filled Polymers,” J. Mater. Sci., 22(5), pp. 1733–1736. 10.1007/BF01132399 [DOI] [Google Scholar]
- [38]. James, R. , Kesturu, G. , Balian, G. , and Chhabra, A. B. , 2008, “Tendon: Biology, Biomechanics, Repair, Growth Factors, and Evolving Treatment Options,” J. Hand Surg., 33(1), pp. 102–112. 10.1016/j.jhsa.2007.09.007 [DOI] [PubMed] [Google Scholar]
- [39]. Redaelli, A. , Vesentini, S. , Soncini, M. , Vena, P. , Mantero, S. , and Montevecchi, F. M. , 2003, “Possible Role of Decorin Glycosaminoglycans in Fibril to Fibril Force Transfer in Relative Mature Tendons—A Computational Study From Molecular to Microstructural Level,” J. Biomech., 36(10), pp. 1555–1569. 10.1016/S0021-9290(03)00133-7 [DOI] [PubMed] [Google Scholar]
- [40]. Curtin, W. A. , 1991, “Theory of Mechanical Properties of Ceramic-Matrix Composites,” J. Am. Ceram. Soc., 74(11), pp. 2837–2845. 10.1111/j.1151-2916.1991.tb06852.x [DOI] [Google Scholar]
- [41]. Sastry, A. M. , and Phoenix, S. L. , 1993, “Load Redistribution Near Non-Aligned Fibre Breaks in a Two-Dimensional Unidirectional Composite Using Break-Influence Superposition,” J. Mater. Sci. Lett., 12(20), pp. 1596–1599. 10.1007/BF00627024 [DOI] [Google Scholar]
- [42]. Beyerlein, I. J. , and Phoenix, S. L. , 1996, “Stress Concentrations Around Multiple Fiber Breaks in an Elastic Matrix With Local Yielding or Debonding Using Quadratic Influence Superposition,” J. Mech. Phys. Solids, 44(12), pp. 1997–2039. 10.1016/S0022-5096(96)00068-3 [DOI] [Google Scholar]
- [43]. Zhou, S. J. , and Curtin, W. A. , 1995, “Failure of Fiber Composites: A Lattice Green Function Model,” Acta Metall. Mater., 43(8), pp. 3093–3104. 10.1016/0956-7151(95)00003-E [DOI] [Google Scholar]
- [44]. Ibnabdeljalil, M. , and Curtin, W. A. , 1997, “Strength and Reliability of Fiber-Reinforced Composites: Localized Load-Sharing and Associated Size Effects,” Int. J. Solids Struct., 34(21), pp. 2649–2668. 10.1016/S0020-7683(96)00179-5 [DOI] [Google Scholar]


