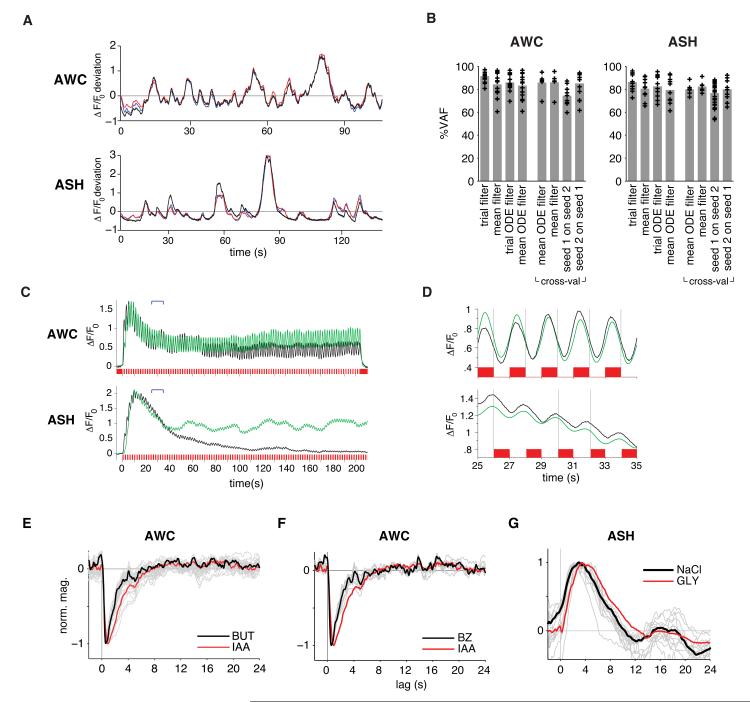
Figure 4. Linear-Nonlinear Models Capture the Dynamics of AWC and ASH Responses.
(A) Actual (black) and simulated (red, blue) responses of representative AWC and ASH neurons to fluctuating stimuli. Simulations used a full-parameter L-N model with filters estimated from trial averaged input-output records (blue) or the ODE filter model (red).
(B) Performance (%VAF, per cent variance accounted for) of simulated individual trial responses using: (1) full-parameter L-N models estimated from individual trials (2) L-N model estimated from mean trial-averaged records, (3) ODE filter L-N model estimated from individual trials, and (4) ODE filter L-N model estimated from mean trial-averaged records. Cross-val, cross-validated performance of simulating individual trial responses from held-out datasets using: (5) ODE filter L-N model estimated from mean trial-averaged records, (6) trial-averaged L-N model applied to a cross validation set, (7) mean trial-averaged L-N model applied to a hold-out set driven by a second m-sequence stimulus, and (8) mean trial-averaged L-N model estimated from the second m-sequence set tested on trials of the first m-sequence. Bars indicate average performance. n=14 for AWC, n=10 for ASH, and n=7 for both cross-validation sets.
(C) In green, simulated responses to trial-averaged 1 s ON/OFF square pulse input records using the mean ODE filter L-N model for AWC and ASH. Actual trial-averaged output records are in black (n=12 for each neuron). Brackets indicate time period excerpted in (D). The ODE models do not describe response magnitude; they were scaled to the peak response.
(D) Magnified excerpt of predicted (green) and actual (black) responses in (C) from t=25-35 seconds. Gray vertical lines divide the inset graphs into 2 s epochs aligned to stimulus transitions.
(E and F) AWC filters to butanone (1.11×10⁻⁵ M, n=27), and (F) benzaldehyde (9.8×10⁻⁴ M, n=10). Trial-averaged filters are in black and individual trial filters in grey; red is isoamyl alcohol reference.
(G) ASH filter for NaCl (500 mM, n=13). Trial-averaged filter is in black and individual trial filters in grey; red is 1 M glycerol reference.
See also Figures S4, S5, and S6.

