

Abstract
The C1 domain, which represents the recognition motif on protein kinase C for the lipophilic second messenger diacylglycerol and its ultrapotent analog the phorbol esters, has emerged as a promising therapeutic target for cancer and other indications. Potential target selectivity is markedly enhanced both because binding reflects ternary complex formation between ligand, the C1 domain, and phospholipid, and because binding drives membrane insertion of the C1 domain, permitting aspects of the C1 domain surface outside the binding site per se to influence binding energetics. Here, focusing on charged residues identified in atypical C1 domains which contribute to their loss of ligand binding activity, we show that increasing charge along the rim of the binding cleft of the protein kinase C δ C1b domain raises the requirement for anionic phospholipids. Correspondingly, it shifts the selectivity of C1 domain translocation to the plasma membrane, which is more negatively charged than internal membranes. This change in localization is most pronounced in the case of more hydrophilic ligands, which provide weaker membrane stabilization than do the more hydrophobic ligands, and thus contributes an element to the structure activity relations for C1 domain ligands. Co-expressing pairs of C1 containing constructs with differing charges each expressing a distinct fluorescent tag provided a powerful tool to demonstrate the effect of increasing charge in the C1 domain.
Keywords: protein kinase C, phorbol ester, diacylglycerol, ingenol 3-angelate
Introduction
The intracellular lipid second messenger sn-1, 2-diacylglycerol (DAG) constitutes a signaling node linking external stimuli to a broad range of critical cellular functions. DAG interacts with its downstream effectors via a specialized motif, the C1 domain. The C1 domain was first identified in the protein kinase C (PKC) family members, and these proteins continue to be the most extensively studied class of C1 domain containing proteins. [1, 2] The binding of DAG to the C1 domains of classical and novel PKCs results in conformational change of the protein leading to enzymatic activation and additionally drives association with both the plasma membrane and internal membranes. [1, 3, 4] Following the identification of C1 domains in PKCs, 6 additional families of proteins have been identified with functional C1 domains that likewise recognize DAG, linking DAG signaling to distinct effector pathways. [5-7] The chimaerins, for example, function as Rac GAPs, the RasGRP family functions as Ras GEFs, and the PKDs are kinases with specificity distinct from that of the PKCs.
The C1 domain containing proteins play central roles in cellular function and disease. Processes such as Golgi function, proliferation, migration and apoptosis, as well as tumor progression and metastasis, are regulated by these proteins. [5-8] Correspondingly, PKC has emerged as a therapeutic target of great interest for cancer and numerous other disorders, with multiple agents currently in the developmental pipeline. [9] Along with kinase inhibitors, ligands directed at the C1 domain include ingenol mebutate (PEP005 or ingenol 3-angelate), bryostatin 1, and prostratin (12-deoxyphorbol 13-acetate). [7]
Although the C1 domain has been described as a DAG recognition motif, with the structure of the ligand – C1 domain complex characterized by X-ray crystallography, [10] high affinity binding in fact represents a ternary complex of ligand – phospholipid – C1 domain, with both the phospholipid headgroups and the hydrophobic domain of the bilayer making critical contributions. [11, 12] As such, the hydrophobic elements of the ligand influence both the subcellular localization of the PKC upon translocation in response to the ligand and the biological consequences. For example, the tumor promoting ligand 12-deoxyphorbol 13-tetradecanoate drives translocation of PKCδ initially to the plasma membrane, with subsequent redistribution in part to internal membranes, whereas the more hydrophilic and non-tumor promoting 12-deoxyphorbol 13-phenylacetate, which differs only in its hydrophobicity, causes PKCδ localization to internal membranes. [13, 14] Reflecting even greater complexity, combinatorial libraries of DAG-lactones displaying structurally diverse side chain substituents showed different structure-activity relations for each of numerous distinct biological responses assayed. [15] The model which emerged was that of “chemical zip codes”, whereby the combination of side groups on the DAG-lactones resulted in localization of the interacting enzymes to different membrane subdomains to produce specific and unique downstream biological responses.
The C1 domains (C1a and C1b), located in the regulatory region of PKC, are cysteine-rich zinc finger-like structures of approximately 50 amino acids. [16, 17] The C1b domain of PKCδ in particular has provided a paradigm for this class of structures and has been extensively studied. [18, 19] For activation, the ligand binds to a hydrophilic pocket in the C1b domain. [10, 19] The surface surrounding the pocket, representing residues 9-12 of the N-terminal loop of the C1 domain and residues 21-24 of the C-terminal loop, is composed of hydrophobic and aromatic residues, and the binding of the DAG ligand completes a hydrophobic surface facilitating the insertion and stabilization of the C1 domain into the membrane. [1, 10, 18, 20] Adjacent to the hydrophobic rim, a ring of positively charged residues in the middle third of the C1b domain facilitates interactions with the phospholipid head groups, further strengthening the membrane interactions.
Mutational analysis, along with comparisons between typical C1 domains that bind DAG and so-called atypical domains that fail to bind DAG, has focused attention on key residues in the C1 domain. [18] The failure of the atypical C1 domains of PKCξ and PKCι to bind phorbol ester or DAG can be ascribed to the presence of four arginine residues in positions 7, 10, 11, and 20, positioning positively charged residues along the rim of the binding cleft. [21] The failure of the atypical C1 domain of Vav1 to bind phorbol ester or DAG, similarly, can be ascribed in part to the presence of negatively charged residues at positions 9 and 10 together with replacement of the typical positively charged residues at position 26, located in the central charge belt, with an uncharged residue. [22] Interesting, the analysis of the residues responsible for the loss of phorbol ester binding activity of Vav1 failed to show a contribution from R22, which replaced the Trp found in typical C1b domains. Replacement of W22 in the C1b domains of the novel PKCs with L22 was reported to markedly reduce the binding affinity of DAG, albeit with only a modest effect on phorbol ester binding. [23] Finally, reflecting the nature of ligand binding to the C1 domain as formation of a ternary complex between ligand, C1 domain, and phospholipid, changes in charge along the rim of the binding cleft were also associated with altered dependence on the phospholipid membrane composition. [21]
In the present paper, we have used combinations of the charge changes that are displayed in PKCξ/ι and in Vav1 to further explore (1) the influence of charge on ligand binding by the C1b domain of PKCδ, (2) the dependence of these effects on phospholipid composition, and (3) the degree to which the lipophilicity of the ligand influences responsiveness. Our results suggest that more hydrophilic ligands will be most sensitive to the effects of C1 domain and phospholipid charge and may thus display unique biology.
Results and Discussion
The influence of charge on δC1b ligand binding affinity and lipid dependency
Both for PKCξ/ι and for Vav1, the failure of their C1 domains to bind phorbol ester could largely be ascribed to the addition of positive or negative charged residues, respectively, along the rim of the ligand binding cleft. [21, 22] Interestingly, the presence in the C1 domain of Vav1 of an Arg residue in place of the typically conserved Trp at position 22 was found to have little influence on phorbol ester binding activity. [22] This was consistent with the lack of effect on phorbol ester binding of W22Y and W22K substitutions in the C1b domain of PKCδ. [20] On the other hand, a Trp residue at position 22 had been described as key for high affinity interactions of DAG, but not phorbol ester, with typical C1 domains. [23]
To better explore the role of W22 in phorbol ester binding and the influence of increasing charge in δC1b and its effect on ligand and membrane interactions, we mutated key residues in the binding cleft (as depicted in Figure 1A). Residues 7 and 10 are substituted with Arg in the atypical C1 domain of PKCξ/ι; residue 22 in Vav1 is replaced with Arg, while the Lys at position 26 of Vav1 is replaced with Tyr. The first three of these residues are situated at the tips of the loops in the binding cleft, where hydrophobicity is thought to drive membrane insertion. The fourth is part of a charged ring of residues thought to interact with the charged phospholipid headgroups. All these changes would be predicted to contribute to the destabilization of the C1-ligand complex with the lipid membrane (residues indicated in Figure 1B). To assess the influence of these residues, we prepared mutants of the δC1b domain possessing, at these four positions, either zero charge (Lys substituted at position 26), a single charge (WT), a double charge (single Arg substitution at position 7, 10 or 22), or a triple charge (double Arg substitutions at positions 22 and 7 or 10), which we then expressed as GST and GFP fusion constructs.
Figure 1. The sequence and structure of the PKCδ C1b domain.
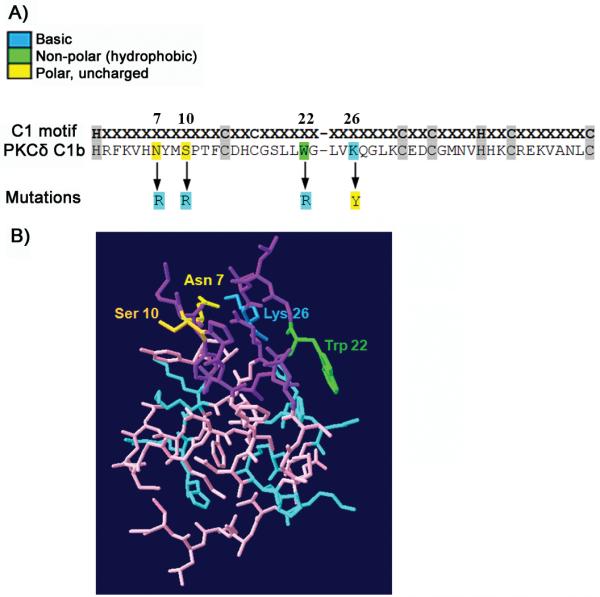
A) The sequence of the wild type PKCδ C1b domain is shown together with the locations of the mutations and changes of the amino acids in the different positive charge mutants which were examined. B) A 3D crystal representation of the C1b domain. Residues lining the phorbol ester binding site are indicated in purple; positively charged residues are indicated in blue. Key amino acids for this study (they are also part of the phorbol ester binding site) are colored and labeled.
The significance of the Trp at position 22 of the δC1b domain in the binding affinity for PDBu in vitro
Previous reports had suggested that the Trp at position 22 was important for ligand affinity. The mutation of Tyr to Trp at position 22 in the cPKCs greatly increased the affinity for DAG and had modest effects on the affinity for PMA. [23] We wanted to further investigate the contribution of W22 in δC1b to phorbol ester binding affinity. Trp at position 22 was mutated to either a polar uncharged residue, a basic residue, or an acidic residue and mutants were monitored for binding affinity for PDBu in vitro. Substituting W22 for a polar or basic residue (W22Y, W22T, W22R, and W22K) had only modest effects on PDBu binding (Table 1). Substitution with an acidic residue (W22D and W22E), on the other hand, resulted in severe defects in δC1b binding to PDBu (Table 1). This large effect of an acidic residue at W22 contrasts with a rather smaller (10-fold) effect when M9 or S10 had been replaced with Asp.[22] We conclude that the presence of a hydrophobic residue at position 22 (such as a Trp) does not appear to be important for phorbol ester interaction. A potential explanation is that under our conditions of binding, with 100% phosphatidylserine as the lipid and PDBu as the ligand, the membrane interactions are already so strong as to overwhelm the contribution from the W22 to membrane interaction.
Table 1.
Effect of substitutions at residue W22 on the in vitro binding affinities of [3H]PDBu for the PKCδ C1b domain.
| Receptor PKCδ C1b | Charge Effect | Kd (nM) | Relative to PKCδ C1b wild-type |
|---|---|---|---|
| PKCδ C1b WT | 0.19 ± 0.005 | 1 | |
| PKCδ C1b W22Y | Polar (uncharged) | 0.28 ± 0.05 | 1.47 x |
| PKCδ C1b W22T | Polar (uncharged) | 0.37±0.02 | 1.95x |
| PKCδ C1b W22R | Basic | 0.16 ± 0.02[a] | 0.84 x |
| PKCδ C1b W22K | Basic | 0.31 ±0.04 | 1.63x |
| PKCδ C1b W22D | Acidic | 204 ± 11 | 1073x |
| PKCδ C1b W22E | Acidic | 160 ± 4.7 | 842 x |
The Trp residue at position 22 of PKCδC1b was mutated, individual C1 domains fused to GST were isolated, and binding of [3H]PDBu to each was measured. Values shown are the means ± SEM from 3 independent experiments.
From Geczy et al., 2012[22]
The effect of lipid content on the δC1b charge mutants affinity for PDBu and DOG in vitro
Charge in the δC1b domain can influence interactions of the C1-ligand complex with the phospholipid bilayer. In particular, positive charges may strengthen interactions with the negatively charged PS in lipid membranes. The important role of such interactions between negatively charged membranes, resulting from their content of PS, PA, and PIP2, has been elegantly demonstrated by Yeung et al. [24] We therefore examined the binding of PDBu and DOG to the series of δC1b variants in the presence of PS/PC phospholipid mixtures with variable proportions of PS while total phospholipid was held constant at 100 μg/ml. The absence of charge in the binding cleft of δC1b (K26Y) decreased the dependency on PS for phorbol ester binding. The Kd value for the K26Y mutation changed little between 100% PS and 10% PS concentrations (Table 2). The K26Y mutant also revealed only minor changes in DOG affinity when the PS content varied, compared to a greater effect on binding by the wild-type (Table 3). The minimal effects of PS content on ligand binding in the K26Y mutant is apparent when the ratio of ligand binding at 10% PS is compared to 30% PS, the value is close to 1 for PDBu and DOG (Figure 2). Increasing the number of positive charges led to generally weaker binding affinity for both PDBu and DOG at 10% PS concentrations compared to 30% PS (Figure 2, Tables 2 and 3, and Supplemental figure 1.). Although the trends were similar, DOG binding showed somewhat greater dependence on PS concentration than did PDBu. Additionally, the W22 mutant was associated with a greater decrease in affinity for DOG (13.2 fold relative to wild-type) than for PDBu, which showed almost no change. Finally, the N7RW22R differed from the others in having better affinity at 30% PS than at either 10% PS or 100% PS.
Table 2.
Influence of phospholipid composition on the binding of [3H]PDBu to wild-type and δC1b mutants
| Receptor (PKCδ Clb) | Kd (nM) on l0% PS | Relative to l00% PS | Kd (nM) on 30% PS | Relative to l00% PS | Kd (nM) on l00% PS | No. of positive charges |
|---|---|---|---|---|---|---|
| K26Y | 1. 09 ± 0.16 | 1.1 x | 0.66 ± 0.03 | 0.68 x | 0.97 ± 0.10[a] | 0 |
| WT | 0.78 ± 0.08 | 4.0 x | 0.31 ± 0.01 | 1.6x | 0.193 ± 0.005 | 1 |
| Sl0R | 1.44 ±0.40 | 10 x | 0.19 ±0.03 | 1.4 x | 0.14 ±0.03 | 2 |
| N7R | 20.1 ±4.8 | 9.4 x | 3.04 ±0.53 | 1.4 x | 2.13 ±0.33 | 2 |
| W22R | 7.35 ± 0.34 | 46 x | 0.71 ± 0.12 | 4.4 x | 0.16 ± 0.02[a] | 2 |
| S10RW22R | 2.37 ± 0.05 | 28 x | 0.19 ± 0.03 | 2.2 x | 0.085 ± 0.001 | 3 |
| N7RW22R | 34.7 ± 1.4 | 2.0 x | 2.36 ± 0.18 | 0.1 x | 17.6 ± 1.2 | 3 |
The binding affinities of [3H]PDBu to purified wild-type and mutant GST-PKCδ C1b domains were measured in the presence of the indicated proportions of PS in PS/PC phospholipid mixtures at a fixed total phospholipid concentration of 100 μg/ml. The Kd value relative to that in 100% PS is displayed. The number of positive charges in the binding cleft of each mutant is also shown. Values shown are the means ± SEM for n = 3 experiments.
From Geczy et al., 2012[22]
Table 3.
Influence of phospholipid composition on the binding affinities of DOG for wild-type and δC1b mutants.
| Receptor (PKCδ Clb) | Ki (nM) on l0% PS | Relative to l00% PS | Ki (nM) on 30% PS | Relative to l00% PS | Ki (nM) on l00% PS | No. of positive charges |
|---|---|---|---|---|---|---|
| K26Y | 213 ±31 | 2 x | 67.9 ± 1.3 | 0.64 x | 106 ± 25 | 0 |
| WT | 63.3 ± 16.3 | 12 x | 11.1 ± 1.7 | 2.1 x | 5.3 ± 0.6 | 1 |
| Sl0R | 62.7 ± 4.9 | 17 x | 12.5 ± 1.0 | 3.4 x | 3.7 ± 0.9 | 2 |
| N7R | 791 ± 80 | 36 x | 55.2 ± 4.8 | 2.5 x | 21.8 ± 0.7 | 2 |
| W22R | 11873 ± 2754 | 169 x | 470 ± 74 | 6.7 x | 70.1 ±15.9 | 2 |
| S10RW22R | 3113 ± 948 | 133 x | 126 ±18 | 5.5 x | 23.4 ± 2.9 | 3 |
| N7RW22R | 20432 ± 3133 | 11 x | 983 ± 64 | 0.5 x | 1807 ± 103 | 3 |
The binding affinities of DOG to purified wild-type and mutant GST-PKCδ C1b domains were measured in the presence of the indicated proportions of PS in PS/PC phospholipid mixtures at a fixed total phospholipid concentration of 100 μg/ml. The Ki value relative to that in 100% PS is displayed. The number of positive charges in the binding cleft of each mutant is also shown. Values shown are the means ± SEM for n = 3 experiments.
Figure 2. Comparing the binding affinities of PDBu and DOG when the charge is varied in the C1b domain.
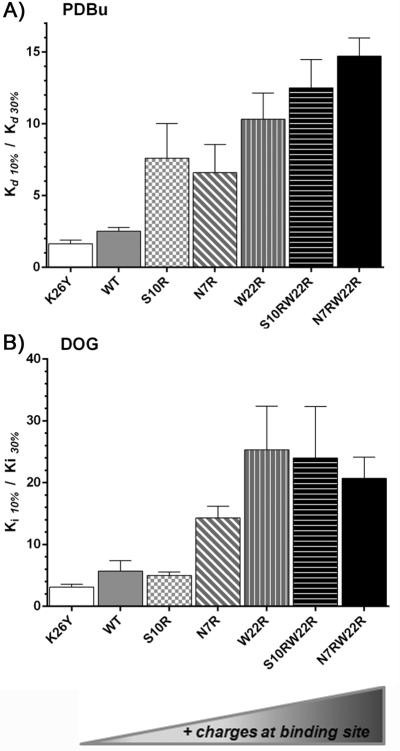
A) The binding of [3H]PDBu to purified wild type or mutant GST-PKCδ C1b domains was measured in the presence of PS:PC mixtures containing 10% and 30% PS and the ratios of the binding affinities in the two conditions are displayed. B) The binding of DOG to the purified wild type or mutant GST-PKCδ C1b domains was measured by competition with [3H]PDBu in the presence of PS:PC mixtures containing 10% and 30% PS and the ratios of the binding affinities in the two conditions are displayed. Values shown are the mean ± SEM of triplicate experiments.
The effect of variable PS concentrations on phorbol ester binding was examined in more detail under conditions of a fixed [3H]PDBu concentration (approximately 2 nm) and fixed total phospholipid (Figure 3). At low (5%) PS content the zero charge δC1b mutant (K26Y) and the WT showed much higher binding than did the others. Over the range of 10-25% PS content the δC1b charge mutants gained binding efficiency and reached a level similar to that of the WT. At 50-70% PS content all charge mutants had improved binding affinity for PDBu compared to WT (Figure 3). Finally, consistent with the measurements of Kd, binding efficiency of the N7RW22R mutant decreased as the PS content was further raised to 100%.
Figure 3. The effect of varying charge in the C1b domain on the dependence on phospholipid composition of [3H]PDBu binding.

The binding of [3H]PDBu to purified wild-type and charge mutants of the GST-PKCδ C1b domain was measured at a fixed [3H]PDBu concentration (approximately 2 nM) in the presence of 100 μg/ml of the indicated PS/PC phospholipid mixtures. The charges at the binding site were 0 charge (K26Y), 1 charge (WT), 2 charges (W22R), and 3 charges (S10RW22R and N7RW22R). The percent of bound [3H]PDBu for each C1b domain was normalized to the maximal value obtained for that domain at the optimal PS/PC composition. Values represent the mean ± SEM of at least 3 independent experiments.
Direct comparison of the liposome binding ability of the δC1b charge mutants in vitro
The above assays were necessarily dependent on the presence of the phorbol ester [3H]PDBu along with the phospholipid. To examine the influence of charge on the binding of the various δC1b mutants to phospholipids in the presence of other ligands, interactions were measured by surface plasmon resonance (SPR). The δC1b domains were immobilized and liposomes containing 20% PS were injected over the surface in the presence of no ligand, PMA, or DOG (Figure 4). Under each of the three conditions, the WT and the K26Y mutant showed the best binding, with appreciably less binding displayed by the W22R, N7RW22R, and S10RW22R mutant. Little difference was found between the W22R and the N7RW22R or S10RW22R mutants. Appreciable lipid binding was found in the absence of ligand for the WT and the K26Y mutant. All mutants showed enhanced lipid binding in the presence of either PMA or DOG. For the W22R, N7RW22R, and the S10RW22R mutants, lipid binding was less in the presence of DOG compared to PMA but was still substantially elevated compared to binding in the absence of ligand.
Figure 4. SPR analysis of the binding to liposomes of the wild-type and mutant δC1b domains.

The binding of liposomes containing 20% PS:80% PC to immobilized δC1b domains was measured by SPR in the presence of A) no ligand, B) PMA (3.85 mol% ), or C) DOG (5 mol%). Binding curves are representative of 3 independent experiments. The arrow bar indicates the duration of liposome injection. D) The bar graph displays the mean ± SEM from the 3 independent experiments. The binding values were corrected for background binding to the control surface and normalized to the amount of captured protein.
The effect of charge in the PKCδ C1b domain on translocation in response to ligands with different lipophilicities
The individual response of each full length mutant to ligands with varying lipophilicities
Membrane association depends not only on hydrophobic interactions of the C1 domain with the membrane but also on the additional hydrophobic contributions of the ligand. We have described previously that ligand hydrophobicity is a major factor influencing the pattern and kinetics of PKCδ translocation, [20, 25] although other features of the ligand are also important. [26] The tumor promoting phorbol derivative 12-deoxyphorbol 13-tetradecanoate induced PKCδ translocation in a fashion similar to that by PMA. Both caused PKCδ to translocate initially to the plasma membrane, with subsequent partial relocalization to internal membranes. The more hydrophilic 12-deoxyphorbol 13-phenylacetate, which has the opposite activity to PMA and functions as an inhibitor of tumor promotion, caused PKCδ to localize to internal membranes and the nuclear membrane. [13]
The plasma membrane is relatively rich in phosphatidylserine and other anionic lipids compared to internal membranes. We would therefore predict, based on the higher PS requirement for membrane binding by the more positively charged δC1b mutants, that these latter mutants might preferentially translocate to the plasma membrane in response to ligands under limiting conditions whereas the less positively charged WT and K26Y mutant would show less selectivity. Additionally, based on the reduced contribution to membrane stabilization that the more hydrophilic ligands would confer, we would predict that the differences in localization as a function of δC1b charge would be greater with such ligands and less evident with a more hydrophobic ligand such as PMA.
To test these predictions, full length PKCδ mutants containing C1b domain charge mutations were examined for their translocation patterns in response to ligands of varying lipophilicities. The GFP-tagged PKCδ constructs contained either a wild-type C1b domain (1 charge) or a δC1b domain either with K26Y (0 charge), with W22R, S10R, or N7R (2 charges), or with S10RW22R or N7RW22R (3 charges). Transfected cells were incubated with PMA, ingenol 3-angelate (I3A), bryostatin 1 (Bryo), and PDBu and the pattern of GFP expression was visualized in real time by confocal microscopy. Time points at 0 minutes (before ligand addition) and 5 minutes after ligand addition are shown (Figures 5-8). Prior to exposure to the ligands the constructs displayed a mostly uniform expression throughout the membrane and cytoplasm, with an average membrane to cytoplasm ratio ranging from 0.86 to 0.96, depending on the construct (Supplemental Table 1). In response to PMA, all PKCδ-GFP mutants localized to the plasma membrane of the cell (Figure 5). A large increase in the concentration of protein on the plasma membrane versus cytoplasm was seen after 5 minutes, yielding membrane to cytoplasm ratios of 5-10 (Figure 5B). Almost no significant differences were detected in translocation between the mutants. After 5 minutes all mutants displayed a significant change in localization to the plasma membrane when compared to the ratio at 0 minutes. To assess the extent of localization to internal membranes of the GFP-PKCδ constructs, we also determined the uniformity of distribution within the cytoplasm. This was quantitated as the standard deviation in the signal strength from pixel to pixel within the cytoplasm. The lack of translocation to internal membranes for all mutants in response to PMA was reflected by a low standard deviation (SD) of the signal intensity in selected intracellular regions (Figure 5C). For PMA and other hydrophobic ligands, we have described that the pattern of PKCδ localization is affected by the slow penetration of the ligand; it first accumulates in the plasma membrane and only slowly redistributes to the internal membranes. [27]
Figure 5. Phorbol 12-myristate 13-acetate (PMA) induced translocation of PKCδ-GFP charge mutants in LNCaP cells.

A) Fluorescent images of the PKCδ-GFP charge mutants are displayed as indicated. Representative images at times 0 and 5 min after addition of PMA are shown. Scale bars indicate 10 μm. B) The translocation of PKCδ from cytoplasm to membrane was quantitated by calculating the ratio of PKCδ in the membrane to that in the cytoplasm at 5 minutes after PMA addition. For comparison, the ratios at time 0 for all constructs were within the range 0.86 – 0.96 (supplemental Table 1). C) The extent of clumping of the constructs in the cytoplasm in response to PMA was quantitated by measurement of the variation in the cytoplasmic pixel signal intensity, expressed as the standard deviation (SD), at 5 min relative to that at 0 min. An increase in standard deviation indicates increased clumping of the GFP-labeled protein. Values in B) and C) represent the mean ± SEM derived from a single cell in each of at least 3 separate experiments. ‘*’ indicates significance from the zero charged mutant, K26Y. All mutants displayed a significant increase in the ratio of plasma membrane localization compared to the cytosplasm at 5 min versus 0 min.
Figure 8. Phorbol 12,13-dibutyrate (PDBu) induced translocation of PKCδ-GFP charge mutants in LNCaP cells.

A) Fluorescent images of the PKCδ-GFP charge mutants are displayed as indicated. Representative images at times 0 and 5 minutes after induction with PDBu are shown. Scale bars indicate 10 μm. B) The translocation of PKCδ from cytoplasm to membrane was quantitated by calculating the ratio of PKCδ in the membrane to that in the cytoplasm at 5 minutes after PDBu addition. For comparison, the ratios at time 0 for all constructs were within the range 0.86 – 0.96 (supplemental Table 1). C) The extent of clumping of the constructs in the cytoplasm in response to PDBu was quantitated by measurement of the variation in the cytoplasmic pixel signal intensity, expressed as the standard deviation (SD), at 5 min relative to that at 0 min. An increase in standard deviation indicates increased clumping of the GFP-labeled protein. Values in B) and C) represent the mean ± S.E. derived from 1 cell in at least 3 separate experiments. ‘*’ indicates significance from the zero charged mutant, K26Y.
More hydrophilic ligands, in contrast to PMA, rapidly equilibrate throughout the cell, allowing the PKCδ distribution to reflect the selectivity of the PKCδ for the ligand in the setting of the variable membrane compositions. [27] In response to compounds that were more hydrophilic (I3A, PDBu, and bryostatin 1) than PMA the PKCδ charge mutants showed differential localization, depending on their charge. This pattern was clearest for ingenol 3-angelate (Figure 6). Additional charges in the C1 domains caused an increased localization to the plasma membrane, as predicted, while the zero charged mutant, K26Y, and the WT (1 charge) did not. This was evident both visually (Figure 6A) and as quantitated from the ratio of localization at the plasma membrane versus the cytoplasm (Figure 6B). For K26Y and WT at 5 minutes, in contrast, there was increased localization to internal membranes, as reflected in an increased variation in cytoplasmic signal intensity, for which the SD provides a quantitative measure, while the mutants with increased charge showed no change or a decrease, reflecting the conflicting effects of depletion from the cytoplasm upon plasma membrane translocation and localization of the remaining PKC to the internal membranes.
Figure 6. Ingenol 3-angelate (I3A) induced translocation of PKCδ-GFP charge mutants in LNCaP cells.

A) Fluorescent images of the PKCδ-GFP charge mutants are displayed as indicated. Representative images at times 0 and 5 minutes after treatment with I3A are shown. Scale bars indicate 10 μm. B) The translocation of PKCδ from cytoplasm to membrane was quantitated by calculating the ratio of PKCδ in the membrane to that in the cytoplasm at 5 minutes after I3A addition. For comparison, the ratios at time 0 for all constructs were within the range 0.86 – 0.96 (supplemental Table 1). C) The extent of clumping of the constructs in the cytoplasm in response to I3A was quantitated by measurement of the variation in the cytoplasmic pixel signal intensity, expressed as the standard deviation (SD), at 5 min relative to that at 0 min. An increase in standard deviation indicates increased clumping of the GFP-labeled protein. Values in B) and C) represent the mean ± SEM derived from a single cell in each of at least 3 separate experiments. ‘*’ indicates significance from the zero charged mutant, K26Y.
In response to bryostatin 1 and phorbol 12,13-dibutyrate, the charged mutants showed generally enhanced plasma membrane translocation but with the W22R mutant being relatively disfavored (Figures 7 and 8).
Figure 7. Bryostatin 1 (Bryo) induced translocation of PKCδ-GFP charge mutants in LNCaP cells.

A) Fluorescent images of the PKCδ-GFP charge mutants are displayed as indicated. Representative images at times 0 and 5 minutes after induction with Bryo are shown. Scale bars indicate 10 μm. B) The translocation of PKCδ from cytoplasm to membrane was quantitated by calculating the ratio of PKCδ in the membrane to that in the cytoplasm at 5 minutes after Bryo addition. For comparison, the ratios at time 0 for all constructs were within the range 0.86 – 0.96 (supplemental Table 1). C) The extent of clumping of the constructs in the cytoplasm in response to Bryo was quantitated by measurement of the variation in the cytoplasmic pixel signal intensity, expressed as the standard deviation (SD), at 5 min relative to that at 0 min. An increase in standard deviation indicates increased clumping of the GFP-labeled protein. Values in B) and C) represent the mean ± S.E. derived from 1 cell in at least 3 separate experiments. ‘*’ indicates significance from the zero charged mutant, K26Y.
The differential translocation of mutants with different charges in response to ligands
Comparison of the images for cells bearing constructs differing in charge argues strongly for the influence of the C1b domain on the pattern of localization. An even more powerful comparison was possible upon co-expression of two C1b constructs differing in the charge of the C1b domain and bearing visually distinct fluorescent tags (red and green). This approach controls for individual differences among the cells themselves or for changes in the intracellular distribution of ligand with time. Figure 9 illustrates the differential effects on localization of the K26Y and N7RW22R mutants in response to three ligands, prostratin, sapintoxin D, and PMA, which span multiple orders of magnitude in lipophilicity. Both mutants showed uniform cytoplasmic expression when no ligand was present (Figure 9). This was seen by the predominant yellow color, representing the colocalization of the green and red labeled mutant constructs. When the cells were exposed to a more hydrophilic ligand (prostratin or sapintoxin D) a separation of colors was seen. The green labeled triple charge mutant, N7RW22R, left the cytoplasm and preferentially moved to the plasma membrane. The red labeled zero charged mutant, K26Y, lost its uniform distribution and localized to patchy areas in the cytoplasm. In contrast to prostratin and sapintoxin D, the very lipophilic PMA drove both mutants out of the cytoplasm and to the plasma membrane regardless of charge.
Figure 9. Differential distribution of the K26Y and N7RW22R mutants in response to addition of ligands of differing lipophilicities in LNCaP cells expressing both mutants of C1b domain.

A) Comparison of the lipophilicity of prostratin, sapintoxin D, and PMA indicated by their cLogP values. B) The distribution of the K26Y (zero charge) and N7RW22R (+3 charge) mutants of PKCδ tagged with the red or green fluorescent proteins, respectively, at 0 and 10 min after addition of prostratin (30 μM), sapintoxin D (1 μM), or PMA (1 μM) as indicated. Yellow pixels reflect the colocalization of both mutants. At least 3 independent experiments were performed and representative images are shown. Scale bars indicate 10 μm. C) Quantitation of the relative areas of red, green, and yellow pixels in the membrane and in the cytoplasm at 0 min and 10 min of exposure to prostratin, sapintoxin D, and PMA (see Methods for details of scoring). Data show the mean ± SEM from a single cell in each of at least 3 separate experiments.
Co-labeling charge mutants and internal membrane markers
The translocation of PKCδ to different cellular compartments may result in activation of different downstream signaling pathways. The more lipophilic ligands appear to drive PKCδ regardless of C1 domain charge, at least in part, to the plasma membrane. We wanted to determine if there were any differences in the subcellular compartments to which PKCδ localized depending on the number of charges in its C1 domain. Specific subcellular membrane compartments were labeled with appropriate membrane markers [28, 29] and full length PKCδ constructs with charge mutant C1b domains were labeled with complementary color variants. Differences in internal membrane localization between charge mutants were then examined. I3A was utilized to initiate translocation because it induced significantly different translocation of PKCδ mutants depending on the number of charges in the C1 domain. In response to I3A, WT PKCδ and the zero charge mutant, K26Y, localized to the ER, lysosomal, and Golgi compartments of the internal membrane system, as evidenced by the yellow color (Figure 10). The triple charged mutant, on the other hand, localized only to lysosomes (Figure 10). Little, if any, colocalization was apparent when the translocated N7RW22R was expressed along with labeled ER or Golgi. Quantitation of the images confirmed these results (Figure 10D). An increase in the Pearson's Coefficient of colocalization of WT and K26Y PKCδ with the internal membrane markers for ER and Golgi was found, while significant colocalization of N7RW22R only occurred with the lysosomal compartment. [30, 31]
Figure 10. Ingenol 3-angelate induced localization of charge mutants to internal membranes.

LNCaP cells were transfected with full length PKCδ containing the WT or either K26Y or N7RW22R mutant C1b domains. Cells were labeled with either an ER (endoplasmic reticulum), lysosomal or Golgi marker and then exposed to I3A for 10-15 minutes. A) Comparison of the localization of the GFP labeled PKCδ constructs with that of a red ER marker. B) Comparison of the localization of the GFP labeled PCKδ constructs and a red lysosomal marker. C) Comparison of the localization of the mCherry (red) labeled PKCδ constructs and a green Golgi marker. Scale bars represent 10 μm. D) The Pearson's correlation coefficient values calculated for the PKCδ constructs and the ER, lysosomes, and Golgi (for details see Methods). Cells were exposed to I3A for at least 5 min before images were taken. Calculations are the mean ± S.D. from 2-4 cells from each of 3 separate experiments. ‘*’ Indicates significance from both K26Y and WT.
Conclusions
The complexity of the target site for ligands binding to C1 domains provides extraordinary opportunities, along with significant challenges, for drug development. X-ray crystallography of phorbol ester complexed with the C1b domain of PKCδ has provided detailed understanding of the binary ligand – C1 domain complex. [10] Natural products have afforded a tantalizing view of the diverse structural solutions – diacylglycerol, diterpene (phorbol ester, triterpene (iridal), indole alkaloid (teleocidin), polyacetate (aplysiatoxin), and macrocyclic lactone (bryostatin) – that can attain high binding affinity for these C1 domains. [7] Binding, however, is not simply formation of a binary complex. Rather, the phospholipid bilayer provides the third and critical element for high affinity ligand interaction, with the phospholipid representing a half-site for the binding interaction along with the C1 domain. [11, 12] Thus, the full breadth of membrane compositional diversity, both at the level of different cellular membranes, and at the level of subdomains within a given membrane, has the potential to contribute to diversity of ligand recognition.
Multiple factors may contribute to the extent of diversity provided by participation of the membrane in the formation of the ternary complex. At the direct level of complex formation, modeling has suggested that ligands may exploit different orientations in their binding interactions, positioning groups not directly interacting with the C1 domain in different orientations relative to the C1 domain and thus with different interaction potential with the membranes. [11, 32] DAG-lactones can bind in either the sn-1 or sn-2 orientations, depending on their pattern of substitution, and the bryostatins appear to form a cap over the C1 domain, in contrast to the typical ligands, where the hydrophobic side chains project into the membrane. [33] Additionally, the membrane interaction is associated with insertion of the top of the C1 domain into the membrane. [19] The energetics of binding will therefore be influenced by the energetics of this insertion. These in turn will reflect both the interactions of the membranes with the exterior of the C1 domain, some distance away from the binding cleft itself, and the change in energy when the C1 domain is shifted to the membrane from its previous location where it was stabilized when unliganded. Both for β-chimaerin and for PKCβII, the unliganded C1 domain is covered by other structural elements within the host protein, as would be expected given the relatively hydrophobic nature of the top of the C1 domain. [34, 35] The involvement of the C1 domain surface beyond the immediate area contacting the ligand, together with the lesser degree of conservation in this region of the C1 domain, provide abundant opportunities for expanding diversity. The influence of the K26Y substitution characterized here and elsewhere provides one example of impact of residues outside the binding cleft. [22]
Formation of a ternary complex of ligand, C1 domain, and membrane, of course, is only an initial element contributing to diversity of outcome. Ligand binding is thought to influence outcome through two mechanisms. The first mechanism is by stabilizing an active conformation of the protein. For PKC isoforms, for example, ligand binding is thought to lead to displacement of the pseudosubstrate region of the PKC from the catalytic site, freeing it for interaction with substrate. The second mechanism is through localization, bringing the C1 domain protein into contact with its effector targets. For example, Kazanietz and coworkers have suggested that localization of PKCδ to the plasma membrane, permitting the release of TNFα, was essential for PKCδ to induce apoptosis in LNCaP human cancer prostate cells, and they suggest that the failure of bryostatin 1 to cause plasma membrane translocation of PKCδ in these cells is responsible for its lack of apoptotic effect. [36] Since membrane composition and subdomains will influence both C1 domain interactions as well as potentially influence the localization of substrates, this provides a very powerful generator for diversity of response.
A hint of the magnitude of these contributors to diversity is provided by a combinatorial chemistry approach with DAG lactones, probing chemical space represented by the side chains while holding constant those elements that interact directly with the C1 domain. The activities of members of the combinatorial library were evaluated in a diverse series of biological assays; each response showed a different structural preference. [15]
A clear finding of our study was that the charge on the C1 domain was able to influence the membrane selectivity of the C1 domain in the presence of ligand. This was the case not only under conditions of biochemical reconstitution but also in the intact cell. Increasing charge along the rim of the C1 domain resulted in selectivity for lipids with higher anionic phospholipid concentrations. Also, the increased charge in the C1 domain demonstrated a preference for the plasma membrane, which contains the highest cellular content of phosphatidylserine and thus highest anionic charge. [37, 38] These factors contribute to the preferential association of the C1 domain with increased charge for the plasma membrane over the lower phosphatidylserine containing membrane compartments such as the ER and golgi. Given the critical role of localization in providing proximity between PKC and membrane bound substrates, such effects on localization would be expected to be important contributors to functional activity.
Changes in anionic lipid membranes have been shown to influence the association with cationic signaling complexes such as the myristoylated alanine-rich C kinase substrate (MARCKS) and K-Ras, demonstrating the importance of electrostatic interaction between charged protein domains and the membrane. [ 24] Those studies further emphasize the important regulatory role of variation in membrane surface charge and counterion concentrations on membrane association. Our results show the impact of this phenomenon for C1 domain and PKC association and add the additional element of the critical influence of the ligand on the protein complex and membrane interactions. A central finding of ours was that the nature of the ligand dictated the extent to which the C1 domain charge translated into membrane selectivity in vivo. We showed that the more hydrophilic ligands, such as ingenol 3-angelate, were the most sensitive to the effects of C1 domain charge on C1 domain localization. We speculate that this may contribute to the empirical observation that hydrophilic C1 domain ligands, in particular ingenol 3-angelate and prostratin (12-deoxyphorbol 13-acetate), have been the most divergent in biological activity compared to the typical, more hydrophobic phorbol esters, such as the tumor promoter phorbol 12-myristate 13-acetate (PMA). Ingenol 3-angelate has received FDA approval for treatment of actinic keratosis and is under investigation for treatment of nonmelanotic skin cancer. [39, 40] It is striking for its ability to recruit neutrophils in response to topical application. [41] Among other pharmacological differences, we had shown previously that ingenol 3-angelate was less effective than PMA at stabilizing C1 domain binding to liposomes. [24] Prostratin differed dramatically from PMA in that it blocked hyperplasia in mouse skin in response to PMA and was further able to inhibit tumor promotion in response to PMA, whereas the more hydrophobic PMA is the paradigmatic skin tumor promoter. [42, 43] Prostratin and its analogs have attracted particular attention because of their potential therapeutic utility to deplete latent HIV reservoirs. [44-46]
While the specific nature of the substituents on the ligand plays a critical role, the nature of the ligand template further contributes to membrane selectivity. Thus, the W22R variant had a greater influence on membrane association in the presence of DAG as compared to PMA. As discussed by Newton and coworkers, [23] this can contribute to PKC isoform selectivity, in that the C1b domains of the classic PKC isoforms contain Tyr at position 22, whereas the C1b domains of the novel PKC isoforms and the C1a domains of both the classic and novel PKCs have Trp at this position. Further variation at this position is found for some of the other families of C1 domain containing proteins. The phorbol ester responsive MRCKα/β have Val at position 22, MRCKγ has Leu at position 22, the C1a domain of PKD2 has Phe and the C1b domains of PKD1/2/3 have Lys at this position. Appropriate ligand choice may be able to distinguish these targets. We found, for example, that translocation in response to bryostatin 1 was not specially affected in the W22R mutant, whereas translocation in response to ingenol 3-angelate was.
It is important to emphasize, in any case, that selectivity also depends on the other factors contributing to membrane association; differences between ligands will be most evident under conditions in which the other contributors to membrane association are marginal. For example, whereas phorbol ester bound the W22R variant of the C1b domain of PKCδ with the same affinity as it did the wild-type, when the proportion of PS was reduced to 10% phorbol ester showed a 46-fold loss of affinity for the mutant but only a 4-fold loss of affinity for the wild-type. Thus, phorbol ester was either differentially affected by the W22R substitution or not depending on the nature of the other factors contributing to the binding complex. It is also important to note that the relationship we demonstrated for binding in vitro between the extent of C1 domain positive charge and the PS content in the membranes does not distinguish between two possibilities – either a specific interaction with PS or simply a charge contribution of PS that could be replaced by other anionic phospholipids.
In our studies, cotransfection with pairs of C1 domains differing in charge and tagged with different fluorescent reporters provided a powerful method for demonstrating differential localization and different response to different ligands. Such an approach could be used for screening of combinatorial libraries to identify other ligands which, like ingenol 3-angelate, are particularly sensitive in their action to membrane composition.
Experimental Section
Materials
[20-3H]Phorbol 12,13-dibutyrate ([3H]PDBu) (17.2 Ci/mmol) was from PerkinElmer Life Sciences (Boston, MA). PDBu, phorbol 12-myristate 13-acetate (PMA), ingenol 3-angelate, and prostratin were from LC Laboratories (Woburn, MA). Sapintoxin D was from Enzo Life Sciences International Inc (Farmingdale, NY). The bryostatin 1 was provided by the Developmental Therapeutics Program, NCI (Frederick, MD). Phosphatidyl-L-serine (PS), phosphatidylcholine (PC), and 1,2-dioctanoylglycerol (DOG) were purchased from Avanti Polar Lipids (Alabaster, AL). LNCaP human prostate cancer cells, fetal bovine serum (FBS), RPMI 1640 medium, and L-glutamine were obtained from the American Type Culture Collection (Manassas, VA). LB broth and LB agar plates used in bacterial culturing were purchased from K-D Medical, Inc. (Columbia, MD). Primers and site-directed mutagenesis kits were from Invitrogen (Life Technologies, Grand Island, NY). For SPR, all experiments were performed with a Biacore 3000 optical biosensor at 25°C. Sensor chip CM-5 with a carboxymethylated dextran matrix, EDC (1-ethyl-3-(3-dimethylaminopropyl) carbodiimide), NHS (N-hydroxysuccinimide), and P20 surfactant, buffers, NBS-EP and HBS-N, and GST-capture kit were obtained from GE Healthcare (Piscataway, NJ).
Introduction of charge mutations into the C1b domain of PKCδ
Point mutations of the amino acid residues at positions 7, 10, 22 and 26 of the C1b domain of PKCδ were introduced using the GeneTailor™ Site-Directed Mutagenesis System (Invitrogen) according to the manufacturer`s instructions. Numbering of the above positions within the C1b domain of PKCδ reflects the location of these residues internal to the C1b domain itself; i.e. the N-terminal histidine residue of the C1b domain (being labeled His1; see Figure1 A) corresponds to His231 of the full-length protein. For in vitro binding assays GST-(glutathione S-transferase)-labeled mutants of the isolated C1b domain were generated using the wild-type δC1b construct in a pGEX-5x-1 plasmid (GE Healthcare, Piscataway, NJ) as a template. For in vivo translocation studies, GFP-(green fluorescent protein)-tagged mutants of the full-length PKCδ were designed using a modified version of the original pEGFP-N1 plasmid (Clontech, Mountain View, CA) containing the recombinant sequence of wild-type PKCδ. Both of the above constructs had previously been prepared in our laboratory. [14,47] Single mutations were introduced in one step, whereas double mutants were generated in a stepwise fashion using the W22R single mutants (either the isolated δC1b or the full-length version of the W22R mutant) as templates. The presence of correct mutations was evaluated by DNA sequencing. Analysis of the DNA sequence of the mutants was conducted by the DNA Minicore (Center for Cancer Research, NCI, National Institutes of Health). Verification of the sequencing data was performed using the following software: BioEdit Sequence Alignment Editor V7.0.5 and DNA Baser Sequence Assembler V2.91.
Construction of Full Length PKCδ mutants Fused to mCherry
To generate a full-length recombinant PKCδ fused to red fluorescent protein (mCherry) at the N-terminus, the pEGFP-N1 plasmids containing the recombinant PKCδ charge mutants (designed in the previous steps) were first double digested with XhoI and MluI (New England BioLabs, Inc., Beverly, MA). The DNA fragments from this reaction were separated by agarose gel electrophoresis and the cDNA of PKCδ mutants was excised from the gel and subsequently purified with QIAquick Gel Extraction Kit (Qiagen Inc., Valencia, CA). Finally, the recombinant proteins were ligated into a modified pmCherry-N1 vector (Clontech) using the above XhoI and MluI restriction sites. (Note: prior to subcloning the PKCδ mutants into pmCherry-N1 we had modified the structure of the original vector by introducing an MluI restriction site into its multiple cloning site using the GeneTailor™ Site-Directed Mutagenesis System, in order to make it analogous to that of the modified pEGFP-N1 vector mentioned above.) The DNA sequences of the constructs were confirmed by DNA sequencing (DNA Minicore) and analysis (BioEdit, DNA Baser).
Expression and Purification of GST-tagged δC1b charge mutants from Escherichia coli
The pGEX-5X-1 plasmids containing the δC1b charge mutants were transformed into BL21-AI™ One Shot® Chemically Competent E. coli (Invitrogen). Transformants were incubated in LB Broth Medium (K.D. Medical) at 37°C until the optical density of the bacterial suspension reached 0.6 - 0.8. Expression of the GST-tagged mutants was induced with isopropyl-O-D-thiogalactopyranoside (0.3 mm) and L-arabinose (0.125%) (both from Sigma-Aldrich, St. Louis, MO) for 4 hours at 37°C. Bacterial cells were subjected to sonication in B-PER® Bacterial Protein Extraction Reagent, supplemented with Lysozyme (50 mg/ml) and DNase I (2,500 U/ml) (all from Pierce Biotechnological Inc., Rockford, IL). The GST fusion proteins were then purified using a B-PER GST spin purification kit (Pierce) according to the manufacturer`s instructions. The efficiency of the purification process was assessed by SDS-PAGE analysis. Protein concentration was evaluated with the Bio-Rad protein assay kit (Bio Rad, Life Science, Hercules, CA). Recombinant proteins were stored in glycerol (30%) at −80°C.
In vitro [3H]PDBu Assays
The WT and charge mutant C1 domains were assayed using the in vitro [3H]PDBu binding assay to obtain the individual dissociation constants (Kd values). The polyethylene glycol precipitation assay developed in our laboratory was utilized and has been described previously. [48] Competition assays were used to determine affinities (Ki values) of DOG and have been previously described. [20] Triton X-100, when used, did not exceed 0.003%. Assays were conducted in the presence of either phosphatidylserine (100 μg/ml) or of mixtures of phosphatidylserine:phosphatidylcholine (100 μg/ml) at the indicated w:w proportions.
Confocal Microscopy
LNCaP cells (between passage 5 and passage 24) were plated on Ibidi dishes (Ibidi, LLC) in RPMI-1640 medium containing FBS (10%) and L-glutamine (2 mm )and grown to 75% confluency at 37°C. Cells were transfected with GFP or mCherry-tagged constructs using Lipofectamine and Plus reagents (Invitrogen) per manufacturer's instructions. Translocation experiments were conducted 24 hours after transfection on Zeiss LSM 510 NLO or LSM 710 NLO confocal microscopes (Carl Zeiss, Inc.). For excitation of GFP and the green membrane marker, the argon laser at 488 nm was used; for mCherry and the red membrane markers, the 561 nm diode laser was used for excitation and filters of 495-534 nm were used for detecting emission. Compounds at the indicated concentrations were added and translocation or localization was monitored on the Zeiss software using a 63×1.4 NA oil objective. Internal membrane markers utilized were: ER-Tracker Red (E34250, Invitrogen), BODIPY FLC5-ceramide complexed to BSA (B22650, Invitrogen), MitoTracker Red (M-7512, Invitrogen), and LysoTracker Red (L-7528, Invitrogen).
Quantitation of Confocal Images
The Zeiss AIM software was used to obtain data
For GFP translocation to the membrane, at 0 and 5 min time points for each cell 2-3 regions of about 4 μm2 was selected and averaged in the cytoplasm and on the membrane. The average ratio of the mean intensity of the membrane/cytoplasm was determined as a measure of translocation. Since one pattern of translocation was the association with internal membranes, we also quantitated the average standard deviation of the pixel intensities in the cytoplasm. [22]
When comparing pixel color localization, 3 regions containing about 5 μm2 of pixels were selected in the cytoplasm and on the membrane at 0 and 10 min time points. The Zeiss Zen software divided the pixel colors into regions 1 (red), 2 (green) and 3 (yellow) and calculated the relative area of each color pixel in the selection. Thresholds were set so no background was incorporated in the calculations.
When calculating colocalization, the Pearson's correlation coefficient (PCC) was used to determine colocalization values (+1: perfect colocalization to −1: negative colocalization). [30, 31] Regions of green and red labeled cells at the same microscope settings were used to set threshold levels. Z-stacks of cells were taken at time points after an I3A exposure of more than 5 min. The images were then compressed and the PCC was determined across the whole cell.
SPR Analysis
Liposome preparation
Large unilamellar vesicles with a diameter of 100 nm, referred to as liposomes, were prepared for the surface plasmon resonance measurements. The control vesicles contained 1-palmitoyl-2-oleoyl-sn-glycero-3-phosphocholine (POPC) (80 mol %) and 1-palmitoyl-2-oleoyl-sn-glycero-3-phospho-l-serine (POPS) (20 mol %). The PMA-liposomes contained PMA (3.85 mol%), while the DOG-liposomes contained DOG (1,2-dioctanoyl-sn-glycerol) (5 mol%). The lipids used were from Avanti Polar Lipids (Alabaster, GA) dissolved in chloroform or, in the case of PMA, in chloroform: methanol: water (C:M:W 65:25:4).
Aliquots of lipids (POPC (48 μl, 10 mg/ml) and POPS (12 μl, 10 mg/ml each) for control liposomes, plus PMA (3 μl of 10 mm) or DOG (2.7 μl of 5 mg/ml) for PMA or DOG-liposomes) were mixed and dried under a stream of nitrogen, then were resuspended in HBS-N buffer (600 μl) to give a final concentration of 1 mg/ml. The samples were vortexed for 30 s, were subjected to four freeze-thaw cycles by placing them in a 42°C water bath and in dry ice alternately, and then were extruded 40 times through two-stacked 0.1-μm pore polycarbonate filters using a LipoFast microextruder (Sigma-Aldrich, St. Louis, MO) to form liposomes. Specified concentrations of liposomes refer to those of the constituent phospholipids. The liposomes were diluted 10 fold when applied to the Biacore.
Surface capture of GST-fused PKC and binding of liposomes
Anti-GST antibody (4700–5200 resonance units) was covalently bound to the surface of each of four flow cells of the chip according to the manufacturer's protocol in HBS-EP buffer (150 mM NaCl, 10 mM HEPES, 3 mM EDTA, 0.005% Surfactant P20 (pH 7.4)). Later on, HBS-N-buffer (150 mM NaCl, 10 mM HEPES, P20 (pH 7.4)) was used as running buffer at a flow rate of 20 μl/min.
Wild type or mutant (150μl of 150 nM GST-fused C1b domain of PKCδ (δC1b)) was injected on the surface of flow cells 2 or 3 and 4, respectively. The captured proteins gave signals between 300 and 600 RU. [49, 50] The stabilities of the captured surfaces over time were checked, and no significant decreases in signal intensity were detected. Flow cell 1 coated with anti-GST antibody was left without the GST-fused C1b domain of PKCδ to serve as a reference surface and a second flow cell containing 350 – 450 RU of wild type GST-δC1b was used as a positive control surface in each experiment. 10× diluted liposome mixture (240 μl)(final lipid concentration of 100 μg/ml) was injected over all four flow cells simultaneously. Kinetics of liposome association to and dissociation from captured GST-fused C1b PKC domain (flow cell 2) and its mutants (flow cell 3 and 4) were acquired for 12 and 10 minutes, respectively. After each round of injection, bound liposomes and captured proteins were completely removed by two consecutive passages of glycine (10 mM, pH 2) for 2 and 1 min, respectively, and two consecutive passages of octyl glucoside (1%) in NaOH (10 mM), for 1 and 0.5 min, respectively, followed by several 1 min injections of running buffer. All experiments were repeated three times.
Data treatment
Data of the primary sensograms and overlay plots were prepared with BIAevaluation 4.0 software (Biacore, GE Healthcare). The response from the reference surface (flow cell 1) was subtracted from that of each of the experimental flow cells to correct for refractive index changes, matrix effects, nonspecific binding, injection noise, and baseline drift. Then data were normalized to control surface capturing.
Statistical Analysis
Significance was determined with Graph Pad Prism 6 software, using the Student's t-test. A value less than 0.05 was deemed significant.
Supplementary Material
Acknowledgments
This research was supported by the Intramural Research Program of the National Institutes of Health, Center for Cancer Research, National Cancer Institute (Z1A BC 005270) and National Institute of Biomedical Imaging and Bioengineering (BEPS) . Imaging was done in the CCR Confocal Microscopy Core Facility, NCI.
References
- 1.Colon-Gonzalez F, Kazanietz MG. Biochim. Biophys. Acta. 2006;1761:827–837. doi: 10.1016/j.bbalip.2006.05.001. [DOI] [PubMed] [Google Scholar]
- 2.Newton AC. Chem. Rev. 2001;101:2353–2364. doi: 10.1021/cr0002801. [DOI] [PubMed] [Google Scholar]
- 3.Nishizuka Y. FASEB J. 1995;9:484–496. [PubMed] [Google Scholar]
- 4.Newton AC. J. Biol. Chem. 1995;270:28495–28498. doi: 10.1074/jbc.270.48.28495. [DOI] [PubMed] [Google Scholar]
- 5.Yang C, Kazanietz MG. Trends Pharmacol. Sci. 2003;24(11):602–608. doi: 10.1016/j.tips.2003.09.003. [DOI] [PubMed] [Google Scholar]
- 6.Kazanietz MG. Biochim. Biophys. Acta. 2005;1754(1-2):296–304. doi: 10.1016/j.bbapap.2005.07.034. [DOI] [PubMed] [Google Scholar]
- 7.Blumberg PM, Kedei N, Lewin NE, Yang D, Czifra G, Pu Y, Peach ML, Marquez VE. Current Drug Targets. 2008;9:641–652. doi: 10.2174/138945008785132376. [DOI] [PMC free article] [PubMed] [Google Scholar]
- 8.Dempsey EC, Newton AC, Mochly-Rosen D, Fields AP, Reyland ME, Insel PA, Messing RO. Am. J. Physiol. Lung Cell Mol. Physiol. 2000;279:L429–438. doi: 10.1152/ajplung.2000.279.3.L429. [DOI] [PubMed] [Google Scholar]
- 9.Griner EM, Kazanietz MG. Nature Rev. Cancer. 2007;7:281–294. doi: 10.1038/nrc2110. [DOI] [PubMed] [Google Scholar]
- 10.Zhang G, Kazanietz MG, Blumberg PM, Hurley JH. Cell. 1995;81:917–924. doi: 10.1016/0092-8674(95)90011-x. [DOI] [PubMed] [Google Scholar]
- 11.Marquez VE, Blumberg PM. Acc. Chem. Res. 2003;36(6):434–443. doi: 10.1021/ar020124b. [DOI] [PubMed] [Google Scholar]
- 12.Tamamura H, Sigano DM, Lewin NE, Blumberg PM, Marquez VE. J. Med. Chem. 2004;47(3):644–655. doi: 10.1021/jm030454h. [DOI] [PubMed] [Google Scholar]
- 13.Wang QJ, Bhattacharyya D, Garfield S, Nacro K, Marquez VE, Blumberg PM. J. Biol. Chem. 1999;274:37233–37239. doi: 10.1074/jbc.274.52.37233. [DOI] [PubMed] [Google Scholar]
- 14.Wang QJ, Fang TW, Fenick D, Garfield S, Bienfait B, Marquez VE, Blumberg PM. J. Biol. Chem. 2000;275:12136–12146. doi: 10.1074/jbc.275.16.12136. [DOI] [PubMed] [Google Scholar]
- 15.Duan D, Sigano DM, Kelley JA, Lai CC, Lewin NE, Kedei N, Peach ML, Lee J, Abeyweera TP, Rotenberg SA, Kim H, Kim YH, El Kazzouli S, Chung JU, Young HA, Young MR, Baker A, Colburn NH, Haimovitz-Friedman A, Truman JP, Parrish DA, Deschamps JR, Perry NA, Surawski RJ, Blumberg PM, Marquez VE. J. Med. Chem. 2008;51(17):5198–5220. doi: 10.1021/jm8001907. [DOI] [PMC free article] [PubMed] [Google Scholar]
- 16.Mellor H, Parker PJ. Biochem J. 1998;332(Pt 2):281–292. doi: 10.1042/bj3320281. [DOI] [PMC free article] [PubMed] [Google Scholar]
- 17.Hurley JH, Newton AC, Parker PJ, Blumberg PM, Nishizuka Y. Protein Sci. 1997;6:477–480. doi: 10.1002/pro.5560060228. [DOI] [PMC free article] [PubMed] [Google Scholar]
- 18.Kazanietz MG, Wang S, Milne GWA, Lewin NE, Liu HL, Blumberg PM. J. Biol. Chem. 1995;270:21852–21859. doi: 10.1074/jbc.270.37.21852. [DOI] [PubMed] [Google Scholar]
- 19.Cho WH, Stahelin RV. Annu. Rev. Biophys. Biomol. Struct. 2005;34:119–151. doi: 10.1146/annurev.biophys.33.110502.133337. [DOI] [PubMed] [Google Scholar]
- 20.Wang QJ, Fang TW, Nacro K, Marquez VE, Wang SM, Blumberg PM. J. Biol. Chem. 2001;276:19580–19587. doi: 10.1074/jbc.M010089200. [DOI] [PubMed] [Google Scholar]
- 21.Pu Y, Peach ML, Garfield SH, Wincovitch S, Marquez VE, Blumberg PM. J. Biol. Chem. 2006;281:33773–33788. doi: 10.1074/jbc.M606560200. [DOI] [PubMed] [Google Scholar]
- 22.Geczy T, Peach ML, El Kazzouli S, Sigano DM, Kang JH, Valle CJ, Selezneva J, Woo W, Kedei N, Lewin NE, Garfield SH, Lim L, Mannan P, Marquez VE, Blumberg PM. J. Biol. Chem. 2012;287:13137–13158. doi: 10.1074/jbc.M111.320010. [DOI] [PMC free article] [PubMed] [Google Scholar]
- 23.Dries DR, Gallegos LL, Newton AC. J. Biol. Chem. 2007;282:826–830. doi: 10.1074/jbc.C600268200. [DOI] [PubMed] [Google Scholar]
- 24.Yueng T, Terebiznik M, Yu L, Silvius J, Abidi WM, Philips M, Levine T, Kapus A, Grinstein S. Science. 2006;313(5785):347–51. doi: 10.1126/science.1129551. [DOI] [PubMed] [Google Scholar]
- 25.Kedei N, Lundberg DJ, Toth A, Welburn P, Garfield SH, Blumberg PM. Cancer Res. 2004;64:3243–3255. doi: 10.1158/0008-5472.can-03-3403. [DOI] [PubMed] [Google Scholar]
- 26.Kedei N, Lubart E, Lewin NE, Telek A, Lim L, Mannan P, Garfield SH, Kraft MB, Keck GE, Kolusheva S, Jelinek R, Blumberg PM. Chembiochem. 2011;12(8):1242–1251. doi: 10.1002/cbic.201100064. [DOI] [PMC free article] [PubMed] [Google Scholar]
- 27.Braun DC, Cao Y, Wang S, Garfield SH, Hur GM, Blumberg PM. Mol. Cancer Ther. 2005;4(1):141–50. [PubMed] [Google Scholar]
- 28.Neri LM, Borgatti P, Capitani S, Martelli AM. Histol. Histopathol. 2002;17(4):1311–1316. doi: 10.14670/HH-17.1311. [DOI] [PubMed] [Google Scholar]
- 29.Zeiden YH, Hannun YA. J. Biol. Chem. 2007;282(15):11549–11561. doi: 10.1074/jbc.M609424200. [DOI] [PubMed] [Google Scholar]
- 30.Adler J, Parmryd I. Cytometry A. 2010;77(8):733–742. doi: 10.1002/cyto.a.20896. [DOI] [PubMed] [Google Scholar]
- 31.Adler J, Parmryd I. Methods Mol. Biol. 2013;931:97–109. doi: 10.1007/978-1-62703-056-4_5. [DOI] [PubMed] [Google Scholar]
- 32.Keck GE, Poudel YB, Rudra A, Stephens JC, Kedei N, Lewin NE, Peach ML, Blumberg PM. Angew. Chem. Int. Ed. Engl. 2010;49(27):4580–4584. doi: 10.1002/anie.201001200. [DOI] [PMC free article] [PubMed] [Google Scholar]
- 33.Pak Y, Enyedy IJ, Varady J, Kung JW, Lorenzo PS, Blumberg PM, Wang S. J. Med. Chem. 2001;44(11):1690–1701. doi: 10.1021/jm000488e. [DOI] [PubMed] [Google Scholar]
- 34.Canagarajah B, Leskow FC, Ho HY, Mischak H, Saidi LF, Kazanietz MG, Hurley JH. Cell. 2004;119(3):407–418. doi: 10.1016/j.cell.2004.10.012. [DOI] [PubMed] [Google Scholar]
- 35.Leonard TA, Rozycki B, Saidi LF, Hummer G, Hurley JH. Cell. 2011;144(1):55–66. doi: 10.1016/j.cell.2010.12.013. [DOI] [PMC free article] [PubMed] [Google Scholar]
- 36.von Burstin VA, Xiao L, Kazanietz MG. Mol. Pharmacol. 2010;78(3):325–332. doi: 10.1124/mol.110.064741. [DOI] [PMC free article] [PubMed] [Google Scholar]
- 37.van Meer G, Voelker DR, Feigenson GW. Nat. Rev. Mol. Cell Bio. 2008;9:112–124. doi: 10.1038/nrm2330. [DOI] [PMC free article] [PubMed] [Google Scholar]
- 38.Goldenberg NM, Steinberg BE. Cancer Res. 2010;70(4):1277–80. doi: 10.1158/0008-5472.CAN-09-2905. [DOI] [PubMed] [Google Scholar]
- 39.Lebwohl M, Shumack S, Stein Gold L, Melgaard A, Larsson T, Tyring SK. JAMA Dermatol. 2013;149(6):666–670. doi: 10.1001/jamadermatol.2013.2766. [DOI] [PubMed] [Google Scholar]
- 40.Cozzi SJ, Le TT, Ogbourne SM, James C, Suhrbier A. Arch. Dermatol. Res. 2013;305(1):79–83. doi: 10.1007/s00403-012-1270-0. [DOI] [PMC free article] [PubMed] [Google Scholar]
- 41.Challacombe JM, Suhrbier A, Parsons PG, Jones B, Hampson P, Kavanagh D, Rainger GE, Morris M, Lord JM, Le TT, Hoang-Le D, Ogbourne SM, Immunol J. 2006;177(11):8123–8132. doi: 10.4049/jimmunol.177.11.8123. [DOI] [PubMed] [Google Scholar]
- 42.Szallasi Z, Kraus KW, Blumberg PM. Carcinogenesis. 1992;13(11):2161–2171. doi: 10.1093/carcin/13.11.2161. [DOI] [PubMed] [Google Scholar]
- 43.Szallasi Z, Krsmanovic L, Blumberg PM. Cancer Res. 1993;53(11):2507–2512. [PubMed] [Google Scholar]
- 44.Kulkosky J, Culnan DM, Roman J, Dornadula G, Schnell M, Boyd MR, Pomerantz RJ. Blood. 2001;98(10):3006–3015. doi: 10.1182/blood.v98.10.3006. [DOI] [PubMed] [Google Scholar]
- 45.Bocklandft S, Blumberg PM, Hamer DH. Antiviral Res. 2003;59(2):89–98. doi: 10.1016/s0166-3542(03)00034-2. [DOI] [PubMed] [Google Scholar]
- 46.Wender PA, Kee JM, Warrington JM. Science. 2008;320(5876):649–652. doi: 10.1126/science.1154690. [DOI] [PMC free article] [PubMed] [Google Scholar]
- 47.Pu Y, Perry NA, Yang D, Lewin NE, Kedei N, Braun DC, Choi SH, Blumberg PM, Garfield SH, Stone JC, Duan D, Marquez VE. J. Biol. Chem. 2005;280:27329–27338. doi: 10.1074/jbc.M414132200. [DOI] [PubMed] [Google Scholar]
- 48.Lewin NE, Blumberg PM. Methods Mol. Biol. 2003;233:129–156. doi: 10.1385/1-59259-397-6:129. [DOI] [PubMed] [Google Scholar]
- 49.Stenberg E, Persson B, Roos H, Urbaniczky C. J. Colloid Interface Sci. 1991;143:513–526. [Google Scholar]
- 50.Cooper MA, Try AC, Carroll J, Ellar DJ, Williams DH. Biochim. Biophys. Acta. 1998;1373:101–111. doi: 10.1016/s0005-2736(98)00091-1. [DOI] [PubMed] [Google Scholar]
Associated Data
This section collects any data citations, data availability statements, or supplementary materials included in this article.