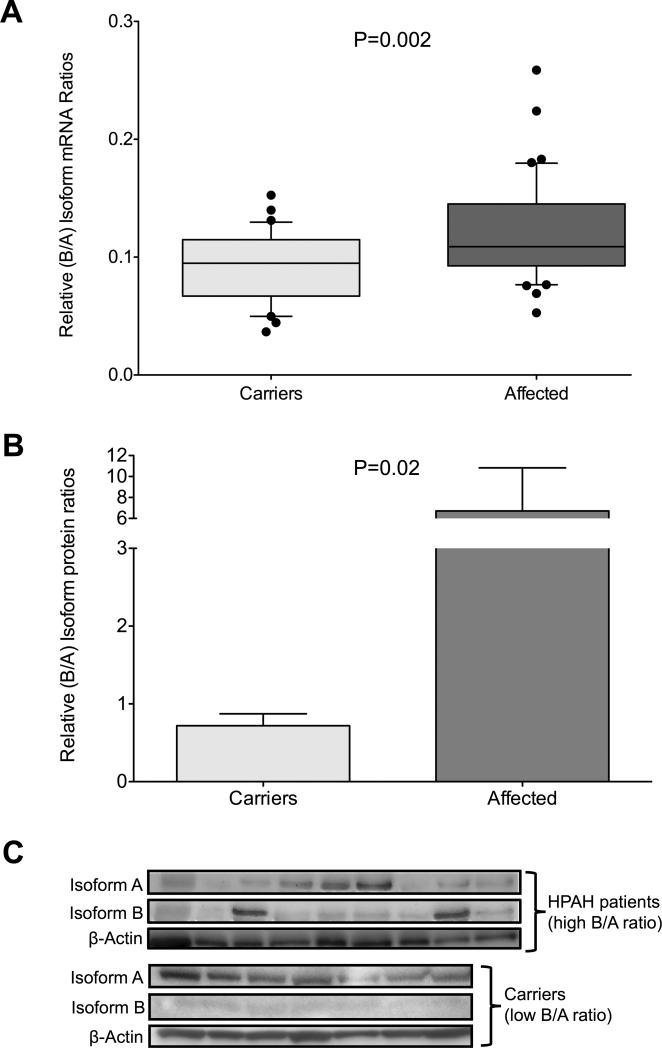
Figure 2. BMPR2 isoform ratios in CL derived from carriers (light gray, n=35) and affected individuals (dark gray, n=47).
A) Relative isoform-B versus isoform-A (B/A) mRNA ratio as determined by isoform specific real-time PCR. Real time PCR analysis was done three times with each sample run in triplicate. Results from one representative experiment are shown as box-and-whiskers plots with whiskers indicating Tukey whiskers and extreme data points indicated by filled circles. B and C) Western blot validation of the B/A ratios. Total cellular protein extracts from CL cell lines from 9 affected individuals with the highest B/A ratio and 7 carriers with the lowest B/A ratio were analyzed. Isoform mRNA expression data were analyzed in a nonparametric (Mann Whitney U-test) manner while WB densiometry data were analyzed using the Student's t-test. An α-level of 0.05 was chosen, and P-values < 0.05 were considered statistically significant. All P-values were two-tailed.

