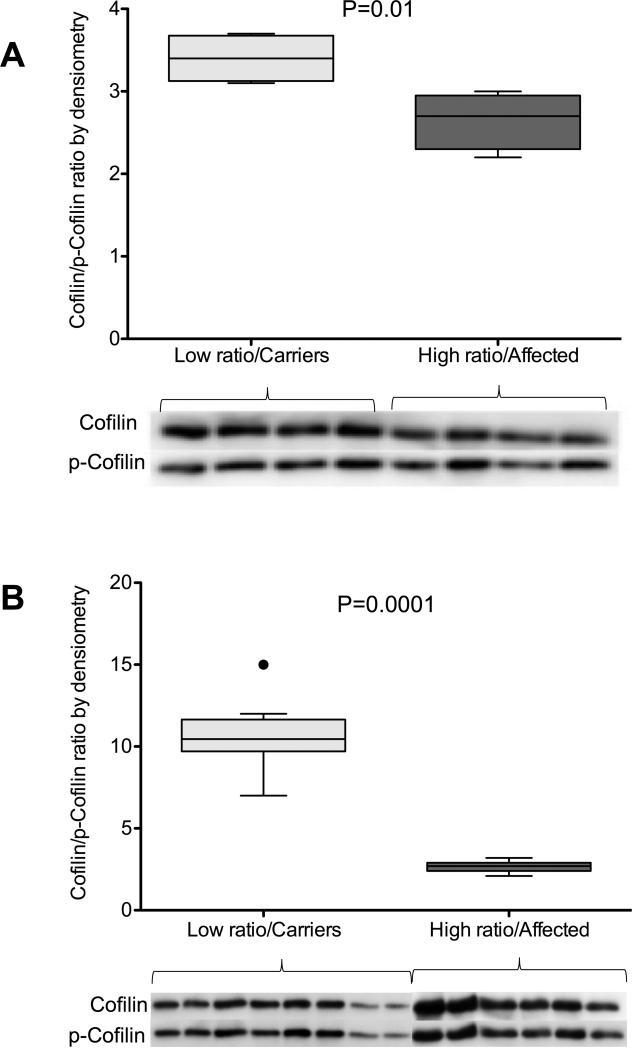
Figure 3. Cofilin signaling in response to stimulation by BMP.
A) Cofilin to p-cofilin ratio measured by western blot analysis and presented as densiometry units in CL cell lines with low B/A ratios (light gray, N=4) and high B/A ratios (dark gray, N=4) after 1 hour of exposure to 10 ng/ml BMP. B) Cofilin to p-cofilin ratio measured by WB analysis and presented as densiometry units in CL cell lines with low B/A ratios (light gray, N=8) and high B/A ratios (dark gray, N=6) after 2 hours of exposure to 20 ng/ml BMP. Data are shown as box-and-whiskers plots with whiskers indicating Tukey whiskers and extreme data points indicated by filled circles. An α-level of 0.05 was chosen, and P-values < 0.05 were considered statistically significant. All P-values were two-tailed.

