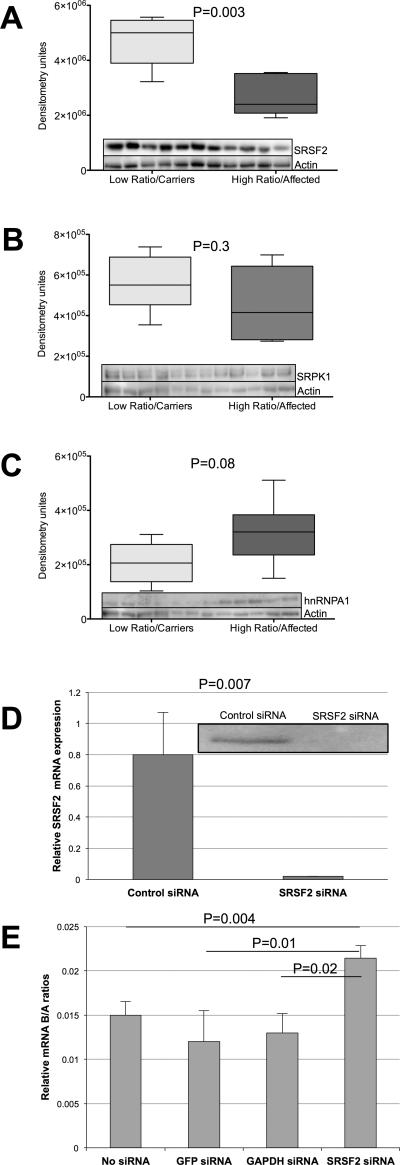
Figure 5. Splicing factor levels in high and low B/A ratio cell lines.
A) SRSF2 levels as detected by western blot analysis and shown as densitometry units in low (light gray, n=5) and high (dark gray, n=6) B/A ratio cell lines. B) SRPK1 levels as detected by western blot analysis and shown as densitometry units in low (light gray, n=5) and high (dark gray, n=6) B/A ratio cell lines. C) hnRNP1 levels as detected by western blot analysis and shown as densitometry units in low (light gray, n=5) and high (dark gray, n=6) B/A ratio cell lines. D) Real time PCR (graph) and western blot (inset) confirmation of siRNA-mediated SRSF2 knockdown in PMVECs. E) Determination of B/A ratio by real-time PCR in PMVECs after siRNA-mediated knockdown of SRSF2. An α-level of 0.05 was chosen, and P-values < 0.05 were considered statistically significant. All P-values were two-tailed.

